Electrochemical Dy-Alloying Behaviors of Inconel and Hastelloy in Molten LiF–CaF2–DyF3
2019 Volume 60 Issue 3 Pages 379-385

Details
2019 Volume 60 Issue 3 Pages 379-385
The electrochemical Dy-alloying behaviors of Inconel 600 and Hastelloy C-276 were investigated in a molten LiF–CaF2–DyF3 (0.30 mol%) system at 1123 K. Cyclic voltammetry and open-circuit potentiometry suggested the formation of several phases of Dy–Ni alloys. Potentiostatic electrolysis was conducted to prepare alloy samples using Inconel 600 and Hastelloy C-276 plate electrodes at 0.20 V vs. Li+/Li for 60 min. Cross-sectional scanning electron microscopy revealed that Dy–Ni alloys were formed in both samples. X-ray diffraction analysis confirmed the formation of DyNi2 as the predominant phase for both the samples. Phase separation of the alloy layer into the DyNi2 phase and formation of the agglomerated Cr–Fe and Cr–Fe–Mo phases were indicated by EDX mapping analysis.
Rare earth (RE) elements are currently utilized for many industrial materials. In particular, Nd–Fe–B magnets are used as motors for hybrid electric vehicles (HEVs) and electric vehicles (EVs) because of their strong magnetic properties. For the use of Nd–Fe–B magnets in high-performance motors of EVs and HEVs, their relatively low Curie temperature is a crucial problem because the higher operating temperatures of the motors exceed 473 K. Thus, Dy is added to Nd–Fe–B magnets to maintain their strong magnetic properties, even at the operating temperatures.
However, RE metals such as Dy and Nd have a problem with the maintaining of a stable supply due to the uneven distribution of RE resources. In 2017, China had 37% of the proven RE reserves and dominated 81% of the global RE supply.1) In the past, import prices of RE metals in Japan sharply increased in 2010–2012 due to the influence of the export restrictions in China. In addition, RE metals from the used magnet scraps are not presently recycled, except for those from the large magnets used in magnetic resonance imaging (MRI). Although the in-process recycling of RE metals is conducted in the magnet production plants, the recycling method utilizing hydrometallurgical leaching and solvent extraction has several disadvantages like multistep complicated processes, high environmental load, and high energy consumption. Based on this background, the development of a new recycling method of RE metals from magnet scraps is absolutely needed. It is urgently required to develop a simple, inexpensive, and environment-friendly recovery/separation process for RE metals discarded from the magnets of EVs and HEVs. Thus far, several pyrometallurgical processes have been proposed and investigated as new recycling methods.2–8)
We proposed a recovery and separation process of RE metals from magnet scraps using molten salt and an alloy diaphragm.6,9–16) In this process, two molten salt electrolytes are separated by a RE–iron group (IG) alloy diaphragm. Scraps of RE magnets are used as an anode and RE ions are dissolved into the molten salt in an anode chamber. RE elements are separated from each other in the alloy diaphragm by differences in the formation potential and the formation rate of RE–IG alloys. One RE element selectively penetrates the cathode chamber to be recovered as a cathode deposit, and the other RE element remains in the anode chamber.
First, we focused on RE–Ni alloy as the alloy diaphragm. We already reported the electrochemical behavior of RE elements (RE = Nd, Pr, and Dy) and the formation of RE–Ni alloys in molten LiF–CaF2–REF3 salts at 1123 K10–12,15) and molten NaCl–KCl–RECl3 salts at 973 K.13–16) Although Ni possesses a good RE separation ability, it is unsuitable for long-term use because of the brittleness and low durability of RE–Ni alloys.
Then, to develop a more durable alloy diaphragm, we selected iron-group alloys such as Inconel 600® (72Ni, 14–17Cr, 6–10Fe mass%) and Hastelloy C-276® (Ni balance, 14.5–16.5Cr, 15–17Mo, 4–7Fe, 3–4.5W mass%) as candidates for base materials. Since Cr, Mo, and W are hard to be alloyed with RE elements, these components are expected to reinforce the mechanical strength of the alloy diaphragm. In this study, we investigated the electrochemical Dy-alloying behaviors of Inconel 600 and Hastelloy C-276 in molten LiF–CaF2–DyF3 (0.30 mol%) system at 1123 K, because Dy is the most important RE element in the recycling of Nd–Fe–B magnets. The formed alloys were studied by X-ray diffraction (XRD), cross-sectional scanning electron microscopy (SEM), and energy-dispersive X-ray spectrometry (EDX).
The details of the experimental setup and procedure have already been reported elsewhere.12) LiF (Wako Pure Chemical Co., Ltd., 98%) and CaF2 (Kojundo Chemical Laboratory Co., Ltd., 99.9%) were mixed in the eutectic composition (LiF:CaF2 = 80.5:19.5 mol%), and 300 g of the eutectic mixture were loaded into a graphite crucible (Toyo Tanso Co., Ltd., IG-110, i.d. 90 mm × height 120 mm). The mixture in the crucible was first dried under vacuum at 453 K for 72 h. The crucible was placed at the bottom of a stainless-steel vessel in an air-tight Kanthal container and further dried under a vacuum at 773 K for 24 h. The electrochemical measurements were conducted in a dry Ar atmosphere at 1123 K in a glove box. Powdery DyF3 (Kojundo Chemical Laboratory Co., Ltd., 99.9%) was added directly into the melts. Three types of working electrode, wire (diameter: 1.0 mm), plate (10 mm width × 10 mm length × 0.1 mm thickness), and flag (diameter: 3.0 mm, thickness: 0.1 mm, wire diameter: 0.1 mm)17) were used. Materials for the working electrode were Ni (Nilaco Corp., >99%), Inconel 600® (Nilaco Corp.), Hastelloy C-276® (Nilaco Corp.), and Mo (Nilaco Corp., 99.95%). The components were Ni 72 mass%, Cr 14–17 mass%, and Fe 6–10 mass% for Inconel 600®, and Ni balance, Cr 14.5–16.5%, Mo 15.0–17.0%, Fe 4.0–7.0%, W 3.0–4.5% for Hastelloy C-276®. A Pt wire (Tanaka Kikinzoku Kogyo Corp., 99.95%, diameter: 1.0 mm) immersed in the bulk melt was adopted as a quasi-reference electrode and its potential was calibrated with reference to the potential of the Li+/Li dynamic electrode, which was prepared by electrodeposition of Li metal on a Mo electrode. All the potentials in this paper are reported with reference to the Li+/Li potential. The counter electrode was a glassy carbon rod (Tokai Carbon Co., Ltd., diameter: 3.0 mm, immersion depth: 10 mm). An electrochemical measurement system (Hokuto Denko Corp., HZ-7000) connected to a personal computer was used for the measurement. Cross-sections of the alloy samples prepared by potentiostatic electrolysis were characterized by field-emission scanning electron microscopy (FE-SEM; Hitachi Corp., SU-8020). Before the FE-SEM measurements, the samples were embedded in resin, polished with emery paper (#320, 600) and polycrystalline diamond suspension (3, and 9 µm), and coated with Au by an ion sputtering apparatus (Hitachi, Ltd., E-1010) to give conductivity. The compositions of the samples were analyzed by energy-dispersive X-ray spectroscopy (EDX; HORIBA Ltd., X-MaxN80). After SEM analysis, the fluoride salts covering the alloy samples were removed by a hand grinder (Kiso Power Tool Mfg. Co., Ltd, No. 28525-S). Subsequently, the alloy phases were identified by X-ray diffraction (XRD; Rigaku Corp., Ultima IV) using Cu-Kα radiation (λ = 0.15418 nm) at 40 kV and 40 mA.
Since Ni is the main component of Inconel 600 and Hastelloy C-276, the Dy-alloying behaviors were discussed with respect to the Dy–Ni system. According to the phase diagram of the Dy–Ni system18) (Fig. 1), there are nine intermetallic compounds; Dy3Ni2, DyNi, DyNi2, DyNi3, Dy2Ni7, DyNi4, Dy4Ni17, DyNi5, and Dy2Ni17 at 1123 K. There is also a liquid alloy at Dy-rich composition. The electrochemical formation of these Dy–Ni alloys is expected.

A binary phase diagram for the Dy–Ni system.18)
Figure 2(a) compares the cyclic voltammograms of Inconel 600 and Ni flag electrodes in a molten LiF–CaF2–DyF3 (0.30 mol%) system at 1123 K. General features of the voltammogram for Inconel 600 and Ni are similar to each other, suggesting that similar reactions occur at these two electrodes. In the negative scan direction for the Inconel 600 electrode, cathodic currents (A) are observed from 0.67 V (vs. Li+/Li), which is interpreted as the formation of Dy–Ni alloys according to our previous study.12) After that, cathodic currents (B) are observed from 0.42 V, which is explained by the formation of Dy–Ni alloys with higher Dy concentrations. After the reversal of the scanning direction, four anodic peaks (C), (D), (E), and (F) are observed, possibly corresponding to the dissolution of Dy from different Dy–Ni alloy phases.

Cyclic voltammgrams of (a) Inconel 600 flag electrode and (b) Hastelloy C-276 flag electrode in molten LiF–CaF2–DyF3 (0.30 mol%) at 1123 K. The voltammgram of a Ni flag electrode is also given for comparison. Scan rate = 50 mV s−1.
Figure 2(b) compares the cyclic voltammograms of Hastelloy C-276 and Ni flag electrodes. For the Hastelloy electrode, reduction currents (A’) and (B’) flow from 0.67 and 0.40 V, respectively. After the reversal of scanning direction, three anodic peaks (C’), (D’), and (E’) are observed. Although the general features of Hastelloy are also similar to that of Ni, less clear anodic peaks are observed suggesting that dealloying reactions proceed more slowly for Hastelloy. When the anodic peaks are compared between Hastelloy and Inconel, slower dealloying rate is also suggested for Hastelloy.
3.2 Open-circuit potentiometryOpen-circuit potentiometry was conducted for Inconel 600, Hastelloy C-276, and Ni wire electrodes after galvanostatic electrolysis at −0.3 A cm−2 for 100 s in a molten LiF–CaF2–DyF3 (0.3 mol%) system at 1123 K. Figure 3(a) compares the open-circuit potentiogram of Inconel 600 and Ni wire electrodes. The potential shifts in the positive direction with time due to reduction in the Dy concentration at the electrode surface as Dy diffuses toward the inside of the electrode. As for the Inconel 600 electrode, potential plateaus, which correspond to the two-phase coexisting state, are observed at 0.38, 0.56, and 0.76 V. These values almost coincide with those for the Ni electrode: 0.38, 0.57, and 0.77 V. Figure 3(b) shows similar features for the open-circuit potentiograms of Hastelloy C-276 and Ni wire electrodes: potential plateaus are observed at 0.41, 0.58, and 0.76 V.

Open-circuit potentiograms for (a) Inconel 600 wire electrode and (b) Hastelloy C-276 wire electrode after galvanostatic electrolysis at −0.3 A cm−2 for 100 s in molten LiF–CaF2–DyF3 (0.30 mol%) at 1123 K. The corresponding result for Ni wire electrode is also given for comparison.
Table 1 summarizes the observed potentials for the Ni, Inconel 600, and Hastelloy C-276 electrodes in molten LiF–CaF2–DyF3 (0.30 mol%) at 1123 K. The reported equilibrium reactions and the corresponding potentials for the Dy–Ni alloys are also listed.12) Since the potential plateaus for Inconel 600 and Hastelloy C-276 are observed at almost the same potentials as Ni, these plateaus are considered to correspond to different coexisting states of the Dy–Ni phases (eq. (1)).
| \begin{equation} \text{Dy$_{x}$Ni} + (y-x)\text{Dy(III)} + 3(y-x)\text{e$^{-}$}\leftrightarrows \text{Dy$_{\text{y}}$Ni} \end{equation} | (1) |

Dy–alloy samples were prepared by potentiostatic electrolysis of Inconel 600 and Hastelloy C-276 plate electrodes at 0.20 V for 60 min. Figure 4 shows (a) a cross-sectional SEM image and (b) an XRD pattern for the sample prepared from Inconel 600. The thickness of the Inconel 600 electrode increased from 100 µm to 170 µm due to the increase in volume along with the alloying. EDX analysis confirmed that the atomic ratio of Dy/Ni was 2.1 in the alloy layer. The XRD pattern confirms the formation of a predominant DyNi2 phase. According to the phase diagram of Dy–Ni systems (Fig. 1), there is possibility of formation of other phases such as DyNi3 and Dy2Ni7 between the alloy layer and Inconel substrate. However, no layer was confirmed by cross-sectional SEM/EDX, which is explained by the fast diffusion of Dy in DyNi2 phase.19)

(a) A cross-sectional SEM image and (b) an XRD pattern of the sample prepared by potentiostatic electrolysis of an Inconel 600 plate electrode at 0.20 V for 60 min in molten LiF–CaF2–DyF3 (0.30 mol%) at 1123 K.
The results for Hastelloy C-276 are also shown in Fig. 5. The thickness of the Hastelloy C-276 electrode was also increased to 170 µm. The Dy/Ni atomic ratio determined by EDX was 2.3. The formation of a predominant DyNi2 phase was also confirmed by XRD.

(a) A cross-sectional SEM image and (b) an XRD pattern of the sample prepared by potentiostatic electrolysis of a Hastelloy C-276 plate electrode at 0.20 V for 60 min in molten LiF–CaF2–DyF3 (0.30 mol%) at 1123 K.
The above samples were also analyzed by cross-sectional SEM-EDX mapping at high magnification. Figure 6(a) shows a cross-sectional SEM image and the mapping images for Dy, Ni, Cr, and Fe, for the sample prepared from Inconel 600. In the SEM image, formation of characteristic dark-spot patterns is observed. Considering the mapping images for Dy, Ni, and Cr, the dark-spot patterns contain high concentration of Cr and no existence of Dy–Ni alloy. Since Cr does not form a Dy–Cr alloy at 1123 K, according to the phase diagram shown in Fig. 7(a),20) the agglomerated Cr phase is considered to be formed during the formation of the Dy–Ni alloy. On the other hand, the mapping image for Fe is uniformly distributed in the entire alloy layer. Since Fe can form Fe–Dy intermetallic compounds (Fig. 7(b)21)) and a solid solution with Cr at all compositions (Fig. 7(c)22)) at 1123 K, Fe is contained both in the Dy–Ni phase and the agglomerated Cr phase.

Cross-sectional SEM and EDX mapping images of the sample obtained by potentiostatic electrolysis of (a) an Inconel 600 plate electrode and (b) a Hastelloy C-276 plate electrode at 0.20 V for 60 min in molten LiF–CaF2–DyF3 (0.30 mol%) system at 1123 K.
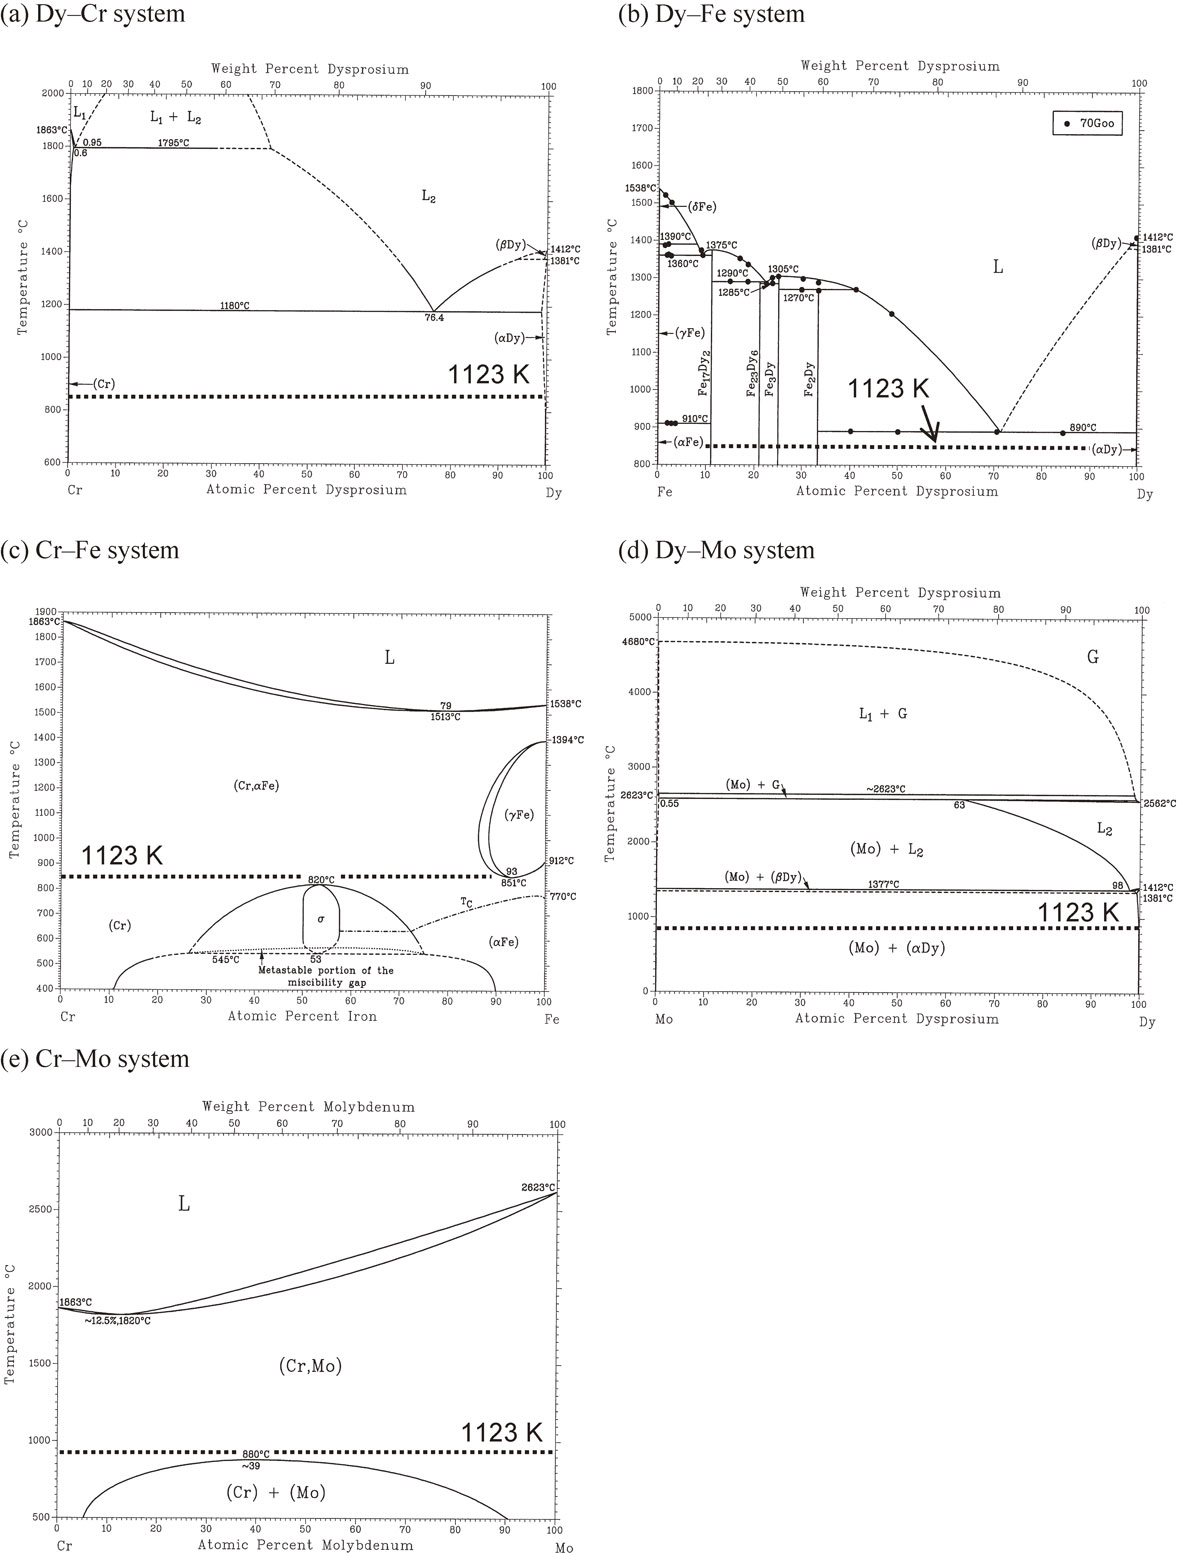
Figure 6(b) shows a cross-sectional SEM image and the mapping images for Dy, Ni, Cr, Fe, and Mo for the sample prepared from Hastelloy C-276. Again, the formations of characteristic dark-spot patterns with high concentrations of Cr and an even distribution of Fe are confirmed. Concerning the distribution of Mo, the concentration is also high at the dark spots having high concentrations of Cr. However, the aggregation degree of Mo is not as high as Cr. Although Mo does not form Dy–Mo alloys at 1123 K as shown in the phase diagram for the Dy–Mo system in Fig. 7(d),20) it is soluble in the Cr phase at concentrations up to 20 at%, based on the phase diagram of the Cr–Mo system in Fig. 7(e).23) Thus, considering that Fe is distributed evenly in the whole alloy layer, the dark spots probably consist of Cr–Fe–Mo solid solution. Since Dy is insoluble to this Cr–Fe–Mo agglomerated phase, the presence of the agglomerated spots retards the Dy diffusion in the alloy layer. This is consistent with the slow dealloying rate observed in the voltammogram in Fig. 2(b).
Figure 8 shows the predicted schematic of the inside of the alloy diaphragm, based on Inconel 600 or Hastelloy C-276 during the Dy penetration. The aggregated phases of Inconel 600 and Hastelloy C-276 are a Cr–Fe phase and a Cr–Fe–Mo phase, respectively. The presence of the agglomerated phase inside the alloy layer should improve the mechanical strength of the whole alloy compared to the case consisting of only Dy–Ni alloys. Considering that one of the promising morphologies of the agglomerated phase is a pillar of reinforced concretes, the relationship between the morphology and mechanical strength must be investigated. In addition, investigation of the structural and morphological change during the Dy dissolution at the dealloying interphase is necessary.

A predicted schematic of the inside of the alloy diaphragm, based on Inconel 600 or Hastelloy C-276 during Dy penetration.
The electrochemical Dy-alloying behaviors of the Inconel 600 and Hastelloy C-276 electrodes were investigated in a molten LiF–CaF2–DyF3 (0.30 mol%) system at 1123 K. The major results of this study are summarized as follows:
A part of this study was conducted as commission research with the New Energy and Industrial Technology Development Organization.