Abstract
The high-temperature creep mechanism in an extruded Mg alloy comprising an α-Mg matrix and a long-period stacking ordered (LPSO) phase was investigated by theoretical analyses, indentation creep tests, and finite-element (FE) simulations. The creep behaviors of the Mg alloy with the LPSO phase (a dual-ductile-phase alloy), as a potential next-generation lightweight material, were robustly predicted using the characteristic creep parameters, volume fractions, and creep strengths of the two constituent phases. The results of FE analysis showed that highly effective bridging phenomenon may occur at certain geometrical arrangements of the reinforcing phases, where a high reinforcement efficiency close to 1 could be achieved. The experimental results suggested that the creep strength of the dual-ductile-phase alloy closely followed the rule of mixtures and the isostrain rate conditions. The stress exponent n for creep of the dual-ductile-phase alloy was expressed by the harmonic mean weighted by the effective volume fractions of the constituent phases, which strongly depended on the deformation rate. In addition, n consistently fell between the corresponding values for the two constituent phases in the power-law creep region. A similar trend was observed for the deformation rate dependence of the creep activation energy Q, which was expressed by the weighted arithmetic mean value. Thus, the newly derived equations of n and Q were shown to quantitatively capture the mechanical contribution of the reinforcing phase to the creep strength of the overall dual-ductile-phase alloy.
This Paper was Originally Published in Japanese in J. Japan Inst. Met. Mater. 82 (2018) 108–116. In order to more accurately describe the characteristic phenomenon in the dual-phase structure model, a part of Fig. 13 was modified. The Refs. 26), 35), and 39) were also added.
1. Introduction
In order to prevent further global warming, reducing CO2 emissions from the transportation sector, including both the automotive and aircraft industries, is an urgent and challenging task. This can be achieved effectively through weight savings by improving the mechanical designs of vehicles and replacing mechanical components with lighter counterparts.1) Mg has attracted attention as a key element in next-generation lightweight materials, because it has the lowest specific gravity of commonly used metals, exists abundantly in seawater, and possesses superior recyclability.2) Mg-based alloys have excellent mechanical properties, including high specific tensile strengths, high rigidity-to-weight ratios, and high damping capacities. They have been employed for large-scale automobile parts including door frames, gear boxes, and cylinder blocks.3,4) However, conventional Mg alloys have much lower toughness and impact resistances compared to commercial Al alloys. Therefore, further enhancement of their mechanical properties is required for practical application.5)
Recently, it was shown that Mg–TM–RE alloys (TM = transition metal; RE = rare earth) can achieve high strengths and moderate ductility levels by appropriately controlling their microstructures using hot extrusion processing.6,7) The ternary Mg alloys comprising a fine-grained α-Mg matrix and a long-period stacking ordered (LPSO) phase have outstanding mechanical properties, as well as good heat resistance and flame retardancy.8) Therefore, the advanced Mg alloys are expected to replace conventional Al alloys as next-generation lightweight structural materials.9)
Generally, when the matrix and reinforcing phase are ductile and have distinct creep characteristics, the creep behavior of the overall dual-ductile-phase alloy is more complex than that of pure metals or single-phase alloys. However, the creep theory of such alloys has not yet been sufficiently established.10–14) It is important to develop a general method for elucidating the high-temperature creep mechanism of dual-ductile-phase alloys, as this may reduce the development time necessary for new complex-structured materials.
Ankem et al.10) considered elastic interactions and interfacial sliding between constituent phases and derived the constitutive equation for creep in a dual-phase alloy by combining the constitutive equations for each single phase in the alloy using the rule of mixtures. Ravichandran and Seetharaman11) used constraint factors to correct the equivalent stress occurring in the matrix and derived the constitutive equation for creep in a dual-phase alloy, where the reinforcing phases were assumed to be rigid, cubic, and placed uniformly in the matrix for the sake of simplicity. Goto and McLean12) showed that the creep strength decreased markedly when the interfacial boundaries were weakened in metal matrix composites (MMCs). In addition, they showed that load was no longer transmitted to the rigid reinforcing phase at zero interfacial strength, and that the creep strength under such a situation was lower than that of the matrix alone. Sato et al.13,14) studied the creep behaviors of MMCs with rigid reinforcing phases and showed that composite weakening and dispersion strengthening occurred in the low-stress region, where the strain gradient was completely relaxed by fast diffusion and interfacial sliding; in the high-stress region, where the strain gradient was partially relaxed by dislocation gliding, composite reinforcement occurred because of load transfer to the reinforcing phase.
However, to the best of our knowledge, no previous studies have theoretically derived an expression for the characteristic creep parameters (e.g., the stress exponent and activation energy for creep) in dual-ductile-phase alloys considering the corresponding values of the constituent phases. In addition, we could not find any report that clarified the mechanical contribution of the reinforcing phase to the creep strength of such alloys by combining analytical, experimental, and computational techniques.
In this study, analytical investigations, indentation creep tests, and finite-element (FE) simulations were conducted to reveal the high-temperature creep mechanism of a dual-ductile-phase Mg alloy with an LPSO phase (hereinafter referred to as the dual-phase alloy). These analyses fulfilled the following five research tasks:
-
•
Theoretical derivation of an expression relating the creep characteristics of the overall dual-phase alloy and the corresponding values of the two constituent phases
-
•
Estimation of possibly active slip systems in the region immediately below a conical indenter using a well-known indentation test method
-
•
Extraction of the creep characteristic values of the overall dual-phase alloy and of the equivalent single-phase alloys through an indentation testing technique
-
•
Investigation of the mechanism of deformation rate-dependence of the characteristic creep parameters of the dual-phase alloy (which was not observed for the single-phase alloys)
-
•
Exploration of the methods for quantifying the mechanical contribution of the LPSO phase to the creep strength of the overall dual-phase alloy
2. Experimental and Computational Methods
2.1 Specimens
The test materials used in this study were a dual-phase alloy Mg97–Zn1–Y2 (mol%) consisting of a fine-grained α-Mg matrix and the 18R LPSO phase, along with the corresponding single-phase alloys: (i) the α-Mg solid-solution alloy Mg99.2–Zn0.2–Y0.6 (hereinafter, “α-Mg alloy”) and (ii) the 18R LPSO-phase alloy Mg88–Zn5–Y7 (hereinafter, “LPSO alloy”). These were hot-extruded at a temperature of 723 K, with the extrusion ratio of 10 and ram speed of 2.5 mm/s. The resulting round rods with 9.4-mm diameters were cut into 3-mm-thick discs that were emery-polished and buffed to achieve a specular finish. Next, all specimens were annealed in Ar gas at a temperature of 700 K or less for several hours. The crystal orientation and grain size of the α-Mg matrix in the dual-phase alloy were measured using field-emission scanning electron microscopy (FE-SEM) coupled with an electron backscatter detection (EBSD) system. The mean grain size of the α-Mg matrix was adjusted to d = 2.6 µm, 3.0 µm, or 3.9 µm by changing the annealing temperature. In the α-Mg alloy, the corresponding grain sizes were d = 3.9 µm, 6.0 µm, and 8.2 µm, respectively. The standard deviation of the grain size distribution was ≤0.5d. Although the LPSO alloy was annealed at 673 K (equivalent to the highest test temperature), no significant changes in the SEM microstructure were observed.15)
2.2 Indentation creep test
The indentation creep tests were performed under vacuum at 586–673 K using a microindenter (Advance Riko Inc., Japan).16) Immediately before testing, ∼40 µm of the sample surface layer was removed by electropolishing. A diamond conical indenter (apex angle of 136°) was employed for normal indentation of the test surfaces (9.4-mm-diameter disks). The indentation load of F = F0 exp(2λt) was achieved using an applied voltage, where λ was the deformation rate parameter with the reciprocal dimension of time and t was the loading time.17) The initial load was F0 = 0.19 N, which was set less than 0.1 s after loading to allow the average microstructure to be placed within the indentation mark. Details of the testing technique were reported in detail elsewhere.18)
2.3 Elasto-plastic FE simulation
Computer simulations were performed using the general-purpose nonlinear FE program ABAQUS Standard (SIMULIA). An FE model imitating the dual-phase alloy (α-Mg matrix + LPSO phase) was prepared using a hexahedral primary reduced-integral element model with 48000 elements. In each element, elastic deformation (Young’s modulus Ei and Poisson’s ratio νi) and power-law creep ($\dot{\bar{\varepsilon }}_{i} = A_{i}\bar{\sigma }_{i}^{n_{i}}$, where $\dot{\bar{\varepsilon }}_{i}$ is the equivalent plastic strain rate, Ai is a constant, $\bar{\sigma }_{i}$ is the equivalent stress, and ni is the stress exponent for creep) were considered to occur. In the above equations, i = 1 and i = 2 indicate the matrix and reinforcing phases, respectively. No subscript is added for attributes of the overall dual-phase alloy. Here, the mechanical parameters were set to those approaching the experimental results, which were E1 = 36 GPa, E2 = 63 GPa, ν1 = ν2 = 0.35, A1 = 5.0 × 10⁻⁸ MPa−2 s−1, n1 = 2.0, A2 = 3.4 × 10⁻¹⁵ MPa−5 s−1, and n2 = 5.0. The volume fractions of the matrix and reinforcing phase were V1 = 0.75 and V2 = 0.25, respectively, as estimated from the SEM observations of the dual-phase alloy. In the FE simulations, the deformation rate and placement of the reinforcing phase were changed in corresponding ways to examine the temporal development of the contour patterns, such as the equivalent stress, equivalent plastic strain, and equivalent plastic strain rate.
3. Creep Theory for the Dual-Phase Alloy
In this section, we derive an equation that relates the characteristic creep parameters (stress exponent and activation energy) of the dual-phase alloy with the corresponding values of the two constituent phases. For both the dual-phase and single-phase alloys, the creep rate $\dot{\varepsilon }_{i}$ under the stress σi is assumed to obey the following power law:
| \begin{equation}
\frac{\dot{\varepsilon}_{i}}{\dot{\varepsilon}_{0}} = \left(\frac{\sigma_{i}}{\sigma_{0}}\right)^{n_{i}}
\end{equation}
| (1) |
Here,
ni is the stress exponent for creep and σ
0 is the reference stress, where
$\dot{\varepsilon }_{0}$ can be expressed as follows.
| \begin{equation*}
\dot{\varepsilon}_{0} = B_{i}\exp\left(-\frac{Q_{i}}{RT}\right)
\end{equation*}
|
Here,
Bi is a constant,
Qi is the activation energy for creep,
R is the universal gas constant, and
T is the test temperature.
In the dual-phase alloy, it is assumed that the matrix and reinforcing phase deform cooperatively with one another, satisfying the isostrain rate condition in a steady-state deformation:
| \begin{equation}
\dot{\varepsilon}_{1} = \dot{\varepsilon}_{2} = \dot{\varepsilon}
\end{equation}
| (2) |
In such a case, the load is transferred between phases according to the rule of mixtures for creep strength, based on the Voigt model:
| \begin{equation}
\sigma = \sigma_{1}V_{1} + \kappa\sigma_{2}V_{2}
\end{equation}
| (3) |
Here, κ represents the reinforcement efficiency (0 ≤ κ ≤ 1), which depends on the shape and placement of the reinforcing phase.
First, we derive the relationship between the stress exponent n for creep in the overall dual-phase alloy and the corresponding values n1 and n2 of the matrix and the reinforcing phase, respectively. Equation (1) is converted to logarithmic form and rearranged to obtain the following equation.
| \begin{equation}
\frac{1}{n} = \frac{\dot{\varepsilon}}{\sigma}\frac{\partial\sigma}{\partial\dot{\varepsilon}}\bigg|_{T}
\end{equation}
| (4) |
is substituted into
eq. (3), and
eq. (2) is applied to obtain the following equation.
| \begin{equation}
\frac{\partial\sigma}{\partial\dot{\varepsilon}}\bigg|_{T} = \frac{1}{\dot{\varepsilon}}\left(\frac{\sigma_{1}V_{1}}{n_{1}} + \frac{\sigma_{2}\kappa V_{2}}{n_{2}}\right)
\end{equation}
| (5) |
From
eqs. (4) and
(5),
n is expressed as follows.
| \begin{equation}
n = \frac{n_{1}n_{2}(\alpha V_{1} + \kappa V_{2})}{n_{2}\alpha V_{1} + n_{1}\kappa V_{2}}
\end{equation}
| (6) |
Here, α is the creep strength ratio of the constituent phases, given by the following equation.
| \begin{equation}
\alpha = \frac{\sigma_{1}}{\sigma_{2}}\propto \dot{\varepsilon}^{\frac{n_{2} - n_{1}}{n_{1}n_{2}}}\exp \left(\frac{n_{2}Q_{1} - n_{1}Q_{2}}{n_{1}n_{2}RT}\right)
\end{equation}
| (7) |
Next, we derive the relationship between Q for the overall dual-phase alloy and the corresponding values Q1 and Q2 for the constituent phases. The following equation is obtained from eq. (1).
| \begin{equation}
Q = -\frac{nRT^{2}}{\sigma}\frac{\partial\sigma}{\partial T}\bigg|_{\dot{\varepsilon}}
\end{equation}
| (8) |
is substituted into
eq. (3), and
eq. (2) is applied to obtain the following equation.
| \begin{equation}
\frac{\partial\sigma}{\partial T}\bigg|_{\dot{\varepsilon}} = -\frac{1}{RT^{2}}\left(\frac{Q_{1}\sigma_{1}V_{1}}{n_{1}} + \frac{Q_{2}\sigma_{2}\kappa V_{2}}{n_{2}}\right)
\end{equation}
| (9) |
From
eqs. (8) and
(9),
Q can be expressed as follows.
| \begin{equation}
Q = \frac{n_{2}Q_{1}\alpha V_{1} + n_{1}Q_{2}\kappa V_{2}}{n_{2}\alpha V_{1} + n_{1}\kappa V_{2}}
\end{equation}
| (10) |
Since
n and
Q include α, they depend on
$\dot{\varepsilon }$ and
T. Considering the values of
n and
Q under the conditions of varying
$\dot{\varepsilon }$ at a fixed temperature, for the purpose of simplification, we consider κ to be constant, so that the four-way combination can be evaluated. First, the cases of
n1 <
n2 are considered. When
$\dot{\varepsilon }$ is extremely low, α → 0, resulting in α
V1 ≪ κ
V2; from
eqs. (6) and
(10), we obtain
n ≅
n2 and
Q ≅
Q2. In contrast, when
$\dot{\varepsilon }$ is extremely high, α → ∞, so the equation becomes α
V1 ≫ κ
V2, and then we obtain
n ≅
n1 and
Q ≅
Q1. In the case of
n1 >
n2, when
$\dot{\varepsilon }$ is extremely low, α → ∞, resulting in α
V1 ≫ κ
V2, and
eqs. (6) and
(10) give
n ≅
n1 and
Q ≅
Q1, respectively. However, in the case where
$\dot{\varepsilon }$ is extremely high, α
V1 ≪ κ
V2, so
n ≅
n2 and
Q ≅
Q2. Therefore, the deformation rate dependency of the characteristic creep parameters in the dual-phase alloy is completely reversed, depending on the relative magnitudes of
n1 and
n2.
These results highlight the following important observations. The values n and Q are expected to lie in between the corresponding values of the two constituent phases in the power-law creep region.19) The dominant mechanism controlling the steady-state creep rate for the overall dual-phase alloy cannot be identified using only the values n and Q. This is because the creep-rate-controlling mechanism varies in each phase when the creep characteristics of the matrix and reinforcing phase significantly differ.
Next, we consider the physical meanings of n and Q for the dual-phase alloy. For the purposes of simplification, when αV1 = κV2 is used in eq. (6), the value of n can be expressed as the harmonic mean of the corresponding values of the two constituent phases: 2/n = 1/n1 + 1/n2. In addition, when the equivalences αV1 = κV2 and n1 = n2 are used in eq. (10), Q can be expressed by the arithmetic mean Q = Q1/2 + Q2/2. The latter expression was previously written by Maruyama.20) Therefore, the characteristic creep parameters for the dual-phase alloy is a weighted mean of the corresponding values of the two constituent phases (considering the effective volume fractions αV1 and κV2). Hence, these values can be used to evaluate the relative mechanical contributions from the reinforcing phase and matrix to the creep strength of the overall dual-phase alloy. The magnitudes of αV1 and κV2 depend on the deformation rate, where the characteristic creep values of the major constituent phase dominate those of the overall dual-phase alloy. In other words, this finding suggests that as the characteristic creep parameters of the dual-phase alloy approach the corresponding value for the reinforcing phase, the composite reinforcement mechanism becomes increasingly effective.
4. Results and Discussion
4.1 Microstructure of the dual-phase alloy
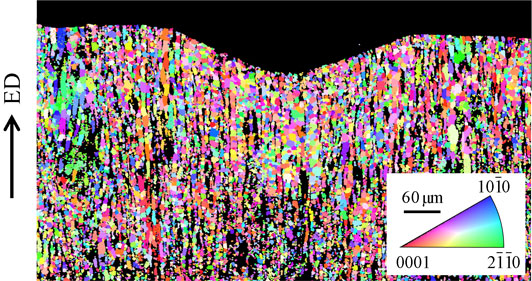
Figure 1 shows a representative SEM image of the three-dimensional microstructure of the dual-phase alloy. In the longitudinal section parallel to the extrusion direction (ED), the discontinuous fibrous LPSO phase (light gray) is aligned with the ED in the α-Mg matrix (dark gray). Meanwhile, in the cross-section perpendicular to the ED, the lamellar LPSO phase is uniformly observed in the α-Mg matrix. The area fraction of the α-Mg matrix is ∼75% for all cross-sections (i.e., a volume fraction of V1 ≅ 0.75 for the matrix and V2 ≅ 0.25 for the remaining LPSO phase). The values of V1 and V2 are unchanged after heat treatment.

The upper part of Fig. 2 shows the crystal direction map (CDM) obtained by the FE-SEM/EBSD method, where Fig. 2(a) shows the CDM cut along the longitudinal section, and Fig. 2(b) shows the case of the cross-section. The α-Mg grains are colored corresponding to the crystal direction, where the LPSO phase is represented in black. The α-Mg phase consists of equiaxed fine grains, and the LPSO phase is aligned with the ED at intervals of several α-Mg grains. The lower part shows the inverse pole figures (IPFs) of the corresponding α-Mg matrix. The dual-phase alloy forms a crystalline texture with the (0001) plane in the longitudinal-section direction and the $\{ 10\bar{1}0\} $ plane in the cross-section direction. It was previously reported that the LPSO phase has a crystalline texture similar to that of the α-Mg matrix.21)
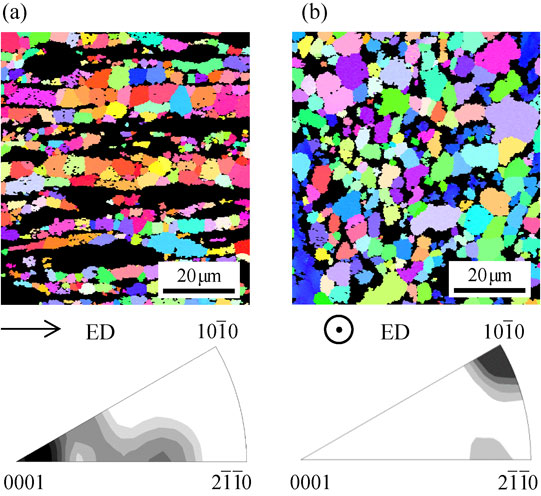
Figure 3 shows the CDM of the longitudinal section immediately under the indentation mark. In this case, indentation was performed with a conical indenter perpendicular to the cross-section at the highest test temperature of 673 K for a loading time of 5.4 ks. During this loading period, neither recrystallization nor microscopic cracking occurs in the region. These findings show that the indentation creep test is performed on a thermally stable microstructure. Although a small amount of as-worked α-Mg grains exist in the microstructure, it is thought that they have little influence on the cross-sectional indentation test results.
4.2 Possible slip systems activated by indentation
When a Vickers indenter is pressed into a single crystal, crystal rotation occurs locally in the region immediately below the indenter, normally accompanied by dislocation glide. Daniels and Dunn22) first proposed that the indenter facet controls the crystal rotation. Brookes et al.23) modified Daniels and Dunn’s equation and evaluated the activity level of the slip system according to the parameter P, a product of the Schmidt factor SF = cos ϕ cos θ and the activity coefficient f = 1/2 · (sin γ + cos ψ), which represents the degrees of freedom of crystal rotation.
| \begin{equation}
P = \frac{1}{2}(\sin\gamma + \cos\psi)\cos\phi\cos\theta
\end{equation}
| (11) |
Here, ϕ is the angle formed between the steepest direction
F of the indenter facet and the normal direction
n of the slip plane; θ is the angle formed by
F and the slip direction
s; γ is the angle formed between the direction
H, which is perpendicular to
F and parallel to the indenter facet, and
s; and ψ is the angle formed between
H and the crystal rotation axis
r. As will be seen, the maximum value of
f is at
H ⊥
s and
H //
r, and is a minimum at
H //
s and
H ⊥
r. If the values of critical resolved sheer stress (CRSS) of all the slip systems are the same, the slip systems with larger
P values (0 ≤
P ≤ 0.5) are activated more easily. Conversely, if there is no significant difference in
P values, the slip systems with the smaller CRSS values are activated more easily. The validity of such a criterion has been robustly confirmed via hardness tests on various single crystals.
24,25)
Here, a conical indenter with an apex angle of 136° was pressed perpendicularly into the $\{ 10\bar{1}0\} $-textured surface of the dual-phase alloy. The P value of each slip system was calculated using the unit cell dimensions of pure Mg.26) In one of the three crystallographically equivalent basal ⟨a⟩ slip systems, P = 0 as F·s = 0, while in the other slip systems, Pmax = 0.26 with SF = 0.30. Although we omit the details here, in prismatic ⟨a⟩ slip systems, Pmax = 0.49 with SF = 0.49; in pyramidal ⟨a⟩ slip systems, Pmax = 0.40 with SF = 0.43; and in pyramidal ⟨c + a⟩ slip systems, Pmax = 0.46 with SF = 0.47. Thus, the Pmax values are comparable regardless of the slip system; hence, the activity level of each slip system can be determined according to the magnitude of the CRSS.
Suzuki et al.27) reported that both the basal and non-basal ⟨a⟩ slip systems were activated in a high-temperature α-Mg alloy. Koike et al.28) analyzed a fine-grained Mg alloy and observed that intragranular sliding (IGS) due to the activity of the basal and non-basal ⟨a⟩ slip systems, in addition to grain-boundary sliding (GBS) with diffusion, occurred at high temperature. Regarding the LPSO alloy, Hagihara et al.29) reported that the basal and non-basal ⟨a⟩ slip systems were also activated at T ≥ 673 K. They also found that the CRSS of the non-basal ⟨a⟩ slip system or the formation stress of kink bands decreased to five times that of the basal ⟨a⟩ slip system at around 673 K.30) Therefore, when a conical indenter is pressed into the high-temperature dual-phase alloy, IGS due to the activity of the basal and non-basal ⟨a⟩ slip systems is accommodated by GBS in the fine-grained α-Mg matrix. In addition, it is predicted that IGS occurs in the high-temperature LPSO phase because of the activity of similar slip systems.31)
4.3 Effect of composite reinforcement on creep
Figure 4(a) shows the time dependence of the indenter displacement u (the distance from the original surface to the tip of the indenter) at 673 K for the dual-phase alloy, as well as the α-Mg and LPSO single-phase alloys. Hereinafter, these plots are called indentation creep curves. Disregarding the influence of the α-Mg grain size d on creep for now, all specimens with d = 3.9 µm are used for both the dual-phase alloy and α-Mg alloy. The curves indicate that the u values are the largest for the α-Mg alloy and smallest for the LPSO alloy at any time. The measured values of the dual-phase alloy consistently fall between the values for the two single-phase alloys. When the indenter displacement of each specimen is represented as ui, the indentation pressure can be expressed as pi ∝ F/ui2. The equivalent stress $\bar{\sigma }_{i}$ at the representative point in the deformed region and the corresponding pi are correlated as $\bar{\sigma }_{i} \cong p_{i}/3$.32) Hence, if the rule of mixtures for creep strength shown in eq. (12) holds, then eq. (13) can be derived:
| \begin{equation}
p = p_{1}V_{1} + \kappa p_{2}V_{2}
\end{equation}
| (12) |
| \begin{equation}
u = \frac{u_{1}u_{2}}{\sqrt{u_{2}{}^{2}V_{1} + u_{1}{}^{2}\kappa V_{2}}}
\end{equation}
| (13) |
The broken curves in
Fig. 4(a) represent the indentation time change in
u, setting κ = 0.5 or κ = 1.0 in
eq. (13). The indentation creep curve of the dual-phase alloy lies between the two broken curves when
t > 3.5 ks. This finding shows that the LPSO phase suppresses the deformation of the fine-grained α-Mg matrix and increases the creep strength of the overall dual-phase alloy for 0.5 ≤ κ ≤ 1.0.

Figure 4(b) shows the time dependence of the indentation creep rate $\dot{\varepsilon }_{\text{in}(i)} = \dot{u}_{i}/u_{i}$ and the indentation pressure pi determined from the indentation creep curves in Fig. 4(a). The $\dot{\varepsilon }_{\text{in}(i)}$ values approach a constant value of $\dot{\varepsilon }_{\text{in}(\text{s}i)} \cong \lambda $ over time, and the pi values also approach a constant value psi. At this point, pseudo-steady-state deformation occurs in the region immediately below the self-similar indenter.32) For the dual-phase alloy and the α-Mg alloy, ps = 31.8 MPa and ps1 = 22.4 MPa at t > 2 ks, respectively. Regarding the LPSO alloy, ps2 = 77.6 MPa at t > 4 ks and the corresponding equivalent stress is $\bar{\sigma }_{2} \cong 25.9$ MPa. This value is similar to the deformation stress of 24.2 MPa when the basal ⟨a⟩ slip system is activated in the unidirectionally solidified LPSO alloy at around 673 K.30) These results suggest that, although other slip systems may be activated under high stress at the initial stage of indentation, during pseudo-steady-state deformation, the basal ⟨a⟩ slip system is dominant. The value κ in eq. (12) is calculated from ps1, ps2, and ps in Fig. 4(b) as κ = 0.77. Including additional indentation creep test results, we obtained κ = 0.82 ± 0.07 at T = 673 K and 1.5 × 10⁻⁵ s−1 ≤ λ ≤ 1.5 × 10⁻³ s−1. According to the literature on unidirectional continuous fiber-reinforced materials,33) κ = 1 in the fiber direction and κ = 0 in the vertical direction. The value is known to be 0.2 ≤ κ ≤ 0.4 for materials reinforced with a random distribution of discontinuous fibers. The value of κ = 0.82 ± 0.07 obtained from the experiments is considered quite high; hence, it is concluded that the LPSO phase is an effective strengthening phase in the high-temperature dual-phase alloy.
4.4 Influence of α-Mg grain diameter on creep
Figure 5 shows the indentation creep curves for the dual-phase alloy with d = 2.6, 3.0, and 3.9 µm. These curves entirely overlap at 586 K, confirming the negligible effect of the α-Mg grain size on creep for this alloy at this temperature. However, at 600 K, smaller d values yield larger indenter displacements versus loading time. For a test temperature of 673 K, the difference is even more obvious; for T ≥ 600 K, the creep strength of this alloy apparently decreases as the ratio r of the grain boundary area occupied in the unit volume increases (where it is analytically derived that r ∝ 1/d). These results suggest that GBS in the fine-grained α-Mg matrix is significant in the high-temperature creep mechanism of the dual-phase alloy. Superplastic behavior caused by GBS in Mg alloys was previously reported in detail.34)
4.5 Creep analysis of single-phase alloys
When a conical indenter is pressed into the specimen surface with F = F0 exp(2λt), pseudo-steady-state deformation occurs in the region immediately below the indenter, where the contour patterns of the equivalent stress and equivalent plastic strain expand with increasing loading time while maintaining self-similarity.17) Considering the single-phase alloys, the following constitutive equation holds for steady-state indentation creep.35)
| \begin{equation}
\dot{\varepsilon}_{\text{in(s${i}$)}} = A_{0}\left(\frac{p_{\text{s}i}}{E_{i}}\right)^{n_{i}}\left(\frac{b}{d}\right)^{q_{i}}\exp \left(-\frac{Q_{i}}{RT}\right)
\end{equation}
| (14) |
Here,
A0 is a constant,
b is the magnitude of the Burgers vector, and
qi is the grain size exponent. It is known that the relationships
psi ∝ σ
s and
$\dot{\varepsilon }_{\text{in}(\text{s}i)} \propto \dot{\varepsilon }_{\text{s}}$ are true for the stress σ
s and strain rate
$\dot{\varepsilon }_{\text{s}}$ under uniaxial creep test conditions.
32)
Figure 6 shows double logarithmic plots of $\dot{\varepsilon }_{\text{in(s1)}}$ in the α-Mg alloy (d = 3.9 µm), where ps1 is normalized by the Young’s modulus E, where the values of E of pure Mg36) are used at each temperature. The data points follow a straight line for each temperature, where the data sets show parallel straight lines. The gradient of these lines corresponds to n1 = 2.4 for the temperature range 623–673 K. The value of n1 does not depend on the α-Mg grain size (3.9 ≤ d ≤ 8.2 µm), where the mean value is n1 = 2.4 ± 0.1 when the results for all grain sizes are averaged. Figure 7 shows Arrhenius plots of $\dot{\varepsilon }_{\text{in(s1)}}(E/p_{\text{s1}})^{n_{1}}$ for the α-Mg alloy (d = 3.9 µm). All data points follow a linear curve, the gradient of which corresponds to Q1 = 123 kJ/mol. This value is clearly larger than Qboundary = 92 kJ/mol for grain-boundary diffusion of Mg,19) and is similar to Qsolute = 120 kJ/mol for the mutual diffusion of Zn solute atoms in the Mg matrix and Qself = 135 kJ/mol for the self-diffusion of Mg.37) Figure 8 shows double logarithmic plots of $\dot{\varepsilon }_{\text{in(s1)}}(E/p_{\text{s1}})^{n_{1}}$ at 673 K and the reciprocal of α-Mg grain size (d = 3.9, 6.0, and 8.2 µm), where the linear gradient corresponds to q1 = 1.9.

The above results (n1 = 2.4, Q1 = 123 kJ/mol, and q1 = 1.9) suggest that the creep behavior of the fine-grained α-Mg alloy is rate-controlled by GBS accompanied by lattice diffusion (where the theoretical values are known to be n1 = 2, Q1 ≅ Qself ≅ Qsolute, and q1 = 2).38) This conclusion does not conflict with the interpretation of the creep behavior of the high-temperature dual-phase alloy discussed in section 4.4. These findings suggest that GBS occurs in the fine-grained α-Mg matrix in the dual-phase alloy; hence, each α-Mg grain can rotate to some extent in the mantle-like region within the region adjacent to the grain boudaries.39) As a result, the strain component in the c-axis direction of the α-Mg matrix is compensated, so that the moderate ductility is maintained.
Regarding the LPSO alloy, we have already reported40) that n2 = 5.5 ± 0.7 and Q2 ≅ 308 ± 50 kJ/mol were extracted for conditions of 623 ≤ T ≤ 673 K and 10−4 ≤ λ ≤ 10−2 s−1. The results suggest that the creep of the LPSO phase in the high-temperature dual-phase alloy is not rate-controlled by a recovery process related to dislocation climbing (where the creep characteristics are theoretically n2 = 5 and Q2 ≅ Qself).38) In addition, there is no evidence of the mechanism being rate-controlled by dislocation glide that drags the solute atmosphere (where n2 = 3 and Q2 ≅ Qsolute).38) Further discussion of these experiments will be reported elsewhere.
4.6 Creep analysis of the dual-phase alloy
Figure 9 shows double logarithmic plots of $\dot{\varepsilon }_{\text{in(s)}}$ versus ps/E for the dual-phase alloy. The data points follow a continuous curve for each temperature, where tangential gradients are used to calculate n versus $\dot{\varepsilon }_{\text{in(s)}}$ or ps/E. When these curves are moved laterally, they entirely overlap, indicating that n has no temperature dependence. In addition, these results exhibit that when $\dot{\varepsilon }_{\text{in(s)}}$ decreases from 4.5 × 10⁻³ s−1 to 1.0 × 10⁻⁴ s−1, n increases from 3.0 to 4.5. Figure 10 shows Arrhenius plots of $\dot{\varepsilon }_{\text{in(s)}}(E/p_{\text{s}})^{n}$ for the dual-phase alloy. The data points follow a straight line for each indentation creep rate, where the linear gradient corresponds to Q for creep at each $\dot{\varepsilon }_{\text{in(s)}}$. We observe that Q increases from 163 to 207 kJ/mol as $\dot{\varepsilon }_{\text{in(s)}}$ decreases from 1.5 × 10⁻³ to 2.5 × 10⁻⁴ s−1, while the temperature dependence of Q is not significant.

These findings indicate that the characteristic creep parameters of the dual-phase alloy gradually approach the corresponding values of the LPSO phase (n2 = 5.5 and Q2 ≅ 308 kJ/mol) as the deformation rate decreases. However, conventional creep theory for single-phase alloys cannot explain the deformation rate dependence of these characteristic creep parameters. The mechanism by which such creep behavior occurs is explored based on the experimental results in the following.
Figure 11 shows double logarithmic plots of $\dot{\varepsilon }_{\text{in}(\text{s}i)}$ versus psi/E for the α-Mg alloy, the LPSO alloy, and the dual-phase alloy. Here, ps1 of the α-Mg alloy is the lowest, ps2 of the LPSO alloy is the highest, and ps of the dual-phase alloy is consistently located between them. From the intersections of the horizontal line drawn using eq. (15) on the two straight lines showing the data from the single-phase alloys:
| \begin{equation}
\dot{\varepsilon}_{\text{in(s1)}} = \dot{\varepsilon}_{\text{in(s2)}} = \dot{\varepsilon}_{\text{in(s)}} = \lambda\ (\text{constant})
\end{equation}
| (15) |
the values of
ps1 and
ps2 at various λ are obtained. In the figure, the
ps values calculated from
eq. (12) are represented by a thick curve. Here, κ = 0.82 is employed. The curve closely matches the experimental data for the dual-phase alloy. These findings suggest that the creep behaviors of the constituent phases of the dual-phase alloy and the corresponding single-phase alloys can be considered practically equivalent. In addition, for the dual-phase alloy, the rule of mixtures for creep strength
(eq. (12)) and the isostrain rate condition
(eq. (15)) are valid, with close matching of experimental values. From
eq. (12), the degree of composite reinforcement χ =
ps/
ps1 of the dual-phase alloy is given by:
| \begin{equation}
\chi = V_{1} + \kappa V_{2}/\alpha
\end{equation}
| (16) |
Here, the creep strength ratio α =
ps1/
ps2 is obtained from the intersections on the two straight lines. When χ is calculated using α = 2.1 λ
0.23 and κ = 0.82, we determine χ values of 1.03, 1.23, and 1.56 at λ of 10
−2, 10
−3, and 10
−4 s
−1, respectively. These findings demonstrate that the LPSO phase in the dual-phase alloy acts more effectively as a reinforcing phase at lower deformation rates.
It is expected that the characteristic creep parameters of the dual-phase alloy depend not only on the deformation rate but also on the test temperature via α. However, we observe that n and Q are independent of temperature in Figs. 9 and 10. A generalized creep strength ratio α = 4.91 λ0.23 exp(−4.75/RT) is obtained by substituting α = 2.1 λ0.23 at 673 K and ni and Qi for each constituent phase into eq. (7). This calculation shows that the values of n and Q vary by only 1% over the range 10−4 ≤ λ ≤ 10−2 s−1 and T = 637 ± 37 K.
Figure 12 shows the relationship between n and Q and $\dot{\varepsilon }_{\text{in(s)}}$ in the dual-phase alloy. The upside-down sigmoidal curve is obtained by substituting the experimental values (n1 = 2.4, Q1 = 123 kJ/mol, n2 = 5.5, Q2 = 308 kJ/mol, α = 2.1 λ0.23, and κ = 0.82) into eqs. (6) and (10). Assuming Q1 = n1 and Q2 = n2 numerically, eq. (10) agrees well with eq. (6). Hence, by adjusting both vertical scale values (as shown in this figure), the dependence of characteristic creep parameters on the deformation rate in such a case can be represented using a single normalized curve for convenience. This theoretical curve shows that both values are intermediate between the corresponding values of each constituent phase for varying deformation rates. In this figure, n and Q determined for the dual-phase alloy are plotted. The experimental data follow the thick portion of the curve, which corresponds to the power-law creep region. Note that n and Q vary in the same way for $\dot{\varepsilon }_{\text{in(s)}}$ via α. These data points are close to the inflection point ($\dot{\varepsilon }_{\text{in(s)}} \cong 1.4 \times 10^{ - 4}$ s−1) of this curve, so they vary significantly depending on the magnitude of deformation rate.

Next, we consider the physical meaning of the creep characteristic values for the dual-phase alloy by rewriting eq. (12) as ps = (αV1 + κV2)ps2. Here, κ is regarded as nearly constant over the power-law creep region.41) In this experiment, n1 = 2.4 and n2 = 5.5, resulting in α in eq. (7) decreasing sharply as the deformation rate decreases. Therefore, when the deformation rate is extremely low, ps ≅ κV2ps2, and it is expected that the creep characteristics of the LPSO phase become dominant in the dual-phase alloy. Hence, the fine-grained α-Mg matrix cannot contribute to the creep strength of the overall dual-phase alloy because of weakening by GBS, and the mechanical contribution of the LPSO phase is somewhat increased. On the other hand, when the deformation rate is extremely high, ps ≅ V1ps1, resulting in the creep characteristics of the fine-grained α-Mg matrix becoming significant in the dual-phase alloy. These findings show that the magnitude of the load shared by each phase strongly depends on the deformation rate. The characteristic creep parameters of the dual-phase alloy depended on the deformation rate via the effective volume fraction of the α-Mg matrix, αV1. In the case of identical creep characteristics of the constituent phases, α = 1, and no such changes would be observed.
Figure 13 shows the results of FE analysis of the dual-phase structure model, where the reinforcing phase blocks (rectangles of length l and width w with l/w = 2.3) are separated at an interval S, and a spacing of length L in the matrix. In addition, it is assumed that the interface between the matrix and reinforcing phase is perfectly bonded.41) The FE simulations are performed by changing the deformation rate $\dot{\varepsilon }$ and the geometrical placement parameters S and L to examine the qualitative characteristics of κ. Taking S = 0.13w and L = 0.95l, Figs. 13(a)–(d) show contour patterns of the equivalent plastic strain $\bar{\varepsilon }_{i}$ occurring in the matrix and reinforcing phases when strained to 0.08 at four different constant deformation rates of $\dot{\varepsilon }$. From the characteristic creep parameters (Ai, ni) set used in the FE model, it is noted that α takes a value of 1 or less at $\dot{\varepsilon } \leq 3.0 \times 10^{ - 3}$ s−1; that is, σ1 ≤ σ2. Referring to Fig. 13(a), since α = 0.18 at $\dot{\varepsilon } = 10^{ - 5}$ s−1, the creep strength of the reinforcing phase is significantly higher than that of the matrix. Also, the results of FE analysis show that the average equivalent stress $\bar{\sigma }_{2}$ occurring in the reinforcing phase is 5.4 times higher than the corresponding value $\bar{\sigma }_{1}$ of the matrix, which is almost equal to σ1. That is, $\beta = \bar{\sigma }_{2}/\bar{\sigma }_{1} = 5.4$. The contour patterns show values of $\bar{\varepsilon }_{2} < 0.08$ in the reinforcing phase, while $\bar{\varepsilon }_{1} \cong 0.08$ and $\dot{\bar{\varepsilon }}_{1}$ of almost $\dot{\varepsilon } = 10^{ - 5}$ s−1 for the matrix. The value of κ can be evaluated by κ ≅ αβ, yielding κ ≅ 0.97. Figures 13(b) and 13(c) show values of $\bar{\varepsilon }_{i} \cong 0.08$ over the whole region. In these cases, $\dot{\bar{\varepsilon }}_{1} \cong \dot{\bar{\varepsilon }}_{2} \cong \dot{\varepsilon }$ is exactly valid. Then, it should be noted that a so-called “bridging phenomenon” occurs, where it appears as if the reinforcing phases are connected. Here, κ = 1.0 can be obtained because of α = 0.72 and β = 1.4 at $\dot{\varepsilon } = 10^{ - 3}$ s−1. Meanwhile, as for Fig. 13(d), α = 1.4 and β = 0.69 at $\dot{\varepsilon } = 10^{ - 2}/\text{s}$. Because the creep strength of the reinforcing phase is lower than that of the matrix, the contour patterns show values of $\bar{\varepsilon }_{2} \cong 0.08$ in the reinforcing phases and $\bar{\varepsilon }_{1} < 0.07$ for the matrix. In this case, the bridging phenomenon disappears and then κ = 0.97 occurs again. If the placement and shape of the reinforcing phase can effectively reduce the inhomogeneity, the bridging phenomenon occurs over a wide deformation rate range. In such cases, high reinforcement efficiency κ ≅ 1.0 is obtained. Actually in the dual-phase alloy as shown in Fig. 2(a), the complex shape of the LPSO phase is aligned parallel at narrow intervals corresponding to several times α-Mg grain size, S = 2d − 3d. Therefore, it is concluded that a high reinforcement efficiency of κ = 0.82 ± 0.07 was experimentally obtained at T = 673 K and λ = 10−5–10−3 s−1. These findings are expected to aid in understanding the creep behaviors of dual-ductile-phase alloys with complicated microstructures.

5. Conclusions
In order to elucidate the high-temperature creep mechanism of a dual-ductile-phase Mg alloy comprising a fine-grained α-Mg matrix and an LPSO phase, we derived a set of theoretical equations describing the characteristic creep parameters of the overall dual-phase alloy, performed indentation creep tests, and conducted FE simulations. The main results obtained are summarized as follows.
-
(1)
During the creep of the LPSO phase, the basal ⟨a⟩ slip system was dominant. However, the steady-state creep behaviors of the LPSO phase could not be explained using the conventional creep theory for single-phase alloys. Meanwhile, GBS occurred in the fine-grained α-Mg matrix, so that the strain component in the c-axis direction of the α-Mg grains could be compensated for maintaining the ductility.
-
(2)
The creep characteristic values n and Q of the dual-phase alloy strongly depended on the deformation rates, which were intermediate between the corresponding values of the two constituent phases in the power-law creep region. The magnitude of the load shared by the LPSO phase varied following the effective volume fraction in the mixing rule and as a function of the deformation rate.
-
(3)
The values of n and Q were theoretically predicted using the creep properties of single-phase alloys with the same composition as the constituent phases. The mechanical contribution of the LPSO phase to the creep strength of the overall dual-phase alloy could be estimated from the creep characteristic values of the constituent single-phase alloys.
-
(4)
In the power-law creep region, the LPSO phase effectively suppressed deformation of the α-Mg matrix by composite reinforcement, thereby achieving high creep strength. In addition, the bridging phenomenon occurred in the dual-phase alloy, yielding a high reinforcement efficiency.
-
(5)
To further improve the creep strength of the dual-phase alloy, an effective strategy is to increase the toughness and reinforcement efficiency of the LPSO phase. It is important to develop a method for elucidating the high-temperature creep mechanism of such an alloy, thereby reducing the development times of new materials with complicated microstructures.
Acknowledgements
This research work was supported by a grant from MEXT KAKENHI (number JP23109008) and JSPS KAKENHI (number JP16K06707). The test materials were supplied by Prof. Y. Kawamura of Kumamoto Univ., MRC. The indentation experiments were conducted by D. Takeda and T. Watanabe, and FE analysis was performed by K. Saito, who were graduate students of Nihon University. The authors acknowledge helpful discussions and suggestions from Dr. Ming Dao from MIT.
REFERENCES
- 1) M.K. Kulekci: Int. J. Adv. Manuf. Technol. 39 (2008) 851–865.
- 2) B.L. Mordike and T. Ebert: Mater. Sci. Eng. A 302 (2001) 37–45.
- 3) S. Kamado: J. JILM 60 (2010) 100–105.
- 4) W.J. Joost and P.E. Krajewski: Scr. Mater. 128 (2017) 107–112.
- 5) S.R. Agnew and J.F. Nie: Scr. Mater. 63 (2010) 671–673.
- 6) Y. Kawamura, K. Hayashi, A. Inoue and T. Masumoto: Mater. Trans. 42 (2001) 1172–1176.
- 7) S. Yoshimoto, M. Yamasaki and Y. Kawamura: Mater. Trans. 47 (2006) 959–965.
- 8) E. Abe, Y. Kawamura, K. Hayashi and A. Inoue: Acta Mater. 50 (2002) 3845–3857.
- 9) Y. Kawamura: Materia Japan 54 (2015) 44–49.
- 10) S. Ankem, H. Margolin, C.A. Greene, B.W. Neuberger and P.G. Oberson: Prog. Mater. Sci. 51 (2006) 632–709.
- 11) K.S. Ravichandran and V. Seetharaman: Acta Metall. 41 (1993) 3351–3361.
- 12) S. Goto and M. McLean: Acta Metall. 39 (1991) 165–177.
- 13) K. Kawabata, E. Sato and K. Kuribayashi: Acta Mater. 51 (2003) 1909–1922.
- 14) E. Sato, K. Kawabata, K. Kitazono and K. Kuribayashi: Mater. Trans. 45 (2004) 2295–2303.
- 15) T. Itoi, T. Seimiya, Y. Kawamura and M. Hirohashi: Scr. Mater. 51 (2004) 107–111.
- 16) M. Fujiwara: J. JILM 52 (2002) 282–290.
- 17) H. Takagi, M. Dao and M. Fujiwara: Acta Mech. Solida Sinica 21 (2008) 283–288.
- 18) H. Takagi, M. Dao and M. Fujiwara: Int. J. Mod. Phys. B 24 (2010) 227–237.
- 19) H.J. Frost and M.F. Ashby: Deformation-Mechanism Maps, (Pergamon Press, Oxford, 1982) pp. 43–49.
- 20) K. Maruyama: Bull. Jpn. Inst. Met. 20 (1981) 106–115.
- 21) D. Takeda, H. Takagi, M. Fujiwara, K. Higashida and Y. Kawamura: Collected Abstracts of the 2010 Spring Meeting of the Japan Inst. Metals, (2010) p. 264.
- 22) F.W. Daniels and C.G. Dunn: Trans. Am. Soc. Met. 41 (1949) 419–442.
- 23) C.A. Brookes, J.B. O’Neill and B.A.W. Redfern: Proc. R. Soc. London, Ser. A 322 (1971) 73–88.
- 24) K. Nakano, H. Matsubara and T. Imura: J. Jpn. Inst. Met. 41 (1977) 38–44.
- 25) M. Fukuchi and K. Watanabe: J. Jpn. Inst. Met. 46 (1982) 12–16.
- 26) E.A. Brandes and G.B. Brook: Smithells Metals Reference Book, (Butterworth-Heinemann, Oxford, 1992) p. 6-2.
- 27) M. Suzuki, T. Kimura, J. Koike and K. Maruyama: Mater. Sci. Eng. A 387–389 (2004) 706–709.
- 28) J. Koike, R. Ohyama, T. Kobayashi, M. Suzuki and K. Maruyama: Mater. Trans. 44 (2003) 445–451.
- 29) K. Hagihara, Y. Fukusumi, M. Yamasaki, T. Nakano and Y. Kawamura: Mater. Trans. 54 (2013) 693–697.
- 30) K. Hagihara, N. Yokotani and Y. Umakoshi: Intermetallics 18 (2010) 267–276.
- 31) K. Hagihara, M. Yamasaki, M. Honnami, H. Izuno, M. Tane, T. Nakano and Y. Kawamura: Philos. Mag. 95 (2015) 132–157.
- 32) H. Takagi, M. Dao and M. Fujiwara: Mater. Trans. 55 (2014) 275–284.
- 33) W.D. Callister, Jr.: Fundamentals of Materials Science and Engineering, (John Wiley & Sons, Inc., New Jersey, 2005) p. 643.
- 34) H. Watanabe, T. Mukai and K. Higashi: Kinzoku 71 (2001) 502–508.
- 35) H. Takagi, M. Dao, M. Fujiwara and M. Otsuka: Philos. Mag. 83 (2003) 3959–3976.
- 36) S.S. Vagarali and T.G. Langdon: Acta Metall. 29 (1981) 1969–1982.
- 37) W.F. Gale and T.C. Totemeier: Smithells Metals Reference Book, (Elsevier Butterworth-Heinemann, Oxford, 2004) pp. 13–10 and pp. 13–23.
- 38) K. Maruyama and H. Nakashima: Koonkyodo no Zairyokagaku, (Uchida Rokakuho, Tokyo, 1997) p. 94.
- 39) T.G. Nieh, J. Wadsworth and O.D. Sherby: Superplasticity in metals and ceramics, (Cambridge Univ. Press, Cambridge, 1997) p. 40.
- 40) H. Takagi and M. Fujiwara: Abstracts of Int. Sym. on LPSO Structure and Its Related Mater. 2016, (Kyoto, 2016) p. 40.
- 41) K. Saito, M. Fujiwara, H. Takagi and K. Shirai: Proc. JSPE Semestrial Meeting 2015S, (Tokyo, 2015) pp. 873–874.