Three-Dimensional Glass Furnace Model of Combustion Space and Glass Tank with Electric Boosting
2019 Volume 60 Issue 6 Pages 1034-1043
Details
2019 Volume 60 Issue 6 Pages 1034-1043
The integrated glass furnace model of combustion space and glass tank is established to study the 600 t/d float glass furnaces with and without electric boosting system. In the electric boosting furnace, the electrodes are vertically installed near hot spot, and the electric power is applied to replace part of fuel supply. The temperature and velocity fields as well as glass trajectories are presented to investigate the influence of electric boosting on the glass furnace. The residence time, melting factor and mixing factor are employed to evaluate the glass quality and melting efficiency. With the electric boosting system, the crown and flame temperature at flame covering zone are lower than the temperature in furnace without electric boosting, which would prolong the lifetime of glass furnace. However, the increased temperature at batch melting zone and fining zone are induced with the increased bottom temperature. Moreover, the glass flow at glass tank is promoted with electric boosting, especially around spring zone. The average melting efficiency and glass melting quality are improved with the electric boosting system, while the melting quality of fastest particles in electric boosting case would be poorer. Additionally, the homogenization of glass melt is improved with electric boosting. With the optimum design of electric boosting system, the better glass melting quality, more homogenization, and higher melting efficiency would be achieved.
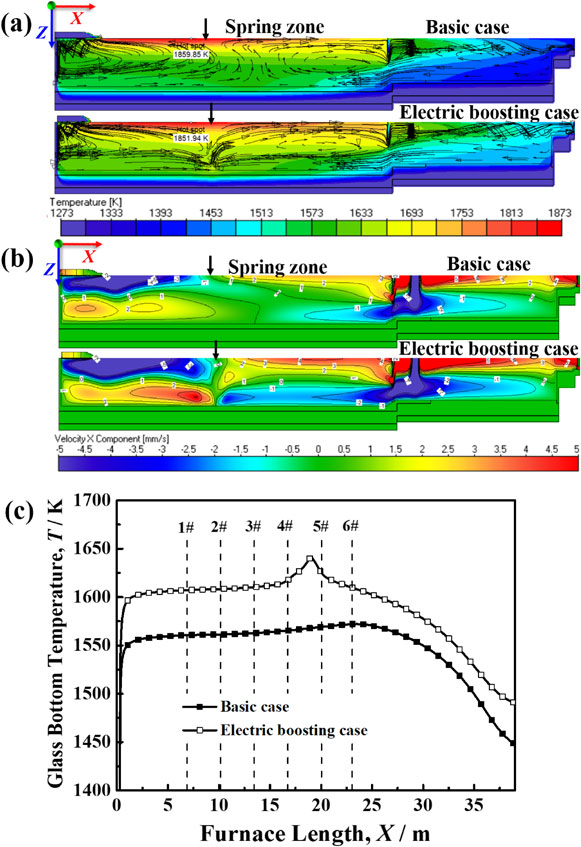
Fig. 8 Temperature contour and velocity field (a) Temperature contour and streamlines at symmetry plane, (b) Velocity component Vx at symmetry plane, (c) Glass bottom temperature at centerline of melting tank.
Electric melting is an energy efficient method to manufacture glass melt. With the immersed electrodes in the glass tank, the Joule heat is released directly into the glass itself, which would achieve the energy efficiency up to 80–90%.1,2) Since the invention of molybdenum electrodes in 1950s, the electric melting plays an important role in industrial glass furnace, for example the all-electric furnace and electric boosting furnace.1–3) Most of all-electric glass furnaces have been used for special glasses and the particular glasses with significant volatile constituents, as the furnaces usually present small size and simple structure.4,5) In the electric boosting furnace, the electric boosting system is incorporated into fuel-fired glass furnace to improve the glass melting quality and glass production. However, the heat released into glass melt by electrodes should not adversely affect the furnace performance, for instance generating convention flow in the wrong places or causing short cut flow that would reduce the effective residence time of glass melt at glass tank. Therefore, the designs of electric boosting system such as the electrodes positions, connection arrangement and so on would directly determine the efficiency of electric boosting system.
Numerical modeling has been proved to be a comprehensive, economical and efficient method to predict and optimize the operating conditions of glass furnace. With the improvement of numerical methods and computation availability, the comprehensive glass furnace models about batch melting, glass flow, fuel combustion and radiation heat transfer have been proposed.6–10) The heat transfer, flow patterns and temperature distribution in the glass furnace have been described. The glass quality and furnace performance are evaluated as well.
In the previous works, varied all-electric melting furnaces have been investigated, and the performances such as Joule heat release, electric power density distribution and temperature field, convection flow have been discussed. Choudhary11) describes a comprehensive three-dimensional mathematical model for all-electric furnace with industrial conditions. The electric potential, Joule heat release, temperature distribution and flow pattern of amber and flint glasses model are presented. It is found that the temperature of bulk glass is uniform, whereas the boundary glass has large temperature gradient. The temperature and maximum velocity of amber glass model show higher values than that of flint glass owing to the different effective thermal conductivity of glass melt.
Giessler12) presents a three-dimensional model of small-scale circular crucible, which is heated by two rod electrodes. In the model, the Lorentz forces are induced into glass melt with an additional external magnetic field. The Lorentz force has been proved to be a new way to influence the thermal driven convection flow and promote the homogenization of glass melt.
Li13) analyzes two all-electric melting furnaces with different production of 15 t/d and 36 t/d. It is found that the electric power density and temperature increase initially, then they decrease from center of glass furnace to the sidewall in horizontal direction, or decrease from top of glass furnace to bottom in vertical direction. The glass interior and exterior circulations are generated due to the temperature gradient. An unstable glass flow into dog-hole is observed in the 15 t/d all-electric furnace, which is prevented in the 36 t/d model with the contraction bottom at glass furnace. The annular strip images of corresponding glass product conform to the simulation results.
Yan14) employs the ANSYS Fluent software to analyze the float glass melting at the furnaces with or without electric boosting. In the models, the combustion space is neglected, while the heat transfer from combustion space to glass tank is replaced by the temperature boundary condition at glass surface. In the electric boosting case, the electrodes are installed vertically at the tank bottom before hot spot. The temperature boundary condition before hot spot has lower value than the temperature in furnace without electric boosting. However, the lower glass surface temperature before hot spot in electric boosting case is compensated by the electric boosting system. Furthermore, the promoted glass flow at glass tank is exhibited. From the available literatures, the simulations concentrate on the simple all-electric furnaces, while the comprehensive models of electric boosting furnaces composed of combustion space and glass tank are few.
In this paper, the coupled three-dimensional model of combustion space and glass tank is established with the Glass Furnace Model (GFM) software (Glass Service, Czech Republic). The 600 t/d float glass furnaces with and without electric boosting are simulated. In the electric boosting furnace, the electrodes are installed near the hot spot to enhance the convection flow around glass tank. The influences of electric boosting on the furnace temperature and convection flow are investigated. Additionally, the residence time distribution, particle trajectories, melting factor and mixing factor are presented to evaluate the glass quality and furnace performance.
The three-dimensional schematic of float glass furnace is illustrated in Fig. 1. The glass furnace is divided into combustion space and glass tank at the vertical direction. The combustion space is side-port regenerative type with six ports (from Port 1 to Port 6) on each side. The Port 1∼Port 5 contain three fuel burners below it, and Port 6 contains two fuel burners. The natural-gas is burnt with preheated air. In electric boosting furnace, the three-phase electric power is introduced to glass tank with three row electrodes. Each row has six rod-type electrodes. With the electric boosting system, the fuel supply in electric boosting furnace is decreased to 90% of basic case. The energy of decreased fuel supply in electric boosting furnace is equal to the Joule heat introduced by electric boosting system. The operating conditions of electric boosting are descripted as following.

Three-dimensional schematic of float glass furnace.
Table 1 shows the fuel ratio and excess air in each port. The diameter of burner outlet is 40 mm. Table 2 shows the operating conditions of combustion space in basic case and electric boosting case. The fluxes of cooling air in working end are varied in each case, which aims to regulate the canal temperature of combustion space at about 1348 K. The flame direction changes every 20 min, and the mass flow rate of exhaust gas in outlet port is determined by the fuel and air flow rate at opposite port.


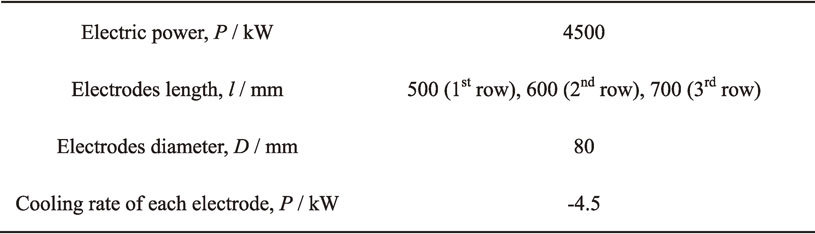
Table 3 shows the main operating conditions of glass tank. The batch material is fed into glass tank with two batch chargers. In the electric boosting case, the three rows electrodes are vertically installed at the bottom of glass tank, and between Port 4 and Port 5 which is near the hot spot. The length of each row electrodes is 500 mm, 600 mm and 700 mm, respectively, which aims to reduce the disturbance of glass flow induced by each row electrodes. The electric power ratio in each row electrodes is 30%, 30% and 40%, respectively. The electric parameters in electric boosting case are shown in Table 4.

With the complex phenomena occurring inside glass furnace and strong interlinks between combustion space, batch blanket and glass tank, the integrated three-dimensional numerical model is required to predict the operating conditions of whole glass furnace.
Figure 2 shows the schematic of three-dimensional glass furnace model in different sections. Figure 2(a) shows the x-z section at the symmetry plane of integrated glass furnace model. At initial conditions, the batch blanket is preset in the glass tank model with the length of 15.1 m, the width of 11.9 m and the height of 0.15 m. During the calculation process, the shape of batch blanket is changed based on the temperature around batch blanket. The final shape of batch blanket is determined by the heat balance and temperature around batch blanket.

Schematic of three-dimensional glass furnace model in varied sections (unit, m) (a) Symmetry plane, (b) A-A section, (c) Horizontal plane of glass tank in basic case, (d) Horizontal plane of glass tank in electric boosting case.
Figure 2(b) shows the side view (y-z section) at A-A section. The height of molten glass is set as 1.16 m. Figure 2(c) presents the horizontal plane (x-y section) of glass tank in basic case. In electric boosting case, the locations of electrodes are shown in Fig. 2(d). The distance from second-row electrodes to batch inlet is 18.4 m.
3.1 Combustion space modelThe thermal behaviors in combustion space are very complex due to chemical reaction, turbulence flow and radiation heat transfer. The three sub-models are applied to deal with the complex phenomena as briefly described.15) In the combustion space model, the regenerators are not taken into account due to its large size and expensive simulation. The heat recovery effect of regenerators is simplified with the defined heat recovery efficiency of 60%.16)
3.1.1 Combustion modelThe combustion reaction is simulated with the Eddy Dissipation Model that the influence of turbulence on reaction rate is taken into account. Both the Arrhenius rate and turbulence mixing rate are calculated. The smaller one is applied to calculate source terms in fuel transport equation (to express fuel burning) and energy equation (to introduce the reaction heat).17)
3.1.2 Radiation modelThe radiation heat transfer at combustion space is calculated with the discrete ordinates method (DOM) that solves the radiation transport equations (RTE) in discrete directions. Besides, the gray gas approximation is engaged to deal with the total emissivity of combustion gases.18,19)
3.1.3 Turbulent modelThe standard k-ε model is adopted to simulate the turbulence flow of combustion gases. Additionally, the wall function is employed to deal with the transition layer near solid walls.20)
3.2 Glass tank modelIn the glass tank, two sub-models are applied to simulate the batch melting process and molten glass behavior. In the electric boosting case, the electric model is added to the glass tank model.
3.2.1 Glass flow modelThe glass flow at glass tank is laminar due to its low velocity and high viscosity. The conservation equations including mass, momentum and energy equations are coupled by numerical method. The Rosseland approximation is implemented to calculate the radiation heat transfer at glass melt with the effective thermal conductivity.21,22)
3.2.2 Batch blanket modelThe batch blanket is normally formed at the front of glass tank, and covers a significant part of molten glass. In the simulation, the batch melting process is divided into three stages with respect to temperature. In the first stage with temperature less than 1123 K, the temperature of raw material is increased, and the physicochemical reactions occur. In the second stage with the temperature of 1123–1523 K, the chemical reactions occur as well as a portion of melt is formed. In the final stage with the temperature more than 1523 K, the batch material is completely melted.6,23) The reaction process determined by temperature is approximated with a batch conversion degree function as shown in eq. (1).24) The batch conversion degree α defines the degree of water vaporization and chemical reactions occurring at melting process. The value of α is in the range of (0, 1). The amount of reaction heat is proportional to the batch conversion degree. In the study, Tm represents the melting temperature which has the fastest reaction rate. ΔT represents the temperature interval centered at the temperature Tm, which most of energy is consumed or released by chemical reactions. In the study, the values of Tm and ΔT are set as 1173 K and 60 K, respectively. The reaction heat is added to the energy equation.
| \begin{equation} \alpha(\mathrm{T}) = 0.5 + \frac{1}{\pi}\arctan\left(\frac{T - T_{m}}{\Delta T} \right) \end{equation} | (1) |
In the electric boosting case, the electric potential field is generated in the glass melt because the glass melt is an electric conductive medium. The Joule heat is generated with the electric potential and electric current in the glass melt. In each control volume, the generated Joule heat is added to the energy equation as a source term.
3.3 Coupling of combustion space model and glass tank modelIn the simulation process, the calculation of glass furnace model is divided into combustion space model and glass tank model. The coupling plane is set at the bottom of combustion space model, which is coincident with the free surface of glass melt in glass tank model. The variables at the coupling plane are the temperature field and heat flux distribution. During the simulation process, the heat flux through the coupling plane is separately calculated in combustion space model and glass tank model. The couple of combustion space model and glass tank model is achieved since the difference of heat flux calculated by the two parts is converged. Finally, the temperature field at coupling plane is determined.17)
The net heat flux from combustion space to glass level is derived from a simplified balance of radiation heat flux as shown in eq. (2). The net heat flux equation is also appropriate for batch blanket, while the glass properties and heat fluxes are replaced by those of batch blanket.17)
| \begin{equation} Q_{\textit{net}} = \varepsilon_{g}\cdot (Q_{\textit{CM}} - \sigma\cdot (T_{\textit{gl}} + 273.15)^{4}) \end{equation} | (2) |
εg is the glass emissivity, QCM is the heat flux from combustion space, σ = 5.67 × 10⁻⁸ W·m−2·K−4 is the Stefan-Boltzmann constant, and Tgl is the glass level temperature.
3.4 Material propertiesThe combustion gases are regarded as a mixture. The density of the mixture is calculated with ideal gas law. The viscosity, the thermal conductivity and the specific heat of mixture are defined as a mass fraction average of pure species.
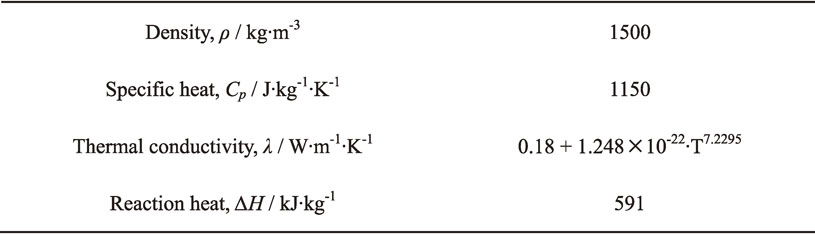
The typical soda-lime-silica glass is produced in this study. The thermophysical properties of batch blanket and molten glass are illustrated in Table 5 and Table 6, respectively.

The Glass Furnace Model (GFM) software (Glass Service, Czech Republic) is applied to simulate the 600 t/d float glass furnace in this study. The combustion space is divided into 721 × 138 × 97 cells, while the glass tank is divided into 285 × 230 × 57 cells. The grid density is increased at the region near burners, air/outlet ports, batch blanket, electrodes and neck. The finite volume method is used to deal with the discrete variables at calculation domain. The Symmetrical Coupled Gauss-Seidel (SCGS) method is employed to solve the governing equations.
In the study, the validation of the simulation results is carried out with the temperature measurement at industrial furnace. The calculated temperature is compared with the measured temperature as shown in Fig. 3, which is detected by the embedded thermocouples. The points of TC1∼TC6 represent the measured temperature at the inside crown refractories, which are corresponding to the center of port 1∼port 6 as shown in Fig. 2(a). It can be seen that the calculated temperature expresses good agreement with the measured temperature, except for the deviation at TC1, TC2, and TC6. The calculated temperature at TC6 has an absolute error of 50 K and a relative error of 3.4%, while the calculated temperatures at TC1 and TC2 have an absolute error of 30 K and a relative error about 2.0%. The calculated error at TC6 is due to the small fuel supply at port 6, which result in the low heat-recovery efficiency of regenerator (lower than the pre-set value of 60%). The calculated error at TC1 and TC2 is due to the accuracy of batch melting calculation as the points of TC1 and TC2 are closed to batch blanket.

Measured and calculated crown temperature of melting part in basic case.
Figure 4 shows the temperature contour at the symmetry plane of combustion space (Y = 8.75 m). Compared with the basic case, the crown and flame temperature in electric boosting case are decreased about 10 K at flame covering zone owing to the reduced fuel supply (90% of the basic case). Whereas the crown temperature in electric boosting case at the region without flame covering is slightly higher. It might be related to the temperature of glass tank at the region without flame covering. Additionally, the refractory erosion at combustion space in electric boosting case would slow down due to the decreased crown temperature. Consequently, the lifetime of combustion space would be longer in the electric boosting furnace.

Temperature contour of combustion space at symmetry plane (a) Basic case, (b) Electric boosting case.
In electric boosting case, the Joule heat is produced with the electric potential and electric current in the glass melt. Electric power density is defined as the Joule heat generated by the glass melt in per cubic meter and per unit time. Figure 5 shows the electric power density distribution in the different sections of glass tank. Figure 5(a) presents the horizontal section (x-y section) at the half length of electrodes (Z = 5.57 m), while Fig. 5(b) presents the vertical section (y-z section) at the second-row electrodes (X = 18.4 m). The electric power concentrates on the electrodes installed region. The maximum electric power density reaches 48 000 kW/m3 at the tips of electrodes. However, the electric power density declines sharply with the increased distance from electrodes.13,26)

Electric power density distribution at glass tank in electric boosting case (a) Horizontal plane at the half of electrodes (Z = 5.57 m), (b) y-z section at the second-row electrodes (X = 18.4 m).
In the combustion space model, the total energy released by fuel combustion is 46 058 kW in basic case and 41 463 kW (90% of the basic case) in electric boosting case. With the huge energy released by fuel combustion, the heat flux transferred from combustion space to glass tank is generated. The heat flux distributions from combustion space to glass level at the couple plane is shown in Fig. 6. The positive value indicates that the heat flux is transferred from combustion space to glass level, whereas the negative value means that the heat flux from glass level is absorbed by combustion space or batch blanket.

Heat flux distribution from combustion space to glass surface at the couple plane (a) Basic case, (b) Electric boosting case.
The major heat flux is related to the flame distribution as the heat flux density around the flame area is about 100–130 kW/m2. The low heat flux region near the back wall indicates the batch blanket where the heat flux from combustion space is absorbed by batch blanket. At the center of batch blanket, a small area with negative heat flux density appears in electric boosting case. It may be associated with the glass melt temperature at the small area. The negative heat flux appearing in working end is owing to the effect of cooling air. In comparison to basic case, the heat flux density in electric boosting case is slightly lower because of the reduced fuel consumption, especially at flame covering zone. By statistic, the total energy from combustion space to glass/batch surface is about 19 256 kW in basic case, and 15 521 kW in electric boosting case. Nearly 40% of combustion heat is transferred to glass level/batch surface in the glass furnaces.
4.3.3 Temperature and streamlines at glass surfaceFigure 7 shows glass temperature and streamlines on the glass surface. The spring zone is obvious which divides the melting tank into melting zone and fining zone as shown in Fig. 7(a). At the glass surface of melting zone, a strong back flow appears and brings molten glass from hot spring zone to batch melting zone. This hot glass flow provides the additional energy to accelerate the batch melting. At the surface of fining zone, the glass flows from hot spring zone to working end, then the glass melt gradually fines and homogenizes. Figure 7(b) presents the glass surface temperature at centerline of melting tank. The vertical dash lines denote the positions of corresponding ports at combustion space. The maximum temperature region near the 4th line is called the hot spot zone.
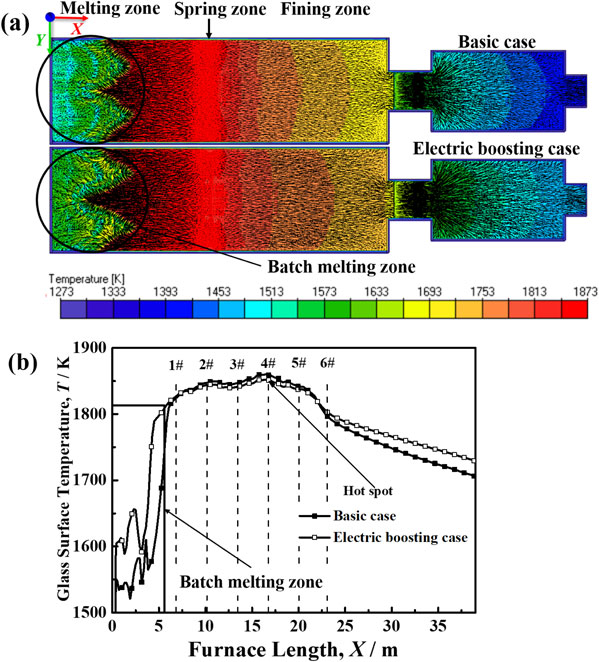
Temperature contour and streamlines at glass surface (a) Temperature contour and streamlines at section of glass surface, (b) Glass surface temperature curve at centerlines of melting tank.
In electric boosting case, the glass surface temperature at batch melting zone is obviously higher than that in basic case, whereas the area of batch melting zone is reduced, especially at the centerline of glass tank. In electric boosting case, the small area at the center of batch blanket with negative heat flux density is induced because of the existence of hot glass melt, that the large heat flux from glass melt to combustion space would be produced with the relatively high temperature of glass melt. Moreover, the relatively low radiation intensity of flame and crown refractories at the area is also responsible for the negative heat flux density. However, the glass surface temperature at flame covering zone in electric boosting case is slightly lower than that in basic case, which is due to the decreased heat flux density from combustion space to glass surface. After flame covering zone, the glass surface temperature at fining zone in electric boosting case is higher than that in basic case. Consequently, the crown temperature in electric boosting case at the region without flame covering is slightly higher. It implies that the batch melting and glass fining process would be accelerated in electric boosting case. The increased production and reduced fuel consumption would be implemented in the glass furnace with electric boosting system.
4.3.4 Temperature and flow patterns at symmetry planeThe glass temperature contour and flow patterns at the symmetry plane (Y = 8.75 m) are displayed in Fig. 8. Figure 8(a) shows the glass temperature and streamlines at the symmetry plane, while Fig. 8(b) presents the contours of velocity component Vx. In Fig. 8(b), the negative value indicates the backward flow, while the positive value represents the forward flow. The spring zone has the Vx approached to zero as the black arrows shown. As shown in Fig. 8, the glass flow in electric boosting case is greatly promoted, especially at the electrodes installed region. The glass flow around spring zone is also greatly enhanced since the electrodes installed region is closed to spring zone. As a result, more hot glass melt is brought from hot spot zone to melting zone, which would accelerate the batch melting.

Temperature contour and velocity field (a) Temperature contour and streamlines at symmetry plane, (b) Velocity component Vx at symmetry plane, (c) Glass bottom temperature at centerline of melting tank.
In Fig. 8(c), the tank bottom temperature in electric boosting case is increased about 50 K with the electric boosting system. The maximum bottom temperature is presented at the electrodes installed region. It is owing to the high energy efficiency of electric boosting, and the electric power density is concentrated on the electrodes installed region. Therefore, the glass temperature around electrodes is increased, which induces the promoted glass flow around electrodes. Besides, the higher temperature at batch melting zone and fining zone in electric boosting case is produced owing to the increased bottom temperature.
4.4 Performance of glass furnaceTo precisely describe the performance of glass furnace, the trajectories of 200 000 glass particles from batch inlet to glass outlet are recorded. The glass furnace performance is characterized with various approaches.27)
4.4.1 Residence time distributionResidence time is the time period that each glass particle spends from batch inlet to glass outlet. In the glass melting process, the sufficient residence time is required for the completely melting of glass particle.28,29) In this study, the residence time distribution of glass particles is calculated as shown in Fig. 9. The statistic average and minimum residence time are illustrated in Table 7. The minimum residence time (MRT) is derived from the trajectories of 200 fastest particles (0.1% of total particles).23,30)
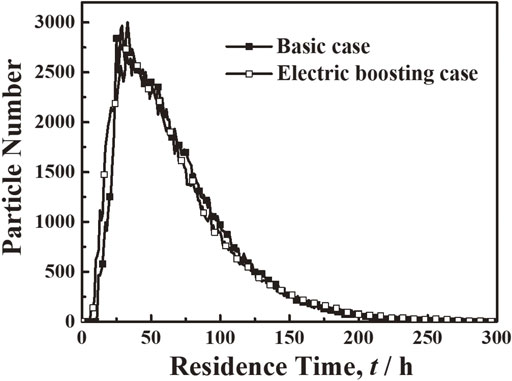
Glass residence time distribution.

In Fig. 9, the glass particles get to outlet at 5∼10 hours after released from batch inlet. The maximum number of particles reach outlet at 30 hours, and almost all of particles arrive at outlet after 250 hours. In Table 7, the average residence time is 68.4 hours in basic case, and 67.8 hours in electric boosting case. It is almost the same because of the consistent dimension and pull rate of glass furnace in each cases.31) In detail, the slightly shorter average residence time in electric boosting case is induced owing to the promoted glass flow at glass tank. It means that the glass melting efficiency in electric boosting case is slightly improved. The increased glass productivity would be achieved with the electric boosting system.
In the glass melting process, the longer MRT is desired to promote the sufficient melting and homogenizing of glass melt.32–34) In Table 7, the MRTs in basic case and electric boosting case are 12.3 hours and 8.0 hours, respectively. It indicates that a portion of glass particles in electric boosting case rapidly move through the glass tank owing to the promoted glass flow. Then the shorter MRT is induced in electric boosting case, which would result in poorer glass melting quality.
4.4.2 Trajectories of fastest particlesThe glass particles with MRT is called fastest particles. The trajectory of glass particle at glass tank is important for the glass melting quality.29) The typical trajectory of fastest particles from batch inlet to glass outlet is shown in Fig. 10. Figure 10(a) is the top view, and Fig. 10(b) is the side view. The path of the neighboring spherules is related to the movement at 10 minutes. The color donates the temperature. The larger velocity of glass particle is suggested with the sparse spherules.

Typical trajectory of fastest glass particle at glass tank (a) Top view, (b) Side view.
The trajectories of fastest particles in each case are different, especially around spring zone. In electric boosting case, the movement of fastest particle is faster, especially at melting zone and spring zone. Therefore, the MRT in electric boosting case is shorter than that in basic case, as well as the residence time of fastest particle at spring zone, where the glass melt has high temperature. In addition, the fastest particles temperature at spring zone in electric boosting case is lower than that in basic case, although the fastest particles temperature at melting zone and working end is slightly higher in electric boosting case. It is corresponding to the temperature fields of glass tank in Fig. 7 and Fig. 8.
4.4.3 Glass melting factor and mixing factorIn the glass tank, the glass convection flow and temperature field directly influence the performance of glass furnace. The trajectory of glass particle is derived from the temperature and velocity fields of glass tank. In the melting process, the trajectory with higher temperature, larger velocity gradient, and longer residence time would result in better glass quality.24) In this study, the melting factor is employed to evaluate the glass melting quality. The mixing factor is engaged to quantitatively evaluate the homogenization of glass melt. The fining process is more complicated as it is greatly dependent on the atmosphere and gas concentration, and it is not discussed in the study.
The melting factor and mixing factor are defined based on each glass trajectory. For a certain trajectory i, the melting factor is calculated by the integration of glass temperature divided by viscosity along the residence time of glass trajectory i as shown in eq. (3). Where tend is the residence time of glass particle at glass tank.24) According to the expression, the larger melting factor is related to higher temperature or longer residence time, which would result in better melting quality. However, the definition of melting factor is physical meaningless. In this study, the melting factor is engaged to evaluate the relative melting quality of glass melt.
| \begin{equation} MF_{i} = \int_{0}^{t_{\textit{end}}}\frac{T}{\mu}d\tau \end{equation} | (3) |
The mixing factor is defined as shown in eq. (4). Where ||grad v|| is the local velocity gradient tensor, and Dr is diffusivity of a typical inhomogeneous compound (Al2O3, SiO2, ZrO2), internally set to 1.5 × 10⁻¹². The d is the diameter of the inhomogeneity, and it is set to 0.01 m in this case. From the definition, the mixing factor is in proportion to the velocity gradient and residence time of glass particles. The value of mixing factor means how many times the inhomogeneity would be diluted as it flows along the trajectory. The larger mixing factor indicates that the glass melt is more homogeneous.
| \begin{equation} M_{\textit{mix}}F_{i} = \int_{0}^{t_{\textit{end}}}\frac{4\|{\text{grad }\mathbf{v}}\|^{2/3}\cdot D_{r}{}^{1/3}}{3(d^{2/3})}d\tau \end{equation} | (4) |
The average and minimum values of melting factor and mixing factor in each case are illustrated in Table 8. The minimum values are calculated based on the trajectory of 200 fastest particles (0.1% of total particles). In Table 8, the average melting factor in electric boosting case is larger than that in basic case because of the increased glass temperature. However, the minimum melting factor in electric boosting case exhibits lower value due to its shorter MRT, especially the shorter residence time at spring zone. Moreover, the lower temperature of fastest particles at spring zone in electric boosting case would also reduce the minimum melting factor, although the fastest particles temperature at melting zone and working end is slightly higher than that in basic case.
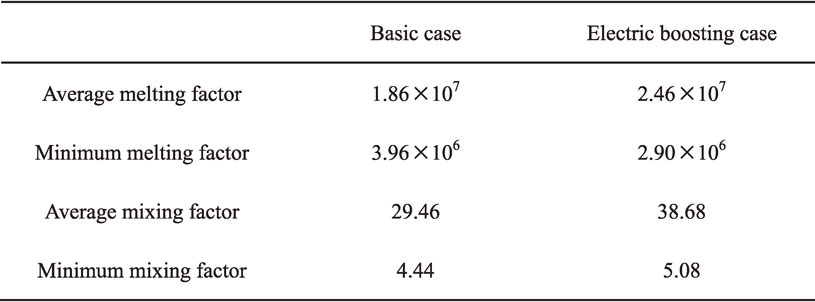
In Table 8, the average and minimum mixing factor in electric boosting case are larger than that in basic case. As shown in Fig. 8, the glass velocity as well as the velocity gradient are increased with the electric boosting. The velocity and velocity gradient of fastest particle in electric boosting case are also increased as the trajectory shown in Fig. 10. Therefore, the average mixing factor and minimum mixing factor are increased with the electric boosting system. Although the MRT of fastest particles in electric boosting case is shorter than that in basic case.
In summary, the average melting efficiency and glass melting quality are improved with the electric boosting system. However, the melting quality of fastest particles in electric boosting case would be poorer because of the shorter minimum residence time. Additionally, the homogenization of glass melt is improved with electric boosting because of the promoted glass flow at glass tank.
The integrated glass furnace model of combustion space and glass tank is completed to study the 600 t/d float glass furnace. The three row electrodes are installed at glass tank near hot spot. The effects of electric boosting on the heat transfer and glass flow patterns at glass furnace are investigated. The furnace performances of glass melting quality and melting efficiency are evaluated with the residence time, melting factor and mixing factor. The main conclusions are presented as following.
The work was supported by the National Key Research and Development Program of China (Grant No. 2017YFB0310202), the Major Program of Technology Innovation of Hubei Province of China (NO. 2017AAA117), and the Opening Project of State Key Laboratory of Advanced Technology for Float Glass.