2. Experimental Procedure
2.1 Specimen
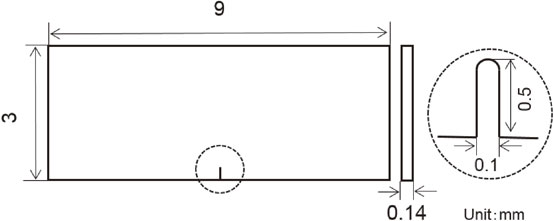
Ag nanoparticle paste with an average diameter of 100 nm was used. The paste was sintered at 523 K under a pressure of 5 MPa to create a strip-shaped plate material. The plate was then machined into a miniature sized flat plate specimen with a single notch (Single-Edge Notched) as in Fig. 1.10,13) The notch was introduced by a precision wire saw (50 µm in wire diameter).
2.2 Fatigue crack propagation test
The fatigue crack propagation test was performed in displacement-controlled pulsating tensile-tensile mode.13) The control waveform was symmetric triangular wave. The total displacement range was 4 µm–15 µm (equivalent to the nominal strain range 0.13%–0.50%). Test temperatures were three levels of 298 K, 333 K, and 448 K. The strain rate was 1 × 10⁻³/sec. A fatigue crack propagation machine was a fatigue test machine equipped with a piezo actuator (Saginomiya: LMH-207-20) as in Fig. 2. For measuring displacements, a capacitive displacement sensor installed near the specimen fixing jig was used; the values measured by the sensor were used for actuator controlling. Specimen temperature was raised by the ceramic heater installed inside a specimen fixing jig and test temperatures were controlled by the thermocouple fixed to the specimen fixing jig with the allowable range of ±2 K. Fatigue crack lengths were measured by video images recorded at each prescribed cycles by a microscope (Leica Z16 APO) installed on the upper part of the test machine.

In the test conditions of the large scale yielding, like this study, it is ideal to evaluate of the fatigue crack propagation using path-independent cyclic J-integral ΔJ. However, as it is difficult to calculate ΔJ by general purpose FEM code, assessment with a scalar parameter alternative to ΔJ is required. The author et al. have so far made the evaluation of fatigue crack propagation of pressureless-sintered Ag nanoparticles by the use of the inelastic energy density range ΔWin around the crack tip calculated by FEM as a scalar parameter alternative to ΔJ.13) This method is based on the assumption that the average of inelastic strain energy densities near the crack tip is representative of the mechanical environment of the region where damage is progressing in front of the crack tip. The calculation of ΔWin was carried out at the element group contained in the region surrounding the crack tip of FEM model, elemental solutions of inelastic strain energy densities were averaged to calculate the quantity of variation per fatigue cycle. The equation to calculate the average of element solutions is shown in eq. (1).11)
| \begin{equation}
\Delta W_{\text{in}} = \frac{\displaystyle\sum \Delta W_{\text{in}}^{\text{element}} \cdot V^{\text{element}} }{\displaystyle\sum V^{\text{element}}}
\end{equation}
| (1) |
where
$\Delta W_{\text{in}}^{\text{element}}$ is the elemental solution of the variation quantity of inelastic strain energies, and
Velement is the cubic volume per element. A FEM model was created for each the crack length reached a predetermined size to calculate Δ
Win, and from the relationship between fatigue crack propagation rate and Δ
Win, a fatigue crack propagation law of Paris type was derived.
13) The FEM models was 1/2 symmetric with a notch introduced as in
Fig. 3. The element type was quadrilateral eight-node plane stress element. The solver used was general purpose code ANSYS ver. 17.2. The area for performing the calculation of Δ
Win had four sides with 20 µm/side with the crack tip at the center. And in the area, tetragonal meshes with 2 µm × 2 µm were provided. The material property of sintered Ag nanoparticles to be used for FEM analysis was defined as elasto-plastic body. For the plastic constitutive equation, the nonlinear kinematic hardening law (Chaboche model)
14) was used as in
eq. (2).
| \begin{equation}
\dot{x}_{\text{i}} = \frac{2}{3}\sum_{i = 1}^{n}A_{1} \dot{\varepsilon}_{\text{p}} - A_{2}x_{\text{i}}\dot{p}
\end{equation}
| (2) |
where
$\dot{x}_{\text{i}}$ is the back stress rate,
$\dot{\varepsilon }_{\text{p}}$ is the inelastic strain rate,
xi is the back stress,
$\dot{p}$ is cumulative inelastic strain rate, and
A1 and
A2 are the material constants. The material constants for the constitutive equation were determined by inverse analysis on the basis of separately conducted tensile test results so as to reproduce the load-displacement hysteresis loop obtained from individual fatigue crack tests. Representative material constants are shown in
Table 1.

Table 1 Representative material constants of Chaboche model for calculating ΔWin.
Thermal fatigue crack propagation life in the joint structure was predicted by the fatigue crack propagation law gained from the SEN specimen. The specimen was a joint body of SiC and the Cu/CuCr clad that was pressure-sintered with Ag nanoparticles in the same condition as in the fatigue crack propagation testing. A schematic illustration of the joint specimen is shown in Fig. 4. The joint specimen was subjected to thermal cycle testing with the maximum temperature of 448 K and the minimum of 218 K at the temperature ramp rate of 23.0 K/min and with the dwelling time of 15 minutes for each of maximum and minimum temperature. The crack length on the diagonal surface was measured at the number of cycles prescribed by ultrasonic microscope.

The elastic modulus, Poisson’s ratio, and CTE of each material used in FEM analysis are shown in Table 2. The property of Ag nanoparticles was defined as elasto-plastic creep body. For the elasto-plastic constitutive equation, Chaboche model was used and Norton’s law of eq. (3) was used for the creep constitutive equation. Material constants of constitutive equations were determined by the tensile test and stress relaxation test that were conducted separately. Determined material constants for Chaboche model of individual equations are shown in Table 3.
| \begin{equation}
\frac{d\varepsilon}{dt} = 3.5\times 10^{-4}\sigma^{7.1}\exp\left(-\frac{92000}{8.31\cdot T}\right)
\end{equation}
| (3) |
where the units of energy for strain rate, stress and activation energy are s
−1, MPa, and KJ/mol respectively.

Table 2 Elastic material constants of each material of sintered joint specimen.

Table 3 FEM model for calculation of ΔWin.
The microstructure of the specimens were observed by a field emission scanning electron microscope (FE-SEM) following polishing by Ar ion sputter-etching.
3. Results
3.1 Fatigue crack propagation
The microstructure of the SEN specimen after sintering is shown in Fig. 5, where the porous structure specific to sintered Ag nanoparticles was observed. The porosity of the specimen in this study was about 8.3% and an average grain size was 247 nm. It is known that the porosity of sintered Ag nanoparticles is strongly dependent on sintering conditions, according to which the porosity varies from about 10% to 40%.15–18) In pressureless-sintering, numerous pores were observed in the neck area.10,17) In comparison with the porosity in pressureless-sintered body, the porosity in the specimen of this study was lower and there were a few of neck areas that were seen in the process of sintering. The microstructure of the specimen in this study was densified because the sintering was progressing by pressurization.

Figure 6 shows the relationship between fatigue crack length at each test temperature a and the number of cycles N. The relationship between fatigue crack length and the number of cycles became linear at any test temperature. This is because the fatigue crack propagation test in this study was conducted under the displacement controlling mode, in which only small changes took place in the driving forces (ΔWin) to growth the fatigue crack. Thus, the fatigue crack propagation rate was calculated by the linear approximation of the relationship between fatigue crack length a and the number of cycles N.
Figure 7 shows the relationship between fatigue crack propagation rate of pressure-sintered Ag nanoparticles and ΔWin. At any test temperature the fatigue crack propagation law of Paris type holds between fatigue crack propagation rate and ΔWin. Material constants at individual temperatures are shown in Table 4.
| \begin{equation}
\frac{da}{dN} = C_{1}\Delta W_{\text{in}}{}^{C_{2}}
\end{equation}
| (4) |
where
C1 and
C2 are the material constants. The units of Δ
Win and
da/
dN were MJ m
−3 and m respectively. The fatigue crack propagation rate at 298 K was nearly identical to that at 333 K and the gradient of a straight line
C2 was about 1.0. The
C2 of the pressureless-sintered Ag nanoparticles as reported previously
13) was 3–5 at ambient temperature, which means
C2 was decreased by pressure-sintering. Although a direct comparison cannot be made, it is reported that the exponent of Dowling-Begley law, which is the fatigue crack propagation law that uses Δ
J, generally shows 1.0–2.0 in steel alloys and solder alloys.
19–22) The
C2 of the fatigue crack propagation law of pressure-sintered Ag nanoparticles was close to that of ductile metals. In a pressureless-sintered Ag nanoparticles, its microstructure became densified with increasing sintering temperature, and as a consequence, fatigue crack propagation resistance improved and
C2 was decreased
10,13) — this is because the sintering further progressed as the sintering temperature was increased and in conjunction with this, pores and neck areas decreased, which led to decrease in the internal stresses concentration areas. Compared with pressureless-sintered Ag nanoparticles, pressure-sintered Ag nanoparticles had a fewer pores and a fewer neck areas, which made the microstructure more densified. This microstructure induced the property of fatigue crack propagation that was close to ductile metals. On the other hand, the fatigue crack propagation rate at 448 K was higher than at 333 K and
C2 was about 1.7 close to the value of the pressureless-sintered Ag nanoparticles. Although the mechanical properties of the pressureless-sintered Ag nanoparticles become ductile by grain boundary diffusion-type creep with increasing temperature and concurrently the rate of fatigue crack propagation decreases,
13) in the pressure-sintered Ag nanoparticles in this study, the fatigue crack propagation rate increased with an increase in temperature.

Table 4 Material constants of fatigue crack propagation law.
Figure 8 shows the fatigue crack propagation path in representative test conditions of pressure-sintered Ag nanoparticles. At any test temperature, a fatigue crack propagated along a grain boundary (the sintered interface between Ag particles). In crystalline materials with a grain size of several hundred nanometers, deformation and fracture at grain boundary become dominant.23) Because of this, also in pressure-sintered Ag nanoparticles, grain boundary fracture became fatigue crack propagation mechanisms. Pores originally contained in sintered Ag particles become clumped/connected to each other after a long time of high temperature exposure and macroscopic pores grow large which causes for mechanical properties to decrease.18) The testing time in this study was relatively short for about several to several dozens of hours. However, compared to the initial microstructure, the size and the number of pores increased around a crack tip by stress-induced diffusion as well as temperature. Since the increased pores leads a brittle characteristic from the structural point of view, the fatigue crack propagates through a pore at any test condition.

When the microstructure after the testing was observed with a focus on changes in fracture mechanisms at 448 K and other temperatures, differences were seen in the damage near a crack tip. As shown in Fig. 8, a grown up crack was seen at 448 K ahead of the main crack (in the traveling direction of the crack). At lower temperatures, however, other cracks except for the main crack were not observed. Grain boundary diffusion became more active at 448 K than at ambient temperature and the pores easily became connected to one another. Connecting of the pores induces crack initiation and multiple small cracks occur ahead of the main crack. It is considered that by the main crack being connected to small cracks, brittle properties were derived and as a result, the fatigue crack propagation rate increased. Thus, C2 and the fatigue crack propagation rate increased at 448 K.
3.2 Prediction of fatigue crack propagation of sintered joint specimen
The inelastic strain energy density range of the crack tip calculated by FEM is dependent on the size of the area surrounding a crack and dependent on the size of an element in the area, unlike the case in which the path independent J was used. In considering the application of the foregoing to fatigue crack propagation analysis in real joint structures, the dependence of the area surrounding a crack and the dependence of the element size in the area need to be clarified. Therefore, these types of dependence having effects on Win were investigated by altering the size of the region to obtain inelastic strain energy Win and the size of the divided element. The FEM models was 1/2 symmetric with a notch introduced as in Fig. 3. Figure 9 shows the relationship between the side length of quadrate Larea to obtain Win, the element size in the square region Lelement and Win. As shown in Fig. 9, the gradient of the straight line was −1 and Win is inversely proportional to Larea. Furthermore, even if an alteration is made to Lelement, the effect of the element size is almost negligible because Win is calculated as an average in the quadrate region.

If Larea is replaced with the distance from the crack tip, the relationship between Larea and Win obeys HRR singularity.24,25) In the HRR singularity field, stress and strain can be found as in eq. (5) and eq. (6).
| \begin{equation}
\sigma_{ij} = k_{1}\left(\frac{J}{r}\right)^{\frac{1}{n + 1}}{} \cdot \tilde{\sigma}_{ij}(\theta)
\end{equation}
| (5) |
| \begin{equation}
\varepsilon_{ij} = k_{2}\left(\frac{J}{r}\right)^{\frac{n}{n+1}} {}\cdot \tilde{\varepsilon}_{ij}(\theta)
\end{equation}
| (6) |
where
J is the
J-integral,
n is the strain hardening exponent,
r is the distance from the crack tip, and
k1 and
k2 are the material constants. And σ(θ) and ε(θ) are the constants relating to the angle θ of the polar coordinate with the crack tip and to material. The stress and strain at the crack tip have the relationship of −1/(
n + 1) and −
n/(
n + 1) squared for the distance from the crack tip
r and they depend on the strain hardening exponent of the material. It has been mathematically analyzed, however, that in the HRR singularity field, the strain energy density gained from the integration of stress by strain is proportional to 1/
r.
24) The
Win calculated in this study is an average of the sum of the elemental solutions of strain energy densities obtained from all the elements in the square area surrounding the crack tip. When a sufficiently large plastic deformation is loaded, strain energy density
W becomes equivalent to the
Win. Therefore, as long as the acquisition area of
Win is in the HRR singularity field, the following inverse relationship holds between
Win and the length of one side of the acquisition area.
| \begin{equation}
W_{\text{in}} = \frac{W_{\text{in-c}}}{L_{\text{area}}}
\end{equation}
| (7) |
where
Win-c is the proportional constant. The result in
Fig. 9 indicates the relationship of
eq. (7). The inverse relationship holds regardless of the types of materials since it is not dependent on the material constant of the elasto-plastic constitutive equation. The author
et al. have conducted similar research of pressureless-sintered Ag nanoparticles and confirmed the inverse relationship.
13) Win-c is determined by calculating a given
Larea. However,
Win-c, which was not dependent on
Larea, becomes to have the quality similar to the path-independent of
J-integral. And in a sense of physics,
Win-c was close to the
J-integral that linear-integrated the strain energy density on the path, since it was the result of multiplying the average of the strain energy density in the acquisition area by the length of the acquisition area. Using this
Win-c enables fatigue crack propagation assessments that are not dependent on
Larea and
Lelement. Therefore, in this study, the fatigue crack propagation law of Paris type was derived with the use of Δ
Win-c and fatigue crack propagation in a joint structure was predicted. Fatigue crack propagation law that uses Δ
Win-c is shown in
eq. (8).
| \begin{equation}
\frac{da}{dN} = C_{3}\Delta W_{\text{in-c}}{}^{C_{2}}
\end{equation}
| (8) |
where
C3 is the material constant, which were determined from the experimental results shown in
Fig. 7. The material constants for the fatigue crack propagation law with Δ
Win-c are shown in
Table 5. The units of Δ
Win-c and
da/
dN were N m
−1 and m respectively.

Table 5 Material constants for fatigue crack propagation law using ΔWin-c.
The ΔWin-c in the sintered joint during temperature cycling was calculated with a two-dimensional FEM model having the reproduced diagonal cross section of the specimen as shown in Fig. 10. The element type was eight-node axisymmetric element. A FEM model was created for each predetermined crack length. Contact elements were set to the fatigue crack surfaces and the fatigue crack propagation path was determined based on the observations made after the thermal cycle test. A SAT (Scanning Acoustic Tomograph) image of and a SEM image of a cross section observed after testing are shown in Fig. 11. The fatigue crack started to develop from the joint interface at the corner on the chip side and propagated near the joint interface adjacent to the clad material. In the FEM, an initial crack of 20 µm was created and the fatigue crack propagation path was set to the joint interface on the side of the clad material. Assuming that the driving force for fatigue crack propagation is dominated by the energy on the side of the sintered layer, ΔWin was calculated in the area of 10 µm × 20 µm on the side of Ag nanoparticles near a fatigue crack. Assuming in-phase type thermal fatigue, the reference temperature was set to be 298 K. The life of thermal fatigue crack propagation of the joint specimen was calculated by the use of eq. (9) as below.
| \begin{equation}
N = \int_{a_{0}}^{a_{\text{f}}}\frac{da}{C_{3}\Delta W_{\text{in-c}}(a)^{C_{2}}}
\end{equation}
| (9) |
where Δ
Win-c (
a) is the proportional constant of
eq. (7) as a function of fatigue crack length,
a0 is the initial crack length, and
af is the critical fatigue crack length. Thermal cycle testing with three cycles was analyzed and Δ
Win was calculated between the second cycle and the third cycle and then Δ
Win-c was found by
eq. (7). In this study, the elasto-plastic creep constitutive equation was used for FEM analysis of the temperature cycling. Since HRR singularity field appeared in the creep singularity field expressed by
C*-integral,
26–28) eq. (7) held. Δ
Win-c was calculated for each predetermined length and a function of Δ
Win-c and fatigue crack length was obtained. Then the function was input into the
eq. (9) to obtain the number of cycles taken to reach the individually prescribed crack lengths. For the material constants of
eq. (9) to be used for the calculation of fatigue crack propagation life, the fatigue crack propagation law obtained at the test temperature 448 K were used on the assumption that fracture advances on the side of high temperature.
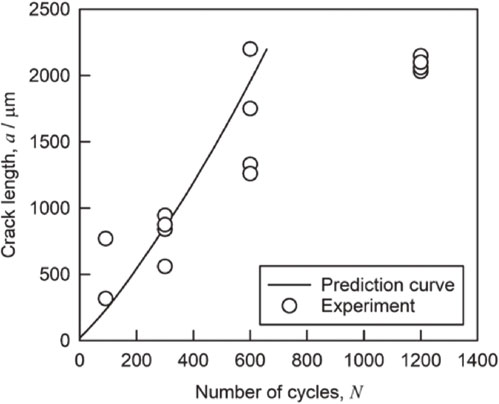
Figure 12 shows the relationship between crack length and ΔWin-c obtained from the FEM analysis of the thermal cycle test. ΔWin-c increased as crack length increased, which relationship can be approximated by a quadratic polynomial. By inputting this relational expression in eq. (9), the number of fatigue cycles were obtained at the point where the crack length grew from the initial length to 2.2 mm.

Figure 13 shows a comparison between the calculated number of cycles to thermal fatigue crack propagation and results of thermal cycle test. White circles are the test results and the curved line is the calculated value. The prediction results of fatigue crack propagation by the method of the study are roughly consistent with the fatigue crack propagation in the thermal cycle test. However, according to the prediction results, the fatigue crack propagation rate increased with an increase in fatigue crack length, whereas the test results showed that the fatigue crack propagation rate decreased with an increase in fatigue crack length. This may have occurred due to a possible reason that the axisymmetrical model used in the FEM analysis did not precisely reproduce the joint specimen. In the two-dimensional model with axisymmetrical elements, the length of crack front decreases with increasing fatigue crack propagation. Therefore, the load to be subjected to per unit length of the crack front become larger along with crack propagation, resulting in an increase in the fatigue crack propagation rate. On the other hands, the actual structure of the joint body was quadrate. In the case, the crack initiated at the joint corner propagated and the crack length increased along with the advancement of crack propagation. Therefore, the load per unit length of the crack front decreased with a decrease in the fatigue crack propagation rate. It is considered that more precise crack propagation behavior can be reproduced with the use of a three-dimensional FEM model.