Abstract
The purpose of the present study is to investigate the melting properties, microstructures, tensile properties and fatigue properties of Sn–5Sb–(0.05–0.50)Ni (mass%) high-temperature lead-free solders. The solidus temperature and liquidus temperature of the Sn–5Sb–Ni solders are approximately equal to those of the Sn–5Sb alloy. From the result of EPMA mapping analysis and the Sn–Sb–Ni ternary phase diagram, the Sn–5Sb–Ni solders are found to consist of β-Sn, SbSn and NiSb phases. As the amount of Ni in the Sn–5Sb–Ni solder increases, the number of NiSb phases increases and the phases are coarsened so that the 0.1% proof stress and tensile strength increase, and the elongation decreases at 25°C. In contrast, the effects of the Ni content on the tensile properties are negligible at 150°C and 200°C. The fatigue ductility exponent α of the Sn–5Sb–Ni solders is smaller than that of the Sn–5Sb solder at 25°C. At 150°C and 200°C, the α values of Sn–5Sb–0.05Ni and Sn–5Sb–0.10Ni remain small, whereas those of Sn–5Sb–0.25Ni and Sn–5Sb–0.50Ni increase. This means that the Sn–5Sb–Ni solders with 0.05–0.10 mass% Ni have superior fatigue properties to the Sn–5Sb solder in the temperature range from 25°C to 200°C.
1. Introduction
To protect the environment and human health, the EU-RoHS directive prohibited the use of Pb in electronic products, and thus lead-free soldering become widespread worldwide.1–5) However, the use of high-temperature Pb-rich solders (over 85 mass% Pb) in products requiring high heat durability and reliability was not prohibited in the EU-RoHS directive.6,7) Although lead-free high temperature solder materials have not yet been designated by the RoHS directive, the research and development of such solders is desirable. In general, a high-temperature solder is applied as a die-attachment material for a power semiconductor chip in a power module. For the solder alloy used in this product, a combination of high heat durability, good tensile properties and high fatigue resistance is required.8,9)
Sn–Sb alloys, which are lead-free high-temperature solders, are possible alternatives to Pb-rich solders. It has been reported that Sn–5Sb (mass%) has good electric resistivity, high fracture strength and excellent fatigue resistance.9,10)
It has also been reported that the addition of microelements has the potential to enhance the mechanical properties of Sn-based solders. Many researchers have studied the effects of Au, Ag or Cu in Sn–Sb solder on various properties.10–14) It was reported that Sn–Sb–Au solder has superior creep properties,11) whereas Sn–Sb–Ag and Sn–Sb–Cu solders have superior tensile properties to Sn–Sb solder.12) However, it was also reported that the addition of Au, Ag or Cu to Sn–Sb solder reduces the solidus and liquidus temperatures.11,12) This means that it is difficult for these solders to be applied as a die-attachment material for power semiconductor chips. Therefore, we focused on Ni addition to further improve the mechanical properties of the Sn–Sb solder without decreasing the melting temperature. We revealed that the addition of Ni to the Sn–Sb solder did not reduce the melting temperature by thermodynamic calculation analysis. In addition, other researchers have reported that the addition of Ni can increase the joint strength of Sn–Ag solder15) and improve the low-cycle fatigue properties of Sn–Ag–Cu solder.16,17) Therefore, it is assumed that the addition of Ni to Sn–Sb solder also enhances these properties without decreasing the solidus and liquidus temperatures. However, almost no studies have been reported on Sn–Sb solder containing a small amount of Ni.
In the present study, the effects of the Ni content on the melting properties, microstructures, tensile properties and fatigue properties of Sn–5Sb–xNi (x = 0.05, 0.10, 0.25, 0.50) (mass%) solders were investigated.
2. Experimental Procedure
2.1 Materials
Table 1 shows the alloy systems and chemical compositions of the solders used in the present study. Sn–5Sb solder was also investigated for comparison with the Sn–5Sb–Ni solders. Ingots of the solders listed in Table 1 were prepared. A solder wire with 1.2 mm diameter was fabricated by drawing each ingot.
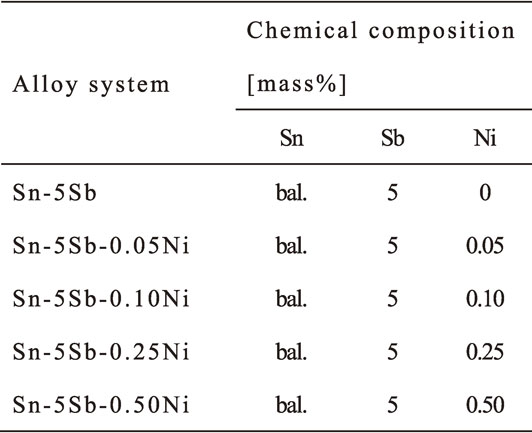
Table 1 Alloy systems and chemical compositions of solder used in present study.
Solidus and liquidus temperatures of the solders were measured based on Japanese Industrial Standards (JIS) Z 3198. These temperatures of the solders were investigated by differential scanning calorimetry (DSC), where the mass of the solder wire was adjusted to approximately 10 mg and the heating rates were 0.5, 1, 2, 5 and 10°C/min in the temperature range from 100°C to 300°C.
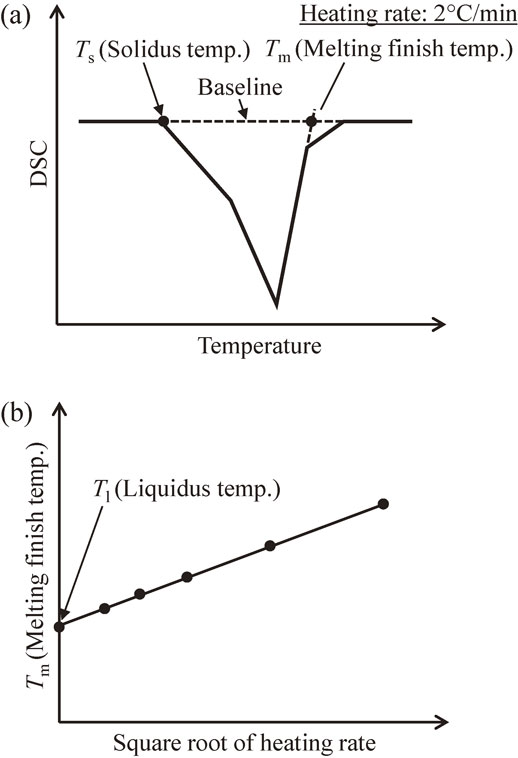
Figure 1 shows the method used to determine the solidus and liquidus temperatures. The solidus temperature was determined from the point where the DSC curve at a heating rate of 2°C/min starts to move away from the baseline on the low-temperature side, as shown in Fig. 1(a).
To determine the liquidus temperature, the melting finish temperature was first obtained from the intersection point between the baseline on the high-temperature side and the maximum gradient of the curve on the high-temperature side of the melting peak, as shown in Fig. 1(a). Then, the relationship between the melting finish temperature and the square root of the heating rate (0.5–10°C/min) was plotted and the extrapolation line was drawn, as shown in Fig. 1(b). Then, liquidus temperature was determined from the point where the extrapolation line intersects the y-axis in Fig. 1(b).
2.3 Specimen preparation
As-cast miniature size specimens of 2.0 mm gage length and 0.50 mm diameter were produced from solder wires by casting. A divided metal mold made of 2219 aluminum alloy was prepared. The casting temperature and cooling rate were measured with a thermocouple placed on the metal mold. The casting was conducted at 254°C for all solders. The maximum cooling rate in the casting was 3.5°C/s. In this study, the miniature size specimens were used for microstructural observation, tensile test and low-cycle fatigue test.
2.4 Microstructural observation
As-cast specimens were embedded in epoxy resin, and cross sections of the specimens were polished by a polishing machine using #300–#4000 abrasive papers and a 1 µm Al2O3 powder suspension. Then, the microstructural observations of the cross sections of the specimens were conducted by an electron probe X-ray microanalyzer (EPMA). Moreover, the crystal orientations of the specimens were analyzed using an electron backscatter diffraction (EBSD) system. The longitudinal direction of each specimen was set to the rolling direction (RD) in the material coordinate system used in the EBSD.
2.5 Tensile tests
Tensile tests were conducted with a microload test system (Saginomiya Seisakusho LMH207-10). The tests were conducted at a strain rate of 2 × 10⁻³ s−1 at 25°C, 150°C and 200°C. Five specimens were examined under each condition. After each test, the appearance and fracture surface of each specimen were observed by the EPMA.
2.6 Low-cycle fatigue tests
Low-cycle fatigue tests were also conducted with the microload test system. The tests were conducted at a strain rate of 2 × 10⁻³ s−1 at 25°C, 150°C and 200°C. In each test, the strain was controlled using a symmetrical triangle wave and the total strain range Δεt was in the range of 0.4% to 2.0%. The fatigue life was defined as the number of cycles in which the maximum load applied to the specimen was reduced by 20%. After the tests, the microstructural observations of the cross sections of the specimens were conducted using a laser microscope.
3. Results and Discussion
3.1 Melting properties
Table 2 shows the obtained solidus and liquidus temperatures of the Sn–5Sb, Sn–5Sb–0.05Ni and Sn–5Sb–0.50Ni solders. There is only an error of about 1°C between the obtained these temperatures of the Sn–5Sb solder and the standard values of JIS Z 3282. These temperatures of the Sn–5Sb–Ni solders were approximately equal to those of the Sn–5Sb solder. Thus, it was found that the melting properties of the Sn–5Sb–xNi solders (x = 0.05–0.50 mass%) were stable upon the variation in Ni content.
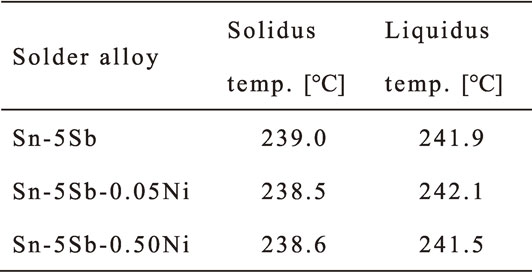
Table 2 Melting properties of investigated solder.
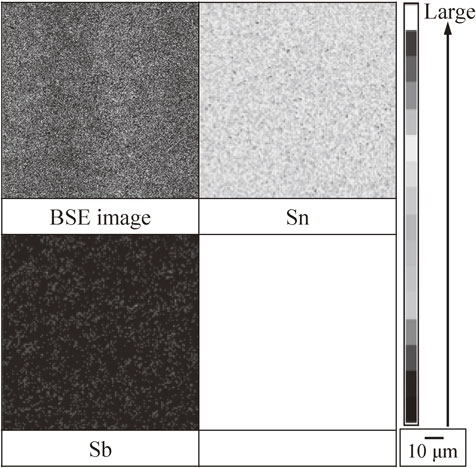
Figure 2 shows a backscattered electron (BSE) image of an as-cast miniature size Sn–5Sb specimen and the corresponding EPMA composition maps of Sn–5Sb. A gray-bar next to the images shows the strength of characteristic X-ray detected at the EPMA. In the BSE image, dark-gray and bright-gray phases with sub-micrometer sizes were observed.
Figure 3 shows the Sn–Sb binary phase diagram drawn on the basis of the results of thermodynamic calculation (Thermo-Calc 2017a, Thermo-Calc Software Inc.). From the phase diagram, Sn–5Sb consists of β-Sn and SbSn phases.
From the EPMA composition maps and phase diagram, the dark-gray and the bright-gray phases in the BSE image were inferred to be the β-Sn and SbSn phases, respectively.18)
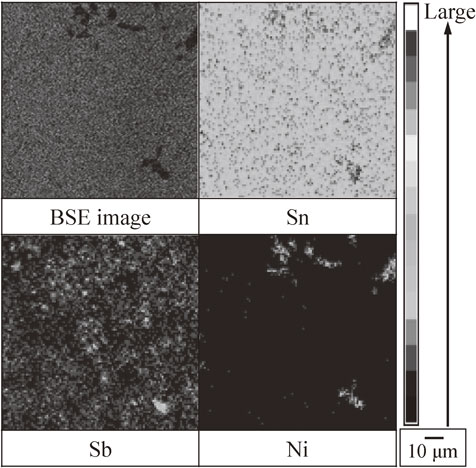
Figure 4 shows a BSE image of an as-cast miniature size Sn–5Sb–0.50Ni specimen and the corresponding EPMA composition maps results. In the BSE image of Sn–5Sb–Ni, dark-gray and bright-gray phases with sub-micrometer sizes and black phases with micrometer sizes were observed.
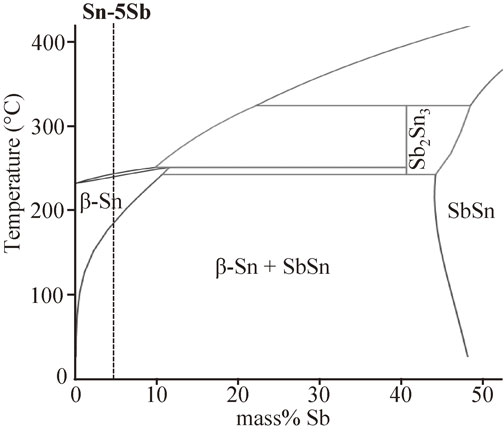
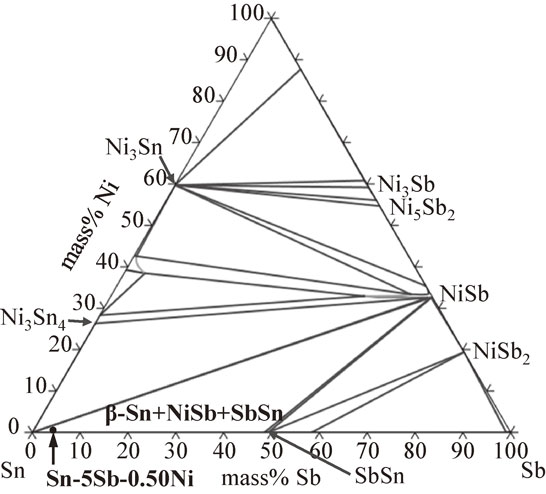
Figure 5 shows the Sn–Sb–Ni ternary phase diagram drawn on the basis of the results of thermodynamic calculation. The composition point of Sn–5Sn–0.5Ni is also plotted in the diagram. From the phase diagram, Sn–5Sb–xNi (x = 0.05–0.50 mass%) consists of β-Sn, SbSn and NiSb phases.
From the EPMA composition maps and phase diagram, the dark-gray, bright-gray and black phases were inferred to be the β-Sn, SbSn and NiSb phases, respectively.
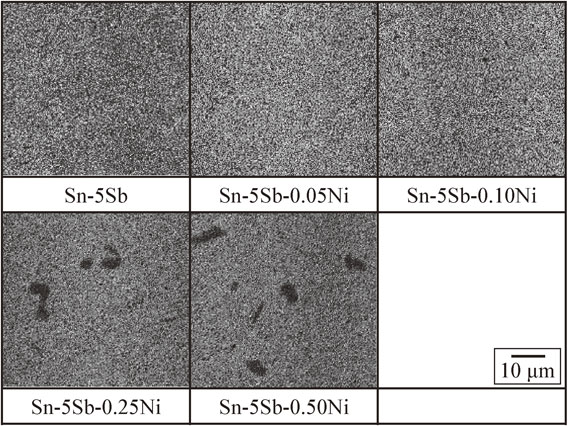
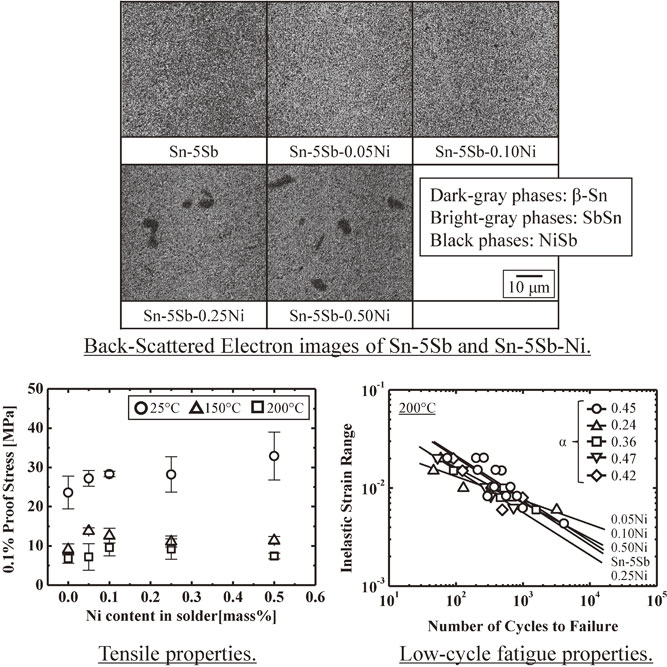
Figure 6 shows the BSE images of the as-cast miniature size specimens of Sn–5Sb and Sn–5Sb–Ni. According to the images, as the amount of Ni in the solder increases, the number of NiSb phases increases and the phases are coarsened.
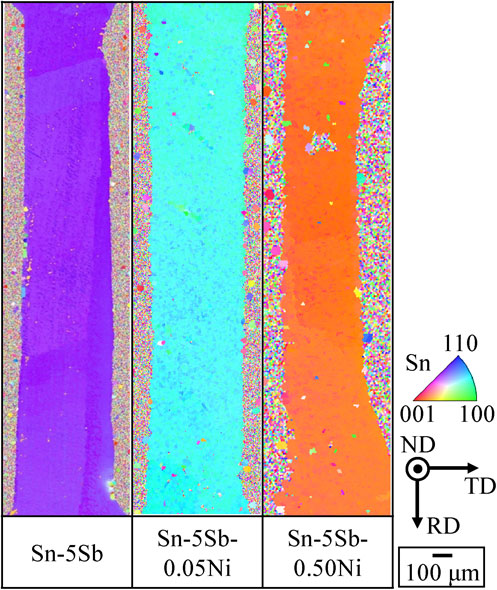
Figure 7 shows the results of EBSD analysis of the cross sections of the miniature size specimens of Sn–5Sb and Sn–5Sb–Ni. From their inverse pole figure (IPF) maps, it was found that these specimens consist of a single grain.
3.3 Tensile properties
Figure 8 shows the effects of the Ni content on the tensile properties of Sn–5Sb and Sn–5Sb–Ni solders at 25°C, 150°C and 200°C. At 25°C, as the amount of Ni in the Sn–5Sb–Ni solder increases, the 0.1% proof stress and tensile strength increase, and the elongation decreases. It appears that dispersion strengthening by the NiSb phases, which do not form in Sn–5Sb solder, occurs in the Sn–5Sb–Ni solders. In contrast, the effects of the Ni content on the tensile properties was negligible at 150°C and 200°C. According to the effects of the temperature on the tensile properties, a higher temperature results in lower 0.1% proof stress and tensile strength, but has a negligible on the elongation.
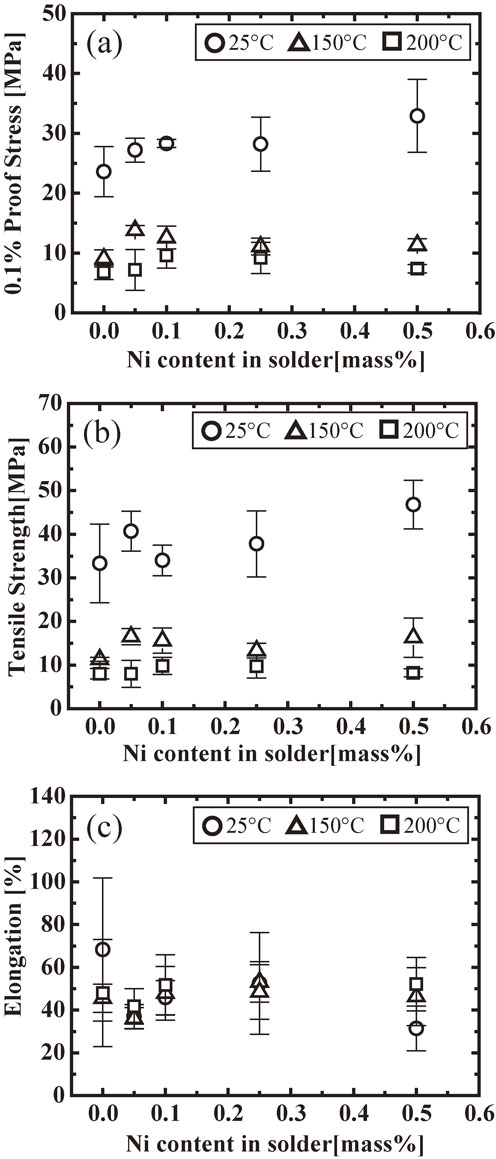
Figure 9 shows the volume fractions of the β-Sn, SbSn and NiSb phases in the Sn–5Sb and Sn–5Sb–Ni solders obtained by thermodynamic calculation. As shown in the figure, the SbSn phases decompose at high temperatures; the ratio of the SbSn phases decreases and that of the β-Sn phases increases when the temperature is increased to 150°C and 200°C. Therefore, the β-Sn phases have a large influence on the tensile properties at high temperature.
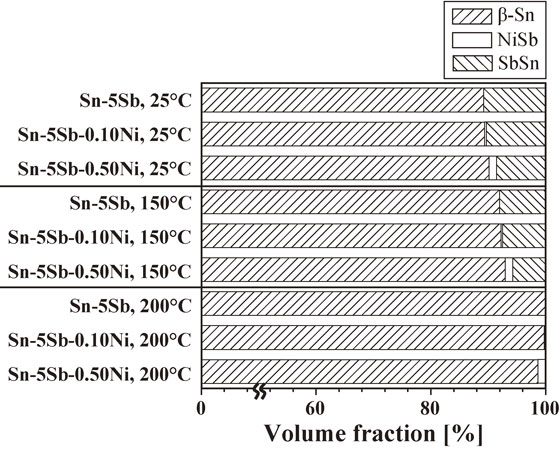
Figure 10 shows the secondary electron (SE) images of the Sn–5Sb, Sn–5Sb–0.10Ni and Sn–5Sb–0.50Ni fractured specimens. In Sn–5Sb and Sn–5Sb–0.10Ni, chisel-point fracture was observed regardless of the test temperature, and the tip of the fractured region was a straight line. Sn–5Sb–0.05Ni also had a similar fracture surface. It has been reported that a miniature size specimen consists of a single grain or a few grains, and thus the tensile properties highly depend on the crystal orientation of the grains.19) Owing to the limit of the slip systems of β-Sn, which has a body-centered tetragonal crystal structure,20) the fractured region is not deformed uniformly, and thus the fracture surface is reduced in a straight line. Because the Sn–5Sb and Sn–5Sb–Ni specimens in the present study consist of a single grain, this phenomenon appears to occur. In the Sn–5Sb–0.50Ni specimens, chisel-point fracture was also observed regardless of the test temperature. However, dimples were formed at the tip of the break region at 25°C. Sn–5Sb–0.25Ni also had a similar fracture surface.
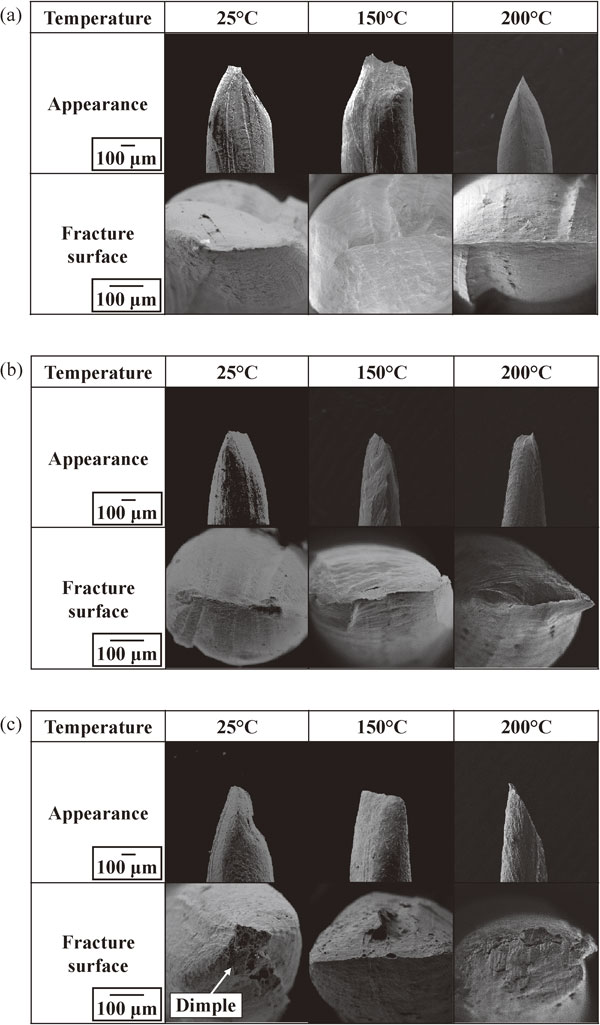
Figure 11 shows an SE image of the fractured surface of a Sn–5Sb–0.25Ni specimen after the tensile test and the corresponding EPMA maps results. In the SE image, particles were observed on the fracture surface. From the EPMA maps results, the particles were inferred to be SbSn and NiSb phases. Thus, the SbSn and NiSb phases were separated from the β-Sn phases during tensile deformation, and microvoids were formed around the SbSn and NiSb phases. Subsequently, the voids grew and combined together, and dimples were formed on the fracture surface. In particular, when there was a large amount of Ni (at least 0.25 mass%) in the Sn–5Sb–Ni solder, dimples easily formed on the fracture surface. On the other hand, the tip of the fractured region was a straight line regardless of the amount of Ni in the Sn–5Sb–Ni solders at 150°C and 200°C. As shown in Fig. 9, the ratio of the SbSn phase decreases and that of the β-Sn phase increases with increasing temperature. Therefore, hardly any dimples are formed on the fracture surface.

In general, the low-cycle fatigue life of a metal obeys the Manson–Coffin equation as follows:21,22)
| \begin{equation}
C = \Delta\varepsilon_{\text{in}}\cdot N_{\text{f}}{}^{\alpha}
\end{equation}
| (1) |
where
C is the fatigue ductility factor, Δε
in is the inelastic strain range,
Nf is the low-cycle fatigue life and α is the fatigue ductility exponent. A plot of the logarithm of Δε
in versus the logarithm of
C yields a straight line with slope α. A low α is necessary to obtain excellent fatigue resistance.
Figure 12 shows the results of the low-cycle fatigue tests at each temperature for specimens of the Sn–5Sb and Sn–5Sb–Ni solders. From the figures, it was confirmed that the low-cycle fatigue lives of these solders obey the Manson–Coffin equation. The α of the Sn–5Sb solder, α was 0.45 regardless of the temperature. The α of the Sn–5Sb–Ni solder was smaller than that of the Sn–5Sb solder at 25°C. At 150°C and 200°C, the α values of the Sn–5Sb–0.05Ni and Sn–5Sb–0.10Ni solders remained small (under 0.45), whereas those of the Sn–5Sb–0.25Ni and Sn–5Sb–0.50Ni solders increased. This means that the Sn–5Sb–Ni solders with 0.05–0.10 mass% Ni have superior fatigue properties to the Sn–5Sb solder in the temperature range from 25°C to 200°C.
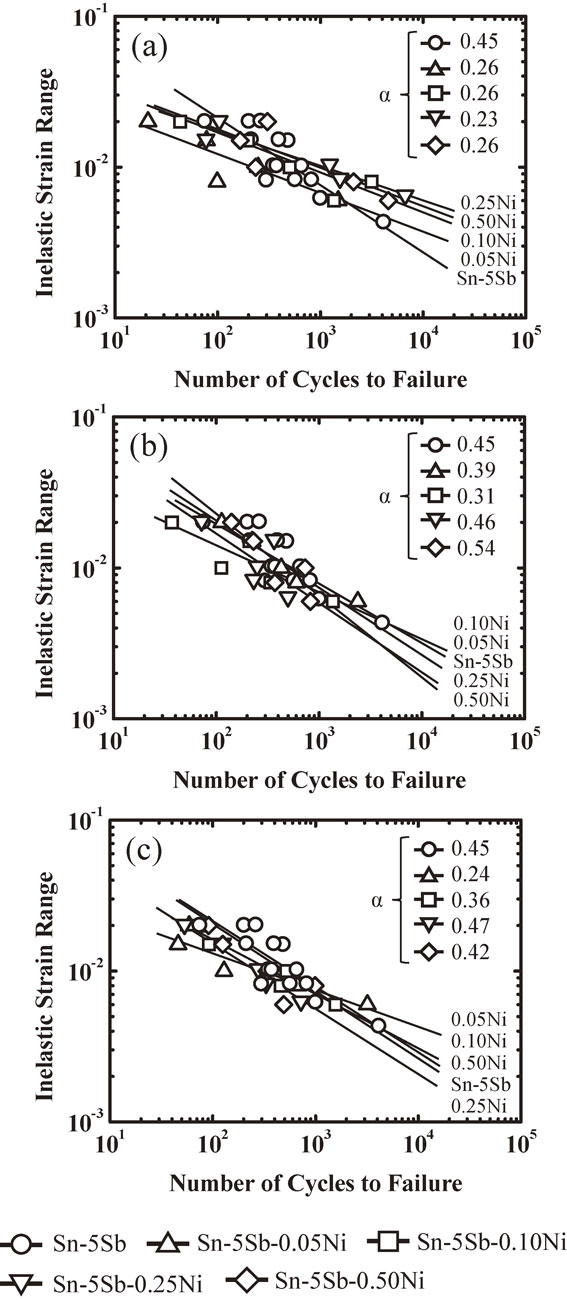
Figure 13 shows the SE images and IPF maps of the cross sections of the Sn–5Sb–0.50Ni miniature size specimens after the low-cycle fatigue test. The results indicated that fine crystal grains were formed in the cracks at 200°C. It means that crack progress caused by the continuous dynamic recrystallization. To clarify differences in the crystal grain sizes between 25°C and 200°C, microstructures of miniature size specimens were observed.

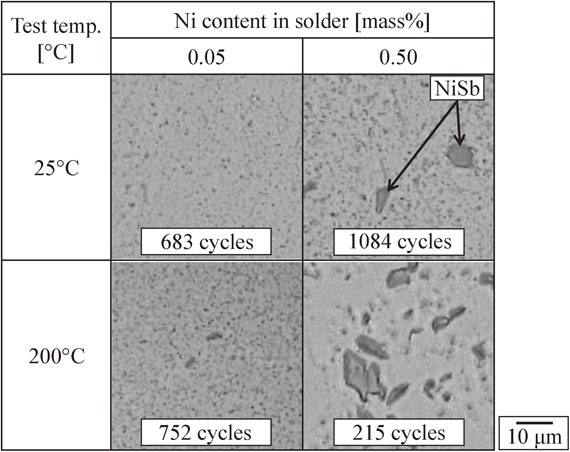
Figure 14 shows the optical microscopy images of the microstructures of the Sn–5Sb–0.05Ni and Sn–5Sb–0.50Ni specimens after the low-cycle fatigue test. The cycle numbers shown in the figure indicate the number of cycles of the fatigue test. As shown in the figure, when the content of Ni in the Sn–Sb–Ni solders is small (0.05–0.10 mass%), fine NiSb phases exist in the solder regardless of the temperature. Therefore, excellent fatigue properties can be obtained because dynamic recrystallization is suppressed by the dislocation pinning effect. When the content of Ni in the Sn–Sb–Ni solders is large (0.25–0.50 mass%), fine NiSb phases exist at room temperature, and hence excellent fatigue properties are obtained. At high temperatures, the NiSb phases are coarsened. This weakens the dislocation pinning effect and dynamic recrystallization easily occurs. Consequently, the crack progresses in the β-Sn grain boundary formed by dynamic recrystallization, which appears to cause the deterioration of fatigue properties.
4. Conclusion
In this study, the effects of the Ni content on the melting properties, microstructure, tensile properties and fatigue properties of Sn–5Sb–Ni solders were investigated. The results are summarized as follows.
-
(1)
The solidus and liquidus temperatures of Sn–5Sb–xNi (x = 0.05–0.50 mass%) solders were approximately equal to those of the Sn–5Sb solder.
-
(2)
The Sn–5Sb–Ni solder with a small amount of Ni consists of β-Sn, SbSn and NiSb phases. As the amount of Ni in the Sn–5Sb–Ni solder increases, the number of NiSb phases increases and the phases are coarsened.
-
(3)
As the amount of Ni in the Sn–5Sb–Ni solder increases, the 0.1% proof stress and tensile strength increase and the elongation decreases at 25°C. In contrast, the effects of the Ni content on the tensile properties are negligible at 150°C and 200°C.
-
(4)
In the Sn–5Sb–Ni solders, chisel-point fracture was observed regardless of the conditions of the tensile test.
-
(5)
The fatigue ductility exponent α of the Sn–5Sb–Ni solders is smaller than that of the Sn–5Sb solder at 25°C. At 150°C and 200°C, the α of Sn–5Sb–Ni with 0.05–0.10 mass% Ni remains small, whereas that of Sn–5Sb–Ni with 0.25–0.50 mass% increases.
-
(6)
When the Ni content of the Sn–Sb–Ni is small, fine NiSb phases exist in the solder regardless of the temperature. Therefore, excellent fatigue properties can be obtained because dynamic recrystallization is suppressed by the dislocation pinning effect.
-
(7)
When the Ni content in the Sn–Sb–Ni is large, the NiSb phases are coarsened at high temperatures. Owing to the formation of coarsened NiSb phases, the dislocation pinning effect is weakened and dynamic recrystallization easily occurs. Consequently, the crack progresses at the β-Sn grain boundary formed by dynamic recrystallization, which appears to cause the deterioration of fatigue properties.
REFERENCES
- 1) S. Ahat, M. Sheng and L. Luo: J. Electron. Mater. 30 (2001) 1317–1322.
- 2) J.H.L. Pang, T.H. Low, B.S. Xiong, X. Luhua and C.C. Neo: Thin Solid Films 462–463 (2004) 370–375.
- 3) H.T. Lee and Y.H. Lee: Mater. Sci. Eng. A 419 (2006) 172–180.
- 4) C. Lee, C.Y. Lin and Y.W. Yen: Intermetallics 15 (2007) 1027–1037.
- 5) J. Keller, D. Baither, U. Wilke and G. Schmitz: Acta Mater. 59 (2011) 2731–2741.
- 6) V. Chidambaram, J. Hattel and J. Hald: Microelectron. Eng. 88 (2011) 981–989.
- 7) S. Menon, E. George, M. Osterman and M. Pecht: J. Mater. Sci. Mater. Electron. 26 (2015) 4021–4030.
- 8) K. Suganuma, S.J. Kim and K.S. Kim: JOM 61 (2009) 64–71.
- 9) K. Kobayashi, I. Shohji and H. Hokazono: Mater. Sci. Forum 879 (2016) 2377–2382.
- 10) J.H. Kim, S.W. Jeong and H.M. Lee: Mater. Trans. 43 (2002) 1873–1878.
- 11) A.A. El-Daly, Y. Swilem and A.E. Hammd: J. Alloys Compd. 471 (2009) 98–104.
- 12) A.A. El-Daly, A. Fawzy, A.E. Mohamad and A.M. El-Taher: J. Alloys Compd. 509 (2011) 4574–4582.
- 13) P. Šebo, P. Švec, D. Janičkovič, E. Illejivá and Yu. Plevachuk: Mater. Sci. Eng. A 528 (2011) 5955–5960.
- 14) Q. Zeng, J. Guo, X. Gu, X. Zhao and X. Liu: J. Mater. Sci. Technol. 26 (2010) 156–162.
- 15) H.T. Lee and Y.H. Lee: Mater. Sci. Eng. A 419 (2006) 172–180.
- 16) S. Terashima, Y. Kariya and M. Tanaka: Mater. Trans. 45 (2004) 673–680.
- 17) Y. Kariya, T. Hosoi, T. Kimura, S. Terashima and M. Tanaka: Mater. Trans. 45 (2004) 689–694.
- 18) T. Kobayashi, K. Kobayashi, K. Mitsui and I. Shohji: Adv. Mater. Sci. Eng. 2018 (2018) 1416942.
- 19) Y. Kariya, T. Niimi, T. Suga and M. Otsuka: Mater. Trans. 46 (2005) 2309–2315.
- 20) A.U. Telang and T.R. Bieler: JOM 57 (6) (2005) 44–49.
- 21) C. Kanchanomai, Y. Miyashita and Y. Mutoh: J. Electron. Mater. 31 (2002) 456–465.
- 22) C.C. Lee and K.C. Chang: Solder. Surf. Mt. Technol. 21 (2009) 31–41.