Center Segregation and Cross-Hatched Surface Pattern of Vertical-Type High-Speed Twin-Roll Cast Al–Si–Mg Alloy Strip Formed by Wide Rolls
2019 Volume 60 Issue 8 Pages 1643-1650
Details
2019 Volume 60 Issue 8 Pages 1643-1650
Al–7%Si–0.4%Mg alloy was cast using a vertical-type high-speed twin-roll caster equipped with commercial scale large rolls. The cast strip had a distinct cross-hatched surface pattern on both sides, with matte and glossy regions periodically distributed throughout the surface. Surface characterization revealed that the difference in appearance making up the pattern was correlated with the difference in surface profile, roughness, and microstructure of the outermost surface. In addition, the pattern was in harmony with the discontinuous distribution of the center segregation band. An interrupted casting confirmed that the cross-hatched surface patterns started forming at the site where solidified shells contacted with each other and strip was deformed by the roll separating force. Therefore, a mechanism is proposed to explain that the squeezing of liquid from mushy layer in a cyclic manner forms the cross-hatched pattern, which corresponds to the periodic distribution of eutectic-rich and α-Al-rich regions in the mid-thickness of the strip.
Against the background of global warming, the automotive industry has been tasked with improving fuel efficiency while simultaneously reducing carbon-dioxide emissions from their production process. To enhance fuel efficiency, the use of wrought aluminum alloys for weight reduction has been expanded. However, the amount of carbon-dioxide emitted during aluminum production is much greater than that emitted during steel production.1) In particular, the use of wrought alloys made from virgin aluminum, the smelting of which consumes a huge amount of electricity, dramatically increases environmental loads. Furthermore, the aluminum sheet production process starting from DC casting consumes a large amount of energy through extensive thermomechanical processing, which includes homogenization, hot rolling, cold rolling, and annealing. To reduce car weight while minimizing environmental impacts, aluminum recycling should be promoted and sheet production processes should be streamlined.
Vertical-type high-speed twin-roll casting2) is a possible solution to the aforementioned problems. Because this technique produces thin strips directly from the melt, the homogenization and hot rolling processes can be omitted. In addition, because the very high cooling rate in vertical-type high-speed twin-roll casting refines impurities and reduces their harmful effects, recycled materials or cast alloys are expected to be used as sheet materials.2–5)
Aluminum sheets for automotive body parts require not only good mechanical properties but also a sound surface with adequate corrosion resistance, adhesion properties, and paintability. However, the quality of twin-roll cast strips has been limited by characteristic defects such as ripple marks, surface bleeds and center segregations.6–9) Moreover, although the strip size must be increased for commercialization, the scope of previous research2–4,9–11) has been limited to lab-scale strips with a width of 100 mm. Consequently, the variation of surface characteristics or internal defects in large strips is still not understood.
Hence, in the present study, an Al–Si–Mg cast alloy strip was produced with a vertical-type high-speed twin-roll caster equipped with commercial scale wide rolls. The cast strip had a distinct cross-hatched periodic surface pattern, which was not reported in previous research involving lab-scale casters. Therefore, the purpose of the present work is to reveal the surface characteristics and solidified structure of the cross-hatched pattern, and to elucidate its formation mechanism.
A schematic of the vertical-type high-speed twin-roll caster used in the present work is shown in Fig. 1. The original mechanics of the caster2) were kept unchanged, and the roll size was expanded to 600 mm in both width and diameter. The rolls were composed of the steel wheels and 50-mm-thick copper alloy cylinders fitted to the wheels. These rolls had no internal cooling circuit. The nozzles were made by pasting 3-mm-thick refractory ceramic fiber (IBIWOOL-E paper, IBIDEN Co., Ltd.) to the 4-mm-thick steel plates. A boron nitride spray coating was applied to the nozzle surface as a release agent. For the experimental material, Al–7%Si–0.4%Mg alloy was used. After the alloy was melted at 1023 K, Ar degassing was conducted for 10 min. The degassed melt was fed into the caster using a ladle with a spout width of 580 mm and hand-operated tilting equipment. The roll speed, roll separating force, contact length, and initial roll gap were fixed at 60 m/min, 33 kN, 150 mm, and 1 mm, respectively.

Vertical-type high-speed twin-roll caster equipped with large rolls.
The size of produced strip was 5500 mm long and 600 mm wide. Constant thickness was obtained in a 2500 mm long section between 2000 mm and 4500 mm from the front edge. However, in the across-the-width direction, each 50-mm-section from both edge was 10% thicker than 500-mm-section inside. Therefore, the central region of the strip shown in Fig. 2 was defined as the region to be evaluated.

The size of the cast strip and the region to be evaluated.
After the external observation of the cast strip, a 150 mm square piece was cut from the center of the strip for evaluation of its thickness distribution, surface profile, roughness, and microstructure. After its thickness distribution was measured using a micrometer, the surface profile was evaluated with a 3D measurement system (VR-3200, KEYENCE Corp.). For the roughness measurement, a stylus-based profilometer (Surftest SJ-210, Mitutoyo Corp.) was used. The nose shape of the stylus was a 90° cone with 5 µm curvature radius. The measurement force, measurement length were set to 4 mN, 4 mm respectively. For the cutoff wavelength, λc = 0.8 mm (longest) and λs = 2.5 µm (shortest) were used. Microstructural observations of the surface were carried out with a digital microscope (VHX-5000, KEYENCE Corp.). To observe the outermost surface, only decontamination by a cleaning agent was performed instead of polishing and etching. Profiles of the surface microstructure were also evaluated using 2D/3D measurement function of the digital microscope. The elemental mapping of the surface microstructure was conducted by scanning electron microscopy-energy-dispersive X-ray spectroscopy (SEM-EDS, JSM-7001F and JED-2300, JEOL Ltd.) at acceleration voltage 5 kV; the resultant elemental maps were compared with those of the surface microstructure.
2.3 Structure analysis of cast plateX-ray observations were conducted with a portable X-ray inspection apparatus (RF-100GSB, Rigaku Corp.) to analyze the distribution of internal defects and macro segregation in the cast plate. The tube voltage and the tube current were set to 60 kV and 5 mA, respectively. The cross-sectional microstructure was also observed with a digital microscope from the transverse direction. The observation surface was etched with 10% NaOH aqueous solution for 20 s after being mirror-polished.
2.4 Interrupted castingAn interrupted casting was performed to determine the formation sequence of the surface pattern. The rolls were certainly stopped during the steady-state casting, which was performed after a 3500 mm long strip was produced, and a wedge-shaped block was solidified on the twin-rolls. From the surface observation of the obtained wedge, the starting position of the surface pattern was determined.
As described in section 2.1, the large strip 600 mm wide and 5500 mm long was successfully formed without breaking. In addition, the strip thickness of the constant region was approximately 3 mm. The surface appearance of the cast strip is shown in Fig. 3. To avoid scattering diffraction, the surface was bathed in low-intensity light from an oblique direction. On the surface, long white line defects were observed along the casting direction. These defects appear to be scratches caused by aluminum sticking to the nozzle tip. A small chip was found at the end of the scratch; this chip was suspected to have fallen from the nozzle tip, which suggested that these scratches were extrinsic defects.

Surface appearance of Al–Si–Mg vertical-type high-speed twin-roll cast strip produced by wide rolls.
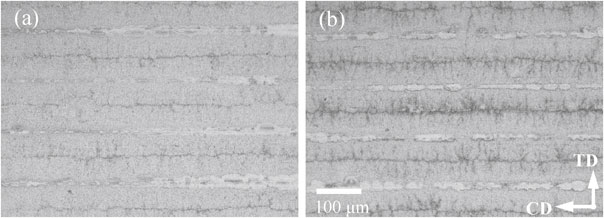
In terms of intrinsic surface patterns, a periodical pattern consisting of hatched lines of white matte patch was observed. Hereinafter, this pattern formed by the matte and glossy regions is referred to as a “cross-hatched pattern”. Figure 4 shows details of the cross-hatched pattern on the surface of the 150 mm square piece. The surface was illuminated from the casting direction by a 60 W LED floodlight. The moving-roll side (Fig. 4(a)) and the fixed-roll side (Fig. 4(b)) are shown together for comparison of the pattern size, morphology, and distribution of the two surfaces. Each matte patch exhibited an almost elliptical shape, with the major axis along the casting direction. Some of them in the lower half of the specimen were connected in an oblique direction. The shape, size, and distribution of the matte region in both surfaces were well matched; that is, the cross-hatched pattern formed on both surfaces in the same manner. Meanwhile, ripple marks of the strip were subtle compared to those observed on the surface of 100 mm wide lab-scale strips.9)

Comparison of the surface pattern between (a) the moving-roll side, and (b) the fixed-roll side.
Figure 5 compares the thickness of the glossy and matte regions. Although each thickness exhibited small variation, we confirmed that the average thickness of the glossy region is approximately 40 µm larger than that of the matte region. The detailed surface profile of the moving-roll side is shown in Fig. 6; this pattern can be compared with the surface pattern. The profile is represented by the contour figure in which the average of the whole surface is set to zero (Fig. 6(b)). The undulation of the surface was confirmed to correspond to the cross-hatched pattern (Fig. 6(a)). That is, the matte regions sank 10 to 15 µm, and the glossy regions rose by the same extent in the opposite direction. Consequently, an approximately 20–30 µm height difference arose between the matte and the glossy regions. Because the cross-hatched pattern is formed on both surfaces in the same manner (Fig. 3), the sum of these height differences results in the thickness difference shown in Fig. 5.

Thickness distributions of the cast strip: (a) glossy region, and (b) matte region.

Surface profile corresponding to the surface pattern: (a) observed surface pattern, and (b) contour drawing of the surface profile.
The roughness of the glossy and matte regions was measured along the transverse direction at 20 points in each region. Figure 7 shows the arithmetic average roughness Ra of both regions. From this comparison, we confirmed that the matte region exhibited a slightly rougher surface.

Surface roughness distributions of the cast strip: (a) glossy region, and (b) matte region.
Figure 8 shows optical micrographs of each outermost surface of the glossy and matte region. Stripes were observed along the casting direction in both the matte and glossy regions. These stripes consisted of bright and dark lines alternately arranged at regular intervals. They are attributed to the transfer of a tool mark onto the roll surfaces. The dark lines in the matte region were wider than those in the glossy region; details of these dark lines are shown in Fig. 9. Both regions contained very fine columnar crystals that grew along the transverse direction (Fig. 8(a) and (b)). The direction of columnar crystals in the matte region was more inhomogeneous than that of columnar crystals in the glossy region. The dark lines observed in Fig. 8 were identified as an array of microvoids or microcracks that developed between columnar α-phases. The wider dark lines in the matte region might be due to the large number or size of these defects in this region. The 3D profile measurement shown in Fig. 9(c) and (d) reveals the difference in asperity between the two regions. The center of the columnar crystals in the matte region was raised and formed a mountain-like range along casting direction, whereas the glossy region had slightly convex, almost flat microstructure. This difference in microstructure can account for the difference in surface roughness shown in Fig. 7.
Optical micrographs of the outermost surface of the cast strip observed at low magnification: (a) glossy region, and (b) matte region.

Surface microstructure of Al–Si–Mg vertical-type high-speed twin-roll cast plate. The upper region shows the optical microstructure of (a) the glossy region and (b) the matte region; (c) and (d) are 3D profiles corresponding to images (a) and (b), respectively.
Figure 10 shows the corresponding SEM micrographs and EDX element maps. In terms of the elemental distribution, significant difference corresponding to the pattern, such as seen in ripple marks,9) was not observed.

SEM images and EDX element maps. The upper and lower images show the glossy and the matte regions respectively.
The contrast of the surface was assumed to be due to the difference in gloss and color. As factors influencing gloss and color, two surface characteristics are pointed out. The first factor is the difference in surface roughness. Yonehara et al.13) reported that the gloss of metals increases in an exponential manner with decreasing arithmetic average roughness Ra. Although the difference in Ra between the glossy and matte regions was small (0.45 and 0.61 µm respectively), according to previous research,14,15) this small difference can slightly change the surface gloss. The second factor is the number of microdefects in the surface microstructure. Because these defects and their surrounding area are responsible for the darker color in Fig. 9(a) and (b), more defects appear to make the surface color darker or duller.
3.4 Through thickness microstructureFigure 11 shows an X-ray observation image acquired by irradiating the moving-roll side surface with X-rays. The image contrast corresponds to the cross-hatched pattern. A comparison of the surface appearance and the X-ray image confirms that the glossy regions appeared relatively white, whereas the matte regions appeared dark under X-ray observation. According to the characteristics of X-ray radiography, materials that absorb more X-rays exhibit a brighter appearance;16) as such, we speculated that the glossy regions of the strip are highly dense or contain high-atomic-number elements. At the same time, small dark dots were observed in the gloss regions. From their size and distribution, these dots appear to be voids such as shrinkage cavities or gas porosities.

Contrast in the X-ray image corresponding to the surface pattern; (a) observed surface pattern, and (b) the corresponding X-ray image.
Figure 12 shows the cross-sectional microstructure of each region. It is established that vertical-type high-speed twin-roll cast Al–Si–Mg alloy strips exhibit layered structure, in which a pair of solidified shell growing from the roll surface sandwiches a band comprising equiaxed α-Al grains and condensed eutectic phases.2,4,9) Although both glossy and matte regions presented this layered structure, there was a difference in volume of eutectic phases in the mid-thickness region. The region beneath the glossy surface contained numerous eutectic phases, which suggests normal segregation. By contrast, the matte surface region was α-Al-rich and contained few eutectic phases, indicating low solute concentration toward the mid-thickness. This discontinuous segregation band accounts for the contrast in the X-ray images.

Optical micrograph of the cross-section around the transition region of the surface pattern.
From the surface appearance, X-ray image, and cross-sectional micrographs, we concluded that the cross-hatched pattern shows good agreement with the in-plane distribution of discontinuous segregation band located in the mid-thickness.
3.5 Cross-hatched pattern induced by center segregationWe here consider the formation mechanism of the cross-hatched pattern. Understanding the causal relationship between the surface pattern and the center segregation requires confirmation of when the pattern is formed in the solidification sequence. Figure 13 shows the wedge obtained by the interrupted cast experiment. Although no periodical pattern was observed on the surface just below the nozzle tip, a similar pattern consisting of glossy and matte regions was observed in the lower part. Detailed observation (Fig. 13(b)) indicated that the pattern began at the site slightly above the roll gap. According to previous research, this site appears to be the beginning point of center segregation.6,7,17) Gras et al.7) conducted rapid stopping during twin-roll casting and reported that center segregation developed around the area where roll separating force was applied to the shells. This effect is attributed to the center segregation induced by the squeezing of liquids from solidifying shells18) or the deformation concentration on the relatively soft mid-thickness region.19) On the basis of the results shown in Fig. 13 and the previous discussion, it is assumed that the pattern is not formed while solidified shells are apart, and the center segregation and the surface pattern are formed simultaneously when the shells contact, and solidifying strip is deformed by the rolls. In a nutshell, the formation of discontinuous segregation band in the mid-thickness likely causes the cross-hatched surface pattern.

Macroscopic view of the wedge obtained by the interrupted casting; (a) overview image, and (b) image of the pattern in the wedge surface.
Figure 14 shows the presumed mechanism by which the center segregation affects the surface characteristics. For mushy-type solidification alloys such as Al–Si–Mg cast alloy, an external pressure applied during solidification is well known to induce segregation, which cannot be explained by the classical solute redistribution theory.20,21) This deviation from classical behavior is due to the rheological behavior of a semi-solid slurry.22,23) The observed periodic distribution of eutectic-rich normal segregation zone and α-rich zone in the mid-thickness (Figs. 11 and 12) also appears to be caused by this mechanism.19) If liquids squeezed from mushy-zone are distributed in a cyclic manner, the variation of the thickness will be correlated with the amount of liquid. Furthermore, the solidification shrinkage and thermal shrinkage subsequent to this liquid distribution is assumed to expand this variation. Magnusson et al.24) evaluated the solidification shrinkage of aluminum alloys with 0–12 mass% silicon by measuring the density of the liquid and solid. They reported that the shrinkage at the solidus temperature decreased from 6.6% to 4.4% as the silicon content was increased from 0% to 11.6%; this shrinkage is attributed to the silicon expanding during solidification. Therefore, the α-Al-rich regions are considered to shrink 1% or 2% more than the eutectic-rich regions. Furthermore, the difference of linear expansion coefficient between aluminum and silicon25) also increase the shrinkage volume even after complete solidification. As a result, the thickness of the α-Al-rich zones decreases (Fig. 5) and undulations develop, consistent with the segregation band distribution (Figs. 6 and 11). Because solidification and thermal shrinkage occurs not only in the thickness direction but also in the casting and transverse directions, the shrinkage is accompanied by the compression of solidified surfaces around α-Al-rich zones. This compression is presumed to cause the microscopic asperities, cracks and voids on the outermost surface over the α-Al-rich zone, as shown in Fig. 9(c) and (d). Consequently, these differences in surface characteristics induced by discontinuously distributed segregation band create the surface pattern according to the mechanism mentioned in section 3.3.

Schematic of the mechanism by which the discontinuous segregation band causes different shrinkage and surface patterns. The arrows indicate the direction of dominant shrinkage toward the center of α-Al-rich zones.
Although the proposed hypothesis can explain the cause-and-effect relationship between the center segregation and the surface pattern, it cannot account for the cross-hatched distribution of segregation band and surface pattern possibly due to the meandering flow of liquids squeezed from mushy layer or a relocation of center segregation by rolling deformation behavior. These phenomena will be the subject of further research.
3.6 Influence of cross-hatched pattern on sheet qualityAs mentioned in the section 3.3, the cross-hatched surface pattern was observed due to the difference of surface roughness and number of microdefects in the surface microstructure. However, since these differences are not so large, the surface pattern itself is expected to be eliminated by cold rolling in aluminum sheet production processes.
On the other hand, the discontinuous distribution of center segregation band which induces the cross-hatched pattern is considered to be harmful for sheet qualities. Because its distribution is likely to increase the variation in mechanical properties among positions in the sheet material. In order to grow in size and achieve practical use of vertical-type high-speed twin-roll cast Al–Si–Mg alloy strips, it is necessary to find a way to reduce the center segregation band and homogenize the microstructure in the mid-thickness across the whole strip.
Al–7%Si–0.4%Mg cast alloy strip was produced using a vertical-type high-speed twin-roll caster equipped with large rolls with a diameter and width of 600 mm. The variation of the surface characteristics and the solidified structure of the strip were investigated. The following conclusions were drawn from the present study: