Abstract
In fifth-group element superconductors V, Nb, and Ta, the increase in superconducting transition temperature (Tc) was attempted by using both high-pressure torsion (HPT) and additional hydrostatic pressure (HP) compression. The former brings about the grain refinement and strain accumulation in the unit-cell level. The additional compression for severely strained superconductors triggers strengthening intergrain-contact and/or structural deformation in the unit-cell level. The manner of the appearance of the above two effects depends on the kind of elements: First, in V, there is no prominent effect of HPT, comparing to the hydrostatic compression effects on its non-strained material. Next, in Ta, the effect of strengthening intergrain-contact appears at small hydrostatic compression, resulting in temporal increase in Tc. Finally, Nb exhibits prominent increase in Tc by both effects and, in particular, the structural deformation in the unit-cell level promotes the increase in Tc. Thus, the accumulation of residual strain in the level of starting material can be a promising work to manipulate Tc under HP compression.

1. Introduction
Bulk superconductivity exhibits macroscopic phase coherence in the Josephson arrays composed of superconducting grains. In late 1950’s–early1970’s, the superconductivity property at zero magnetic field, ex. superconducting transition temperature Tc, had been found to depend on both the sample purity and residual strain in single element superconductors such as Re,1) Ta,2) and V.3) Generally, the shear strain reduces crystallinity, and it is usually not favorable for macroscopic phase coherence. However, it had been known that it rarely works toward favorable manner in Re,1) thin film and amorphus Al,4) and so on. Furthermore when considering the fine-grain superconductors, it has been experimentally confirmed that Tc can increase with strengthening the intergrain coupling.5,6) This effect is theoretically expected to be enhanced in a system with smaller grain size.7)
Recently by using severe plastic deformation (SPD),8,9) the improvement of functionality in superconductors is successfully conducted.10–12) The SPD process plays the role of accumulating dislocations, resulting in the grain refinement at the submicrometer or nanometer ranges as shown in Fig. 1. It is known to be effective in increasing Tc of superconductors such as Nb10) and Re.12) There we have to consider both the intergrain network via grain boundary and intragrain crystallinity as factors to influence Tc. The strain installed in the SPD process is relatively evaluated via semi-experimental manner: In the case of high-pressure torsion (HPT),13–17) which is one of the SPD techniques along with equal-channel angular pressing18) and accumulative roll bonding,19,20) the revolution number N is a parameter to pursue the grain refinement. In order to elucidate both effects on Tc, we compress three fifth-element superconductors such as V, Nb, and Ta subjected to HPT as illustrated in Fig. 2(a).


In the periodic table containing 118 elements, there are 29 superconductors at ambient pressure, and 11 elements of them exhibit the increase in Tc under hydrostatic pressure (HP).21,22) Three fifth-element superconductors such as V, Nb, and Ta has nominal Tc of 5.3 K, 9.2 K, and 4.5 K, respectively. Previous studies of HP compression for V, Nb, and Ta are summarized in Tables 1, 2, and 3, respectively. All of three are considered to belong to a group that exhibits the increase in Tc under the HP circumstances.22) Indeed, smooth linear-increase in Tc is observed only in V. All previous studies for V have reported the positive dTc/dP coefficient.3,23–27) According to the study of Struzhkin et al., non-strained Nb shows the increase in Tc after its slight decrease, and has the optimal Tc of 9.9 K at around P = 10 GPa.28) Indeed, the initial dTc/dP for Nb depends on experimental conditions such as the sample condition and kind of pressure transmitting medium (PTM).23,24,28–33) Contrary to the above two, Ta exhibits the decrease in Tc over wide pressure range,2,24,28,34,35) and there is only one plot suggesting the increase in Tc at 43 GPa.28) Thus, there are much variety in the pressure dependence of Tc among V, Nb, and Ta. We are exploring the observation of new pressure response using the SPD materials. In the present study, we conduct the HP compression to strained materials subjected to the HPT process (see Fig. 2), considered as the so-called Josephson arrays of small grains, and control both Josephson coupling between superconducting grains and lattice strain at the unit-cell level. Figure 3 shows a digest of the present review. There are two parameters such as N related with the initially installed strain [Fig. 2(a)] and pressure (P) related with additional strain [Fig. 2(b)]. Both HPT apparatus and HP one commonly using anvils have the same route of Bridgman’s excellent achievement.13)

Table 1 Previous studies on hydrostatic pressure (HP) experiments for V. PTM: pressure-transmitting medium; nP-iA: 1:1 mixture of n-pentane and isoamyl alcohol, and Ap-J: Apiezon-J oil. CY: cylindrical sample, AR: as-received sample, S: single-crystal, SP: small pieces, ARC: arc-melted, and HPT: high-pressure torsion. N denotes the revolution number of the HPT procedure performed at 6 GPa.

Table 2 Previous studies on HP experiments for Nb. PTM: pressure-transmitting medium; nP-iA: 1:1 mixture of n-pentane and isoamyl alcohol, Ap-J: Apiezon-J oil, MEW: methanol–ethanol–water mixture in volume ratio of 16:3:1, and O2: condensed oxygen molecule. CY: cylindrical sample, AR: as-received sample, S: single-crystal, PO: polycrystal, SP: small pieces, PU: purified near the melting point, ARC: arc-melted, and HPT: high-pressure torsion. N denotes the revolution number of the HPT procedure performed at 6 GPa.

Table 3 Previous studies on HP experiments for Ta. PTM: pressure-transmitting medium; Ap-J: Apiezon-J oil, SP: small pieces, and HPT: high-pressure torsion. N denotes the revolution number of the HPT procedure performed at 6 GPa.
2. Experimentals
2.1 High-pressure torsion (HPT)
As illustrated in Fig. 2(a), the disks of V, Nb, and Ta were subjected to HPT processing at room temperature under a selected pressure of P = 6 GPa and revolutions of N up to 20 with a rotation speed of 1 rpm. Specimens with dimensions of approximately 0.8 × 0.8 × 0.5 mm3 were cut from an HPT-processed disk using a wirecutting electric discharge machine at the position of 2.5 mm from the disk center. For instance, in Nb, we remark that for N < 2, dislocations are stored as illustrated in Fig. 2(a-1), and the grain size largely changes.36) The small-angle grain boundaries formed in these cases gradually transform to large-angle grain boundaries with increasing N (corresponding to the change form Fig. 2(a-2) to Fig. 2(a-3)). On the other hand, for N ≥ 2, the fraction of large-angle grain boundaries increases due to annihilation of dislocations at grain boundaries (illustrated in Fig. 2(a-3)), leading to that the grain size remains unchanged because of the balance between dislocation generation by straining and the dislocation annihilation at grain boundaries. The grain size at steady state for V, Nb, and Ta is 330 nm, 240 nm, and 180 nm, respectively.37)
In Nb, we note here that the average grain sizes for AR, N = 2, N = 5, and N = 10(cryo) samples have been reported to be 140 µm, 250 nm, 240 nm, and ca. 40 nm, respectively.36,38) Thus, the shear insertion leads to a significant reduction in the grain size. The superconducting coherence length ξ(0) for the single-crystal has been reported as around 20 nm,39) and the aforementioned grain sizes for N = 2, N = 5, and N = 10(cryo) are at a level comparable with ξ(0).10) The penetration depth for the single-crystal is approximately 40 nm,39) and large superconducting signal observed in the present study reflects the intergrain coupling via grain boundaries. At ambient pressure, Tc for AR is approximately 9.25 K, and Tc exhibits a maximum of approximately 9.37 K at N = 2. In addition, Tc remains unchanged at 9.35 K for N > 10.10)
For the following hydrostatic experiment, small pieces with side lengths less than 0.1 mm were prepared from the specimens with dimensions of approximately 0.8 × 0.8 × 0.5 mm3 as illustrated in Fig. 2. As for Ta, it has been known that Ta subjected to the HPT processing has two superconducting transitions.40) The Meissner signal with lower Tc exhibits majority of superconducting volume fraction. In the present experiment using little sample volume, it was difficult to pursue the change in the Meissner signal with higher Tc under HP compression. Thus, for HPT-Ta, we have paid much attention to the change in the Meissner signal with lower Tc that exhibits the same pressure dependence as that for the midpoint of the Meissner signal. In the electrical resistance measurements for superconductors under high pressure, it is difficult to measure zero resistance. In particular, this problem becomes more serious in strained superconductors under non-HP compression. Therefore, we adopt the Meissner measurements to evaluate Tc of V, Nb, and Ta in the present extreme condition.
2.2 SQUID magnetometer with miniature-DAC (mDAC)
The AC magnetization of the materials at pressures of GPa level was measured using a superconducting quantum interference device (SQUID) magnetometer equipped with an AC option.41–47) The frequency and amplitude of the AC field were 10 Hz and 3.9 Oe, respectively. At small amplitude of AC field, the magnitude of in-phase one (m′) is almost consistent with the Meissner signal observed at static magnetic field.48) Sufficiently below Tc, there is no out-of-phase component reflecting energy loss, and m′ is related with the volume fraction of magnetic shielding. The onset temperature of the superconducting signal was evaluated as the confident Tc after the quantitative deviation of the onset temperature was confirmed to be consistent with that of the midpoint temperature.
Contraction corresponding to a stress of up to 15 GPa was achieved using a miniature CuBe diamond anvil cell (DAC) that consisted of two diamond anvils with flat tips having a diameter of 0.5 mm and a 0.25-mm-thick Re gasket.49,50) In the HP-type experiments, liquid-like PTM, Apiezon-J oil (Ap-J), was confined together with small pieces of the HPT materials in the sample chamber: At room temperature, Apiezon-J oil solidifies at a few one-tenth GPa. The pressure value at room temperature (Prt) was evaluated by measuring the fluorescence of ruby51) located in the sample cavity with the HPT materials. According to Ref. 49, when temperature is cooled from room temperature to liquid helium temperature, there appears the pressure increase equal to approximately 10% of Prt. In this paper, Prt is adopted as the pressure value (P) in each measurement, since the comparison between magnetic and structural data at low pressures of P < 7 GPa is meaningful.
2.3 SQUID-based vibrating coil magnetometer (SQUID-VCM)
The DAC is mounted in the 4He-refrigerator with a 1 K pot, and the entire DAC is heated. The use of diamond anvils with different culet size (i.e. 500 and 550 µm) allows the CuBe–NiCrAl composite gasket to be deformed away from the NbTi detection coil. The NiCrAl disk with the diameter of 410 µm was inserted into the hole drilled in the center of CuBe gasket.52) After pressing the composite gasket down to 70 µm, a hole with the diameter of 200 µm was drilled in the center. In the sample cavity, the small pieces of HPT-V (N = 10) were held together with Apiezon-J oil and ruby as a room-temperature manometer. The magnitude of the pressure (P) was estimated at room temperature by measuring the fluorescence of ruby.51)
Using an actuating unit consisting of three actuators, the detection coil is ideally vibrated at the place where the slope of magnetic flux against the distance from the sample is maximum.53) To obtain sufficient amplitude of the vibration of the detection coil at liquid helium temperature, the driving frequency of the vibrating actuators, consisting of bimorph type piezoelectric actuators, was chosen to be 168 Hz near the resonating frequency of the vibrating actuators.54) The DAC and the actuating unit are located in the cryostat as shown elsewhere.54) Hdc was applied at 30 Oe at maximum. The use of a lock-in amplifier at the vibration frequency yields the amplitude of VVCM.
2.4 X-ray diffraction under hydrostatic compression
In order to determine the structural shrinkage under pressure, we performed X-ray diffraction (XRD) analyses for Nb and Ta under high pressure of up to P = 6.8 GPa at room temperature using a synchrotron radiation XRD system with a cylindrical imaging plate at the Photon Factory at the Institute of Materials Structure Science, High Energy Accelerator Research Organization.55) The energy of the incident X-rays was 16 keV. Pressure was applied using a DAC that consisted of two diamond anvils with flat tips having a diameter of 0.8 mm and a 0.3-mm-thick CuBe gasket. The small pieces of HPT-Nb or HPT-Ta were placed in a randomly oriented manner in a sample cavity with a diameter of 0.4 mm along with a ruby of manometer and transparent PTM such as fluorinated oil (FC77, Sumitomo 3M Ltd.). Transparent FC77 undergoes solidification below 1 GPa at room temperature56) similarly to brown Ap-J. All the atomic positions in the body-centered cubic (bcc) structure are special positions, and therefore, the structural parameters can be evaluated just with the use of the diffraction peak angle. The lattice parameters were estimated using all of observed diffraction peaks: For Nb, we used five diffraction peaks of the plane indices (110), (200), (211), (220), and (310). For Ta, the diffraction peak of the plane index (310) was not used.
3. Experimental Results
3.1 HPT-V
Figure 4 shows the temperature dependence of in-phase ac magnetization m′ for HPT-V (N = 0) (a) and HPT-V (N = 10) (b) by using a SQUID magnetometer with miniature-DAC (mDAC). Figure 5 shows VVCM that corresponds to the temperature dependence of dc magnetic susceptibility for HPT-V (N = 10) by using the SQUID-VCM magnetometer. Figure 6 shows the pressure dependence of Tc for HPT-V (N = 0) and HPT-V (N = 10). Comparing Tc’s at P = 5.0 GPa, HPT-V (N = 10) has slightly higher value than HPT-V (N = 0). However, when we see their data in wider pressure range, there is no prominent difference in the change in Tc between HPT-V (N = 0) and HPT-V (N = 10), which are consistent with the previous data by Ishizuka et al.27)
3.2 HPT-Nb
Figures 7(a)–(c) shows the temperature dependence of in-phase ac magnetization m′ for the HPT-Nb (N = 1, 2, and 10) materials by using a SQUID magnetometer with mDAC. The onset of the Meissner signal shows the change similar to that of the midpoint, and the onset temperature is determined to be Tc. The pressure dependence of Tc for HPT-Nb (N = 1, 2, and 10) is shown in Fig. 7(d), comparing to that of as-received (AR) Nb material. Three HPT materials exhibit the larger enhancement of Tc than the AR material. In particular, HPT-Nb (N = 1) shows the increase in Tc over 9.8 K at around P = 1 GPa. As N increases like N = 1 → 5, the maximum Tc shifts toward higher pressure side, decreasing the maximum value.
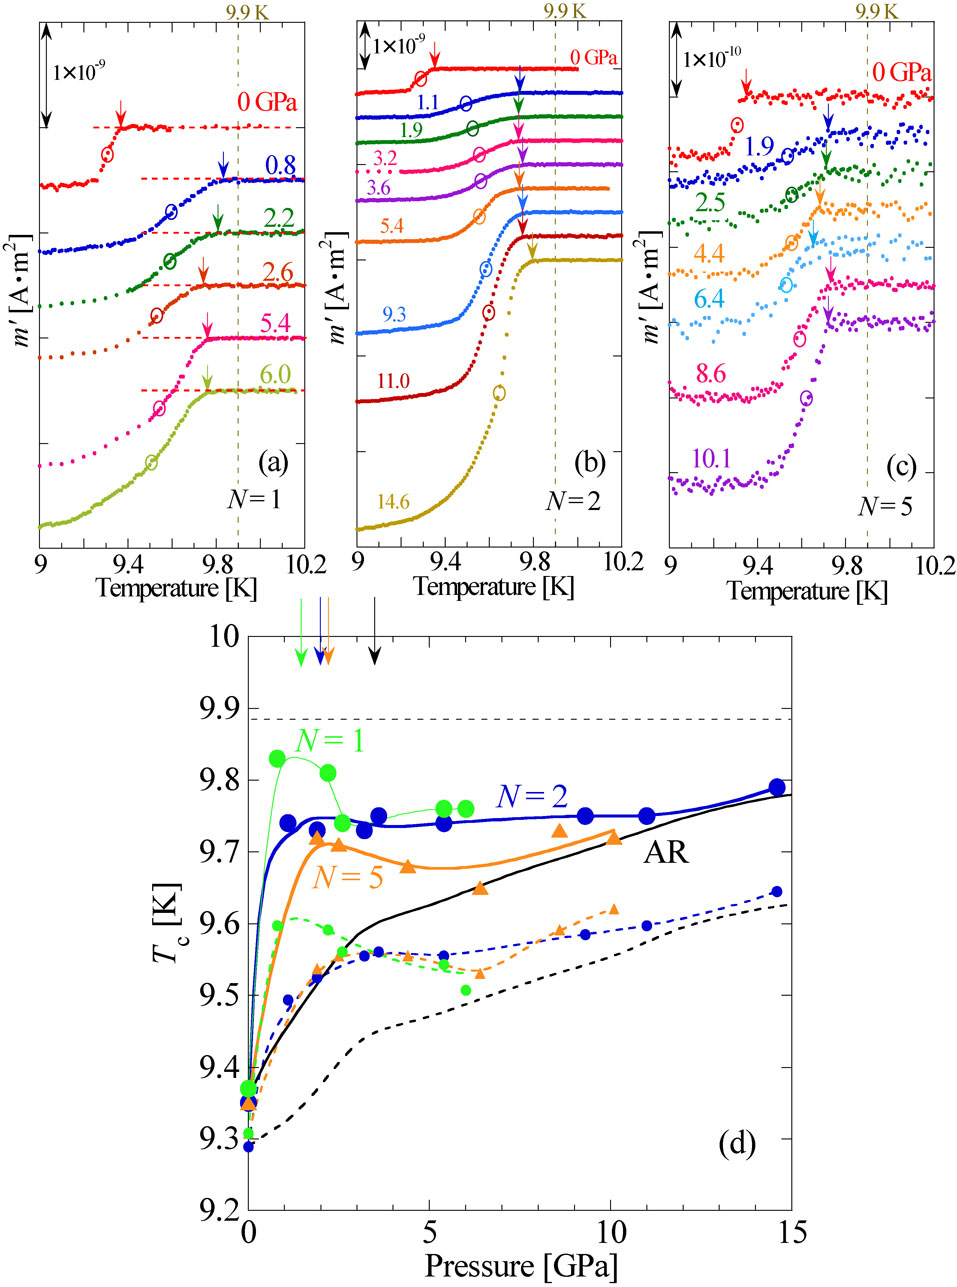
Figures 8(a)–(c) shows the temperature dependence of in-phase ac magnetization m′ for the HPT-Nb (N = 10) material by using a SQUID magnetometer with mDAC. The pressure dependence of the onset temperature Tc for HPT-Nb (N = 10) is shown in Fig. 8(d). Tc of HPT-Nb (N = 10) exhibits the maximum Tc over 9.8 K at around P = 2 GPa. The behavior of Tc for HPT-Nb (N = 10) is not on an expanded line of changes for N = 1 → 5. Tc for all HPT-Nb (N = 1, 2, 5, 10) materials shows consistency with that for AR at around P = 15 GPa. The feature due to the HPT processing appears in the pressure region below 15 GPa.

Figures 9 shows the pressure dependence of interplanar distance of (110), (200), (211), (220), and (310) for the HPT-Nb materials for N = 1 (c) and 10 (d). For reference, the data for both arc-melting (ARC) and AR materials are also shown in Figs. 9(a) and 9(b), respectively. At first, the AR material exhibits anisotropic transformation of the unit cell structure at around P = 2 GPa, suggesting that strain accumulated in the cubic lattice with high symmetry is released at a threshold pressure (Pc). This phenomenon does not occur in the ARC material without residual strain, suggesting the importance of residual strain. When the HPT procedure with N = 1 is subjected to the AR material, the grain refinement enhances the capacity of accumulating the additional strain, resulting in the increase in Pc to approximately 3.4 GPa. However, HPT with the level of N = 10 does not permit to accumulate any additional strain, so that anisotropic unit-cell deformation occurs even at quite small pressure.

Figure 10 shows the pressure dependence of anisotropic lattice deformation using normalized lattice constants a1/acubic, a2/acubic, and a3/acubic for ARC (a), AR (b), HPT-Nb (N = 1) (c), and HPT-Nb (N = 10) (d) samples. Herein, acubic is a lattice constant considering the bcc lattice. Comparing with ARC, AR and HPT (N = 1) exhibits the one-direction shrinkage and two-direction expansion. On the other hand, the HPT (N = 10) material exhibits two-direction shrinkage for P < 2 GPa and two-direction expansion for P > 2 GPa. At around 2 GPa, the deformation manner changes, suggesting complex manner of strain release. In particular, the HPT (N = 10) material with heavy residual strain has a deformed bcc structure, which is close to the body-centered tetragonal (bct) structure for P > 3 GPa.
3.3 HPT-Ta
Figures 11, 12, and 13 shows the temperature dependence of in-phase ac magnetization m′ for the HPT-Ta (N = 0, 2, and 10) materials by using a SQUID magnetometer with mDAC. The onset of the Meissner signal is determined to be Tc. The pressure dependence of Tc for HPT-Ta (N = 0, 2, and 10) is shown in Fig. 14, comparing to the previous data for non-strained Ta.28) All of three HPT materials exhibit the maximum Tc at around P = 1–2 GPa. For P < 2 GPa, HPT (N = 2) shows the highest Tc among three, whereas for P > 2 GPa, HPT (N = 10) does the highest Tc. HPT (N = 0.5) with initial accumulation of dislocation exhibits little increase in Tc. HPT (N = 5) with competition of small-angle grain boundaries and large-angle grain boundaries exhibits strange down-up-down-up-down change in Tc. These behaviors suggests that intergrain network becomes a key factor to determine Tc.


Figures 15 shows the pressure dependence of interplanar distance of (110), (200), (211), and (220) for the HPT-Ta samples for N = 0 (a), 2 (b), and 10 (c). In all of three, all of interplanar distances exhibit the shrinkage, and there are no anisotropic deformation of the bcc unit cell. For N = 0, at around P = 1–2 GPa, the shrinkage magnitude is suppressed similarly to that observed in AR-Nb. The above pressure region is consistent with that possessing the maximum of Tc. On the other hand, both N = 2 and 10 shows that the uniform contraction continues monotonously. Both HPT (N = 2) and HPT (N = 10) do not show anomalous change in a at around P = 1–2 GPa, suggesting that the increase in Tc cannot be explained only with the change in lattice constant. Figure 16 shows the pressure dependence of normalized lattice constant a. There is no prominent N dependence, and a continues to decrease monotonously in the considered pressure region.
4. Discussion
4.1 Josephson contact
In the HPT procedure, the shear stress inserts dislocations and reduces crystallinity, resulting in the grain refinement at the submicrometer or nanometer ranges as shown in Fig. 1. The additional HP compression reduces the intergrain space, and strengthens the intergrain coupling. It has already been confirmed in the experimental side that Tc can increase with strengthening the intergrain coupling.5,6) This effect is theoretically suggested to be enhanced in a system with smaller grain size.7) We assume that the aforementioned effect appears prominently for HPT-Nb (N = 1) and all HPT-Ta (N = 0, 2, and 10) materials.
4.2 Anisotropic unit-cell compression ∼Change in Density of State by Deforming Lattice∼
We have to consider another mechanism for increasing Tc for the HPT-Nb (N = 10) materials. According to another work,33) sharp increase in Tc for HPT-Nb (N = 10) using the Apiezon-J grease does not appear in the case of good HP condition using MEW and O2. The maximum Tc for HPT-Nb (N = 10) using the Apiezon-J oil should be related with the anisotropic contraction of the unit cell. Thus, it is of interest to understand whether or not the anisotropic structure change from bcc to the orthorhombic system close to the tetragonal lattice actually leads to the increase in Tc.
We performed density-functional calculations for Nb using the extended version of the Tokyo Ab-initio Program Package57) with plane-wave basis sets, where norm-conserving pseudopotentials58,59) and the generalized gradient approximation of the exchange-correlation potential60) were employed. The cutoff energies in the wavefunction and charge densities were 64 and 256 Ry, respectively, and 40 × 40 × 40 k-point sampling was employed. The electronic density of states (DOS) was calculated by means of the generalized tetrahedron method.61,62)
Based on experimental trends in the lattice change, we first focus on the specific deformation of the bcc structure to the bct structure, which is schematically shown in Fig. 17. The deformation is expressed as (a, a, a) → (a′, a′, c′) with a′ = (1 + δ)a and c′ = (1 − δ)a. In the present calculation, we assume a = 3.29 Å and δ = 0.015. The Bravais lattice is expressed for a bcc system as,
| \begin{equation*}
\mathbf{a}_{1} = \frac{a}{2}(-1,1,1),
\end{equation*}
|
| \begin{equation*}
\mathbf{a}_{2} = \frac{a}{2}(1,-1,1),
\end{equation*}
|
| \begin{equation*}
\mathbf{a}_{3} = \frac{a}{2}(1,1,-1),
\end{equation*}
|
and for a bct one as
| \begin{equation*}
\mathbf{a}_{1} = \frac{a}{2}[-(1 + \delta),1 + \delta,1 - \delta],
\end{equation*}
|
| \begin{equation*}
\mathbf{a}_{2} = \frac{a}{2}[1 + \delta, - (1 + \delta),1 - \delta],
\end{equation*}
|
| \begin{equation*}
\mathbf{a}_{3} = \frac{a}{2}[1 + \delta,1 + \delta, - (1 - \delta)].
\end{equation*}
|
Figure 18 depicts the calculated electronic DOS, with the inset depicting the magnification of the low-energy regime. We observe an increase in the DOS at the Fermi level N(0) from the bcc to the bct structures. Here, the value of N(0) is 1.466 (states/eV/atom) for bcc and 1.540 (states/eV/atom) for bct. The order of the present bcc value is reasonably consistent with the past theoretical result.63)
By the McMillan-Allen-Dynes formula, Tc can be expressed on a quantitative basis as
| \begin{equation}
T_{\text{c}} = \frac{\omega_{\text{ln}}}{1.2}\exp\left\{- \frac{1.04(1 + \lambda)}{\lambda - \mu^{*}(1 + 0.62\lambda)}\right\},
\end{equation}
| (1) |
where ω
ln is the phonon frequency, λ is the electron lattice coupling, and μ
* is the effective Coulomb potential.
64,65) In the case of Nb, λ is of the order of 1, while μ
* is of the order of 0.1.
66) We can pay much attention to λ rather than μ
*.
According to McMillan’s theoretical work for strong-coupled superconductors, the electron-phonon coupling of the bcc 4d transition-metal superconductors is strengthened with the increase in N(0).64) An increase in the electron-phonon coupling constant as well as that in N(0) contribute to the increase in Tc. Consequently, we speculate that the observed N(0) increase due to deformation contributes to the experimental trend of Tc increase.
4.3 Compression effects on V
There is no prominent difference in the change in Tc under HP experiments using Ap-J between HPT-V (N = 0) and HPT-V (N = 10), and they are consistent with the previous data without using PTM by Ishizuka et al.27) The XRD studies by Jenei et al. reported the existence of structural phase transition from bcc to rhombohedral structure around 62 GPa under quasihydrostatic compression in the Ne pressure medium.67) Under the nonhydrostatic condition, the phase transition occurs at 30 GPa at ambient temperature. Thus, we can assume that the lattice constant monotonically decreases with applying the pressure without the phase transition in the pressure region up to 30 GPa. This trend basically leads to the decrease in N(0) and Tc. In fact, the experiment exhibits that Tc monotonously increases with an increase in pressure (Fig. 6). Then, the observed increasing trend of Tc in V is not simply described as the effect of N(0). According to superconducting density functional theory, the superconductivity of V seems to be beyond the conventional phonon superconductivity; the theoretical Tc based on the phonon mechanism is much overestimated as 16.3 K compared with the experimental value of 5.4 K.68) As the possible cause of disagreement, instability of the Cooper pair based on spin fluctuation has been suggested. In general, applying pressure to the system to increase the metallicity would result in suppression of spin fluctuations. Thus, observed positive correlation between the pressure increase and the Tc increase in V might be explained as suppression of the spin fluctuation with pressure increase. Furthermore, the change in spin fluctuation under pressure may mask the effects of strengthening intergrain-contact and slight structural deformation in the unit-cell level. They are important future problems to be investigated.
5. Conclusion
In fifth-group element superconductors V, Nb, and Ta, artificial material manipulation using the severe plastic deformation and additional hydrostatic compression was attempted to increase the superconducting transition temperature Tc. In HPT-Nb with the small N and HPT-Ta for N = 0, 2, and 10, the increase in Tc due to strengthening the intergrain contacts was observed. Further, the prominent increase in Tc for HPT-Nb for N = 10 originates in the anisotropic deformation of the unit cell. When the quasi-hydrostatic compression is yielded to the material with heavy residual strain in the unit cell, severe strain accumulated in the bcc unit cell with high symmetry is released at a small amount of additional pressure. In the case of Nb, this manner of lattice deformation is favorable for increasing Tc. The knowledge obtained there yields a new strategy to increase Tc from the viewpoints of material science. There would be further potentiality for increasing Tc in the border region between material science using severe plastic deformation and extreme condensed-matter physics using hydrostatic compression.
Acknowledgments
This work was supported by JSPS KAKENHI Grant Number 17H03379 and 16K05460. This work was also supported by MEXT KAKENHI, a Grant-in-Aid for Scientific Research (S) (No. 26220909). The HPT process was carried out at the International Research Center on Giant Straining for Advanced Materials (IRC-GSAM) in Kyushu University.
REFERENCES
- 1) J.K. Hulm and B.B. Goodman: Phys. Rev. 106 (1957) 659.
- 2) L.D. Jennings and C.A. Swenson: Phys. Rev. 112 (1958) 31.
- 3) T.F. Smith: J. Phys. F 2 (1972) 946.
- 4) M. Strongin: Physica 55 (1971) 155.
- 5) H. Deguchi, K. Koyama, M. Yasunaka, S. Takagi, N. Nagano and K. Mizuno: J. Phys. Chem. Solids 63 (2002) 1081.
- 6) K. Koyama, H. Deguchi, S. Takagi and K. Mizuno: J. Low Temp. Phys. 131 (2003) 595.
- 7) J. Mayoh and A.M. García-García: Phys. Rev. B 90 (2014) 134513.
- 8) R. Valiev, Y. Estrin, Z. Horita, T. Langdon, M. Zehetbauer and Y. Zhu: JOM 58(4) (2006) 33.
- 9) R. Valiev, R. Islamgaliev and I. Alexandrov: Prog. Mater. Sci. 45 (2000) 103.
- 10) T. Nishizaki, S. Lee, Z. Horita, T. Sasaki and N. Kobayashi: Physica C 493 (2013) 132.
- 11) K. Edalati, T. Daio, S. Lee, Z. Horita, T. Nishizaki, T. Akune, T. Nojima and T. Sasaki: Acta Mater. 80 (2014) 149.
- 12) M. Mito, H. Matsui, K. Tsuruta, T. Yamaguchi, K. Nakamura, H. Deguchi, N. Shirakawa, H. Adachi, T. Yamasaki, H. Iwaoka, Y. Ikoma and Z. Horita: Sci. Rep. 6 (2016) 36337.
- 13) P.W. Bridgman: Phys. Rev. 48 (1935) 825.
- 14) N.A. Smirnova, V.I. Levit, V.I. Pilyugin, R.I. Kuznetsov, L.S. Davydova and V.A. Sazonova: Fiz. Met. Metalloved. 61 (1986) 1170.
- 15) Y. Harai, Y. Ito and Z. Horita: Scr. Mater. 58 (2008) 469.
- 16) K. Edalati and Z. Horita: Mater. Sci. Eng. A 652 (2016) 325.
- 17) A. Zhilyaev and T. Langdon: Prog. Mater. Sci. 53 (2008) 893.
- 18) V.M. Segal, V.I. Reznikov, A.E. Drobyshevskiy and V.I. Kopylov: Russian Metall. 1 (1981) 99.
- 19) A. Azushima, R. Kopp, A. Korhonen, D.Y. Yang, F. Micari, G.D. Lahoti, P. Groche, J. Yanagimoto, N. Tsuji, A. Rosochowski and A. Yanagida: CIRP Ann. Manuf. Tech. 57 (2008) 716.
- 20) Y. Saito, H. Utsunomiya, N. Tsuji and T. Sakai: Acta Mater. 47 (1999) 579.
- 21) J.S. Schilling: Handbook of High-Temperature Superconductivity, ed. by J.R. Schrieffer, (Springer, New York, 2007) pp. 427–462.
- 22) M. Debessai, J.J. Hamlin and J.S. Schilling: Phys. Rev. B 78 (2008) 064519.
- 23) W.E. Gardner and T.F. Smith: Phys. Rev. 144 (1966) 233.
- 24) D. Köhnlein: Z. Phys. 208 (1968) 142.
- 25) N.B. Brabdt and O.A. Zarubia: Sov. Phys. Solid State 15 (1973) 2281.
- 26) Y. Akahama, M. Kobayashi and H. Kawamura: J. Phys. Soc. Jpn. 64 (1995) 4049.
- 27) M. Ishizuka, M. Iketani and S. Endo: Phys. Rev. B 61 (2000) R3823.
- 28) V.V. Struzhkin, Y.A. Timofeev, R.J. Hemley and H.K. Mao: Phys. Rev. Lett. 79 (1997) 4262.
- 29) W. Gey and G. van Heyden: Z. Phys. 193 (1966) 65.
- 30) W. Gey: Z. Phys. 229 (1969) 85.
- 31) N.B. Brandt and E. Papp: Sov. Phys. JETP 30 (1970) 595.
- 32) T.F. Smith: Phys. Lett. 33 (1970) 465.
- 33) M. Mito, Y. Kitamura, T. Tajiri, K. Nakamura, R. Shiraishi, K. Ogata, H. Deguchi, T. Yamaguchi, N. Takeshita, T. Nishizaki, K. Edalati and Z. Horita: J. Appl. Phys. 125 (2019) 125901.
- 34) J. Hatton: Phys. Rev. 103 (1956) 1167.
- 35) M.D. Fiske: J. Phys. Chem. Solids 2 (1957) 191.
- 36) S. Lee and Z. Horita: Mater. Trans. 53 (2012) 38.
- 37) K. Edalati and Z. Horita: Acta Mater. 59 (2011) 6831.
- 38) K. Edalati, J.M. Cubero-Sesin, A. Alhamidi, I. Mohamed and Z. Horita: Mater. Sci. Eng. A 613 (2014) 103.
- 39) P. Das, C.V. Tomy, S.S. Banerjee, H. Takeya, S. Ramakrishnan and A.K. Grover: Phys. Rev. B 78 (2008) 214504.
- 40) T. Nishizaki: private communication (2019).
- 41) M. Mito, Y. Komorida, H. Tsuruda, J. Tse, S. Desgreniers, Y. Ohishi, A. Leitch, K. Cvrkalj, C. Robertson and R. Oakley: J. Am. Chem. Soc. 131 (2009) 16012.
- 42) A.A. Leitch, K. Lekin, S.M. Winter, L.E. Downie, H. Tsuruda, J.S. Tse, M. Mito, S. Desgreniers, P.A. Dube, S. Zhang, Q. Liu, C. Jin, Y. Ohishi and R.T. Oakley: J. Am. Chem. Soc. 133 (2011) 6051.
- 43) H. Tsuruda, M. Mito, H. Deguchi, S. Takagi, A. Leitch, K. Lekin, S. Winter and R. Oakley: Polyhedron 30 (2011) 2997.
- 44) S. Yamaguchi, N. Yamaguchi, M. Mito, H. Deguchi, P.J. Baker, S.J. Blundell, M.J. Pitcher, D.R. Parker and S.J. Clarke: J. Korean Phys. Soc. 63 (2013) 445.
- 45) M. Mito, T. Imakyurei, H. Deguchi, K. Matsumoto, H. Hara, T. Ozaki, H. Takeya and Y. Takano: J. Phys. Soc. Jpn. 83 (2014) 023705.
- 46) M. Mito, H. Matsui, H. Goto, H. Deguchi, K. Matsumoto, H. Hara, T. Ozaki, H. Takeya and Y. Takano: J. Phys. Soc. Jpn. 85 (2016) 024711.
- 47) M. Mito, K. Ogata, H. Goto, K. Tsuruta, K. Nakamura, H. Deguchi, T. Horide, K. Matsumoto, T. Tajiri, H. Hara, T. Ozaki, H. Takeya and Y. Takano: Phys. Rev. B 95 (2017) 064503.
- 48) T. Tomita, J.S. Schilling, L. Chen, B.W. Veal and H. Claus: Phys. Rev. B 74 (2006) 064517.
- 49) M. Mito, M. Hitaka, T. Kawae, K. Takeda, T. Kitai and N. Toyoshima: Jpn. J. Appl. Phys. 40 (2001) 6641.
- 50) M. Mito: J. Phys. Soc. Jpn. Suppl. A 76 (2007) 182.
- 51) G.J. Piermarini, S. Block, J.D. Barnett and R.A. Forman: J. Appl. Phys. 46 (1975) 2774.
- 52) M. Ishizuka: Rev. Sci. Instrum. 76 (2005) 123902.
- 53) M. Ishizuka, K. Amaya and S. Endo: Rev. Sci. Instrum. 66 (1995) 3307.
- 54) K. Irie, K. Shibayama, M. Mito, S. Takagi, M. Ishizuka, K. Lekin and R.T. Oakley: Phys. Rev. B 99 (2019) 014417.
- 55) A. Fujiwara, K. Ishii, T. Watanuki, H. Suematsu, H. Nakao, K. Ohwada, Y. Fujii, Y. Murakami, T. Mori, H. Kawada et al. J. Appl. Cryst. 33 (2000) 1241.
- 56) T. Varga, A.P. Wilkinson and R.J. Angel: Rev. Sci. Instrum. 74 (2003) 4564.
- 57) J. Yamauchi, M. Tsukada, S. Watanabe and O. Sugino: Phys. Rev. B 54 (1996) 5586.
- 58) N. Troullier and J.L. Martins: Phys. Rev. B 43 (1991) 1993.
- 59) L. Kleinman and D.M. Bylander: Phys. Rev. Lett. 48 (1982) 1425.
- 60) J.P. Perdew, K. Burke and M. Ernzerhof: Phys. Rev. Lett. 77 (1996) 3865.
- 61) T. Fujiwara, S. Yamamoto and Y. Ishii: J. Phys. Soc. Jpn. 72 (2003) 777.
- 62) Y. Nohara, S. Yamamoto and T. Fujiwara: Phys. Rev. B 79 (2009) 195110.
- 63) K.H. Lee and K.J. Chang: Phys. Rev. B 54 (1996) 1419.
- 64) W.L. McMillan: Phys. Rev. 167 (1968) 331.
- 65) P.B. Allen and R.C. Dynes: Phys. Rev. B 12 (1975) 905.
- 66) R. Akashi, K. Nakamura, R. Arita and M. Imada: Phys. Rev. B 86 (2012) 054513.
- 67) Z. Jenei, H.P. Liermann, H. Cynn, J.-H.P. Klepeis, B.J. Baer and W.J. Evans: Phys. Rev. B 83 (2011) 054101.
- 68) N.N. Lathiotakis, M.A.L. Marques, M. Lüders, L. Fast and E.K.U. Gross: Int. J. Quantum Chem. 99 (2004) 790.


