Texture Evolution in Severe Plastic Deformation Processes
Keywords:
texture,
severe plastic deformation
2019 Volume 60 Issue 8 Pages 1457-1471

Details
2019 Volume 60 Issue 8 Pages 1457-1471
Severe plastic deformation processes involve large grain rotations due to the action of different modes of plastic deformation and other microstructural changes which lead to characteristic texture formation. The present review deals with the evolution of texture during the most important severe plastic deformation processes, namely Equal Channel Angular Pressing (ECAP), High Pressure Torsion (HPT), Friction Stir Processing (FSP), Accumulative Roll Bonding (ARB) and Multi-Axial Forging (MAF). First three of the processes are shear based, while the latter two are plane-strain based. The textures formed during ECAP are visually different from simple shear textures due to (i) the inclination of the shear plane, (ii) additional contribution of non-shear based deformation. The relative intensities of texture components are function of deformation micro-mechanisms, amount of straining and configuration of the strain path. The texture evolved during HPT is very similar to simple shear texture, with additional consequences of microstructural changes that occur due to very large deformations. The textures formed in FSP process also resemble shear textures. On the other hand, texture evolution during ARB and MAF can be described using plane strain deformation. The present review deals with texture evolution during severe plastic deformation as a function of nature of processes and type of materials.

The relevance for SPD processing is the production of bulk ultrafine grained materials without changing the dimensions. Severe plastic deformation is generally carried out for grain size reduction, which in turn leads to the enhancement in strength and hardness of a material. SPD techniques introduce a large amount of strain in the material, and a variety of strain path changes. As a consequence, substantial modification/evolution of texture also occurs, that plays an equally important role in the mechanical response of the deformed material, together with grain size. Texture too plays a major role in the grain refinement process during SPD.
Texture is defined as the orientation distribution of crystallites in a polycrystalline aggregate. Texture changes are produced by the rotation of grains. During deformation, small regions within a grain start rotating by the activity of different slip systems, which lead to the formation of substructures within the grain. The orientation within these substructures will have a slight deviation from that of its parent grain. Gradually these substructures rotate to preferred orientations which are characteristic to the applied deformation. The same mechanism is applicable when deformation is mediated through twinning, except for the fact that the twinned region will exhibit a high misorientation angle with respect to its parent grain. The characteristic orientations are also dependent on the rate of rotation of the crystallites.
Many severe plastic deformation techniques have been proposed. The most important among them are equal channel angular pressing (ECAP), high pressure torsion (HPT), friction stir processing (FSP), accumulative roll bonding (ARB) and multi-axial forging (MAF). Out of these processes, first three are shear based processes, and the latter two involve plane strain deformation. Accordingly, the texture evolved during severe plastic deformation can also be categorised in two types: (i) shear based, and (ii) plane strain based.
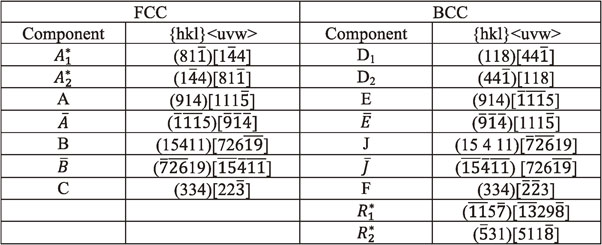
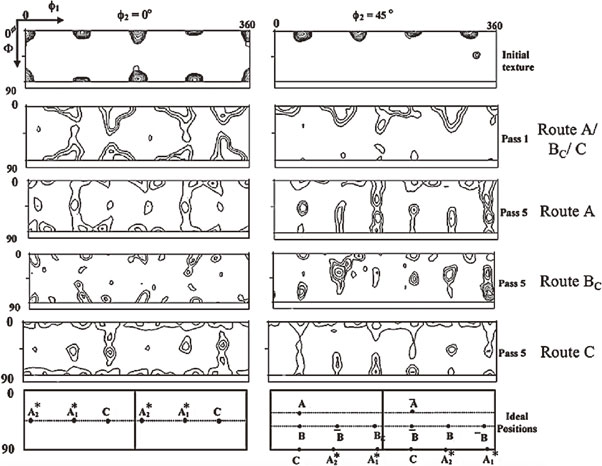
2.1 Ideal orientations after shear based SPD processesAs mentioned earlier, textures evolved during SPD are basically deformation textures. The parameters that control the deformation texture are the imposed strain path, crystallographic factors governing the mechanism of deformation (slip, twinning etc.) and the initial microstructure and texture. In the following subsections, the evolution of texture has been described on the basis of strain path selected for each type of materials. ODF sections showing the location of ideal orientations during shear based and plane-strain based deformation processing are shown in Fig. 1, and the corresponding components are listed in Table 1.


The ideal orientations formed under simple shear deformation in an FCC crystal has been widely studied and reported.1,2) The texture in ECAP materials is described with respect to the shear plane (SP) and the shear direction (SD). The texture typically consists of fibers, designated as the A fiber with {111} ∥ SP and the B fiber with ⟨110⟩ ∥ SD. The A fiber contains the A, $\skew3\bar{A}$, $A_{1}^{*}$, $A_{2}^{*}$ texture components while the B fiber contains the A, $\skew3\bar{A}$, B, $\skew3\bar{B}$ and C components. Most of the texture components lie along these fibers. Since the relative intensities of these components are dependent on the symmetry of the test being carried out, in the case of simple shear deformation, which exhibits a two-fold symmetry around the axis perpendicular to both shear plane normal (SPN) and shear direction (SD), the A/$\skew3\bar{A}$, and B/$\skew3\bar{B}$ components have the same intensities. $A_{1}^{*}$ and $A_{2}^{*}$ components exhibit different intensities as they are not symmetric to the two fold symmetry operation of the SPN and SD. C components are self-symmetric.
2.1.2 BCC materialsThe ideal orientations formed during simple shear deformation of BCC materials were first calculated by Montheillet and Jonas.1) During ECAP of BCC materials, the most commonly observed fibers are {110} ∥ SP containing the ideal components F, J, $\skew3\bar{J}$, E and $\skew3\bar{E}$, and ⟨111⟩ ∥ SD containing the ideal components D1, D2, E and $\skew3\bar{E}$.2) Additionally two more ideal orientations were also reported which appeared with the activation of slip on the {123} family of planes.3)
2.1.3 HCP materialsThe ideal orientations formed in HCP materials with near ideal c/a ratio are fibers B with {0001} ∥ SP (basal fiber) and P ⟨11.0⟩ ∥ SD (prismatic fiber), Y, C1 and C2 fibers. However, the stability of the orientation is purely dependent on the c/a ratio of the metal which dictates the relative activation of the slip/twin families. Texture after simple shear deformation is represented in terms of shear direction SD, normal direction (ND) and shear plane normal (SPN) in pole figures (PFs) and inverse pole figures (IPFs).
A point to be mentioned here is that initially the two leading groups, led by Tóth and Tomé have represented ECAP texture components with additional suffix ‘E’ and ‘θ’ added to the shear texture components, respectively. In later years, it was mutually decided to discard these additional “suffix” while representing the ECAP textures in order to bring uniformity of representation.
Equal channel angular pressing (ECAP) is one of the extensively studied SPD processing techniques. In ECAP, specimens with square or a circular cross section are passed through two dies of equal cross-sectional area inclined at an angle, known as inter-channel angle typically ranging from 90°–150°. During consecutive ECAP passes, the sample is re-inserted multiple times with or without a rotation along the longitudinal axis of the billet in-between the passes. The rotation given between consecutive passes along the billet longitudinal axis are 0° in Route A, alternating between ±90° in Route BA, 90° in the same direction in Route BC and 180° in Route C. The deformation and velocity gradient for ECAP processing by the routes mentioned above can be found in an extensive review by Beyerlein and Tóth.4)
Owing to the complexity of deformation path in ECAP, texture varies significantly depending upon crystal structure, stacking fault energies and initial texture. However, in all the processes, textures are unique to the crystal structure. Although ECAP textures have been primarily described as shear textures, the shear plane is identified as the intersection plane of the inlet and exit channels.5) This causes the ideal texture components to rotate about the transverse direction (TD) by an angle of 45° for an ECAP die with inter-channel angle 90°. Further shift occurs along the TD (i.e. φ1) with an increase in the die angle. The die angle has a great influence in the texture formed after each pass. Smaller the die angle, higher is the strain imposed per pass. As a result, rotation of grains to ideal orientations will be faster and the texture should appear stronger.
Besides the die angle, other parameters that affect the texture are the crosshead speed of the punch, friction between the channel and sample, and the application of a back pressure. It has been concluded from flow line analysis that the material flow from top to bottom of the channel is not identical. The material closer to the top surface of the channel undergoes deformation more severely than the one at the bottom.6) Therefore, the texture formed will also be inhomogeneous from top to bottom of the sample.
After the 1st pass, texture evolution depends on the ECAP route.4) The direction of shear is reversed in every alternating pass in route BC and every consecutive pass in route C. In route A, the shear planes meet at an angle of 90° and at an angle of 120° in route BA. The monoclinic sample symmetry is lost after the 1st pass when the material is processed by routes BA and BC, while it is geometrically maintained when processed in routes A and C since the shear plane remains on the texture-symmetry-axis of the process.7)
A noteworthy observation in most of the work pertaining to ECAP texture is that, there is always a systematic deviation of experimentally measured texture component from their expected ideal location.5,8,9) This is primarily attributed to the mechanics of the process which involves additional deformation modes operative during the process, in addition to the primary deformation mode as simple shear. A list of texture components that evolve during ECAP is given in Table 2.
In FCC materials, the components of texture developed after ECAP are dependent on the deformation mechanism, which in turn depends on stacking fault energy. Although similar pattern in texture evolution is observed in most of the FCC materials, the key difference manifests in terms of the relative intensities of the components which arise out of the differences in the stacking fault energies of the different materials. In the following sections, texture evolution has been discussed for materials with each of the specified range of stacking fault energy, for example, Al and Ni, the high SFE metals (∼160 and ∼128 mJ/m2, respectively), Cu, a medium SFE metal (∼78 mJ/m2) and Ag, a low SFE metal (∼22 mJ/m2).10)
The most complete study on ECAP texture in aluminium is due to Suwas et al.,11,12) who investigated textures formed as function of processing routes as well as number of passes (Fig. 2). The strong cube texture of the initial material prevailed after one pass, and the presence of cube texture components was clearly seen along ⟨001⟩ ∥ TD fiber. The ODF plots revealed very weak intensity along $A_{1}^{*}$ and C texture components, while the other components, A/$\skew3\bar{A}$ and B/$\skew3\bar{B}$, were yet to form. The characteristic texture for the ECAP route developed from the second pass. Further passes led to a change in the relative intensities and a slight deviation in the position of the maxima of the texture components. In routes A and C, the strongest texture components were $A_{1}^{*}$, and C, respectively, whereas B/$\skew3\bar{B}$ component was strong in route BC. Also, when deformed through route A, texture started weakening with subsequent passes, in route BC it strengthened continuously, in route C, the relative intensities of texture components oscillated. With each pass, the influence of initial texture diminished, a phenomena observed in all the ECAP routes.11–15)
Texture evolution during ECAP processing of Al as a function of processing routes.12)
With decreasing SFE from Al to Ni9,16) to Cu,5,6,8,17) it was observed that for there was a change from the dominance of C component to B/$\skew3\bar{B}$ components when deformed by route A. In Ni, intensity of the C component was the highest, followed by $A_{1}^{*}$ and B/$\skew3\bar{B}$ having nearly equal intensities.14) In Cu, the $A_{1}^{*}$ component has the highest intensity, followed by the C component and then the B/$\skew3\bar{B}$ components.6) The development of texture as a function of SFE is shown in Fig. 3. Texture development in Cu via different processing routes is shown in Fig. 4. Interestingly, in the case of copper, Suwas et al.8) investigated the effect of material purity on the texture evolution and found that the volume fraction of texture components was dependent on the material variables like impurity content and starting microstructures. The Cu alloy, Cu–0.3%Cr, which has SFE close to pure Cu, exhibits strong B/$\skew3\bar{B}$ components when deformed by route A and a strong $A_{1}^{*}$ component with some amount of B/$\skew3\bar{B}$ components when deformed by route BC.18)

Variation in texture evolution during ECAP processing of FCC materials like (a) Al, (b) Cu and (c) Ag as a function of SFE.19)

Texture evolution during ECAP processing of Cu as a function of processing routes (Unpublished).
In the case of Ag, texture was dominated by the B/$\skew3\bar{B}$ components, which was attributed to twinning as a result of its low SFE19) (Fig. 3). After the 1st pass, Ag exhibited texture strengthening when deformed in subsequent passes by route A. The B/$\skew3\bar{B}$ components strengthened at the expense of $A_{2}^{*}$ component. The $A_{1}^{*}$ component remained weak but stable, even up to 3 passes. Microscopic observations confirmed that twinning was an active mode of deformation even in the third pass.20–22)
Skrotzki et al. investigated the dependence of texture evolution on starting textures of another low SFE Al–Mg alloy, AA5109.23) Starting with a strong cube texture, the material showed overall texture weakening after the 1st pass, with the evolution of texture components C, $A_{1}^{*}$, B/$\skew3\bar{B}$, A and $A_{2}^{*}$, in decreasing order of relative intensities. On the other hand, with a starting rotated cube texture, after the 1st pass, a rather strong texture formed with $A_{2}^{*}$, $A_{1}^{*}$, B/$\skew3\bar{B}$, A and C components, in decreasing order of relative intensities. With increase in the number of passes, the effect of starting texture diminished completely. After 3rd pass, the B/$\skew3\bar{B}$ components were the strongest, a characteristic signature of low SFE material.23)
Studies were also carried out to investigate the evolution of ECAP textures in engineering alloys of aluminium, namely the Al–Cu alloy (AA2014)24,25) and it was revealed that the evolution of texture was strongly dependent on the starting microstructures and processing routes. The starting material in aged condition developed weaker textures compared to the solution treated samples, after 5 passes of ECAP, which was attributed to higher scattering of strain during deformation by the fine precipitates in the aged samples.25) This study also reported that ECAP by route A led to the strongest textures and highest heterogeneity from top to bottom of the sample. The weakest texture and lowest heterogeneity was observed post deformation by route C as a result of reversed strain path. Texture evolution during deformation via routes BA and BC were found to be nearly similar. On an average, textures measured at the mid plane of ECAP billets, showed that the components B/$\skew3\bar{B}$ and $A_{1}^{*}$ showed the highest intensities when deformed by routes A, BA and BC, while $A_{2}^{*}$ and C components showed highest intensities when deformed by route C.24) In another Al alloy AA2195, Suresh et al.26) observed that up to 3rd pass by route A, the components $A_{1}^{*}$, $A_{2}^{*}$, and B/$\skew3\bar{B}$ exhibited highest intensities while after the 4th pass $A_{2}^{*}$ and C components exhibited highest intensities.
Skrotzki et al. have extensively studied the heterogeneity of ECAP textures in Al, Ni, Cu and Ag6,14,16,17,22,27) (Fig. 5). While most of these studies were carried out on samples processed through route A, the samples processed by route BC also led to texture gradient along the transverse direction, in addition to gradient from top to bottom. In this case, the components B and $\skew3\bar{B}$, display opposite trends with B component increasing in intensity from left to right, half way from the top and $\skew3\bar{B}$ exhibiting the exact opposite trend.27)

Texture gradient measured by synchrotron radiation after 1 ECAP pass of Cu as a function of distance from top of the billet.27)
To summarise, ECAP textures of FCC materials have been found to be strongly dependent on stacking fault energy, initial texture, processing route, number of passes and distance from top to bottom of the sample. With decrease in stacking fault energy, the strengthening of the B/$\skew3\bar{B}$ components occur either due to a propensity for twinning or hindrance in the slip activity due to the presence of precipitates. The effect of initial texture diminishes with increase in number of passes. Evolution of texture by route C is strongly dependent on the number of passes, while in routes A and BA/BC texture strengthening and weakening occurs, respectively. Lastly, the severity of texture is a function of its distance from top to bottom of the sample with strongest texture at the top. There is a shift in the location of texture components from top to bottom, from the corresponding ideal locations of shear textures.
3.1.2 Texture evolution in ECAP processed BCC materialsA few BCC metals and alloys have been investigated for texture evolution during ECAP.2,28–31) The early studies due to Li et al.2,28) showed a good agreement of ECAP texture with the ideal simple shear texture for BCC materials.1) Li et al. observed the presence of partial ⟨111⟩-fiber and {110}-fiber rotated about TD by 45°, which was further corroborated by Bhowmik et al. for IF steels.3) After the 1st pass, the material exhibited strong texture with {112}⟨111⟩ components. Rotation of the ED-ND plane by 45° in counter clock-wise (CCW) direction about the TD axis gave rise to this texture with the components D1 and D2. The formation of J and F components take place by the alignment of ⟨112⟩ and ⟨001⟩ directions along the shear direction, respectively, on the {110} planes which align along the shear plane.3) Additionally this paper also reported two new ideal positions – R1 and R2 formed by slip on the (123) planes. These components were observed after the 4th pass by routes A and BC.3) In general, the coincidence of slip plane or direction or both with the macroscopic shear plane and direction of the sample was observed in most cases when deformed by both the routes. Figure 6 shows texture evolution in IF steels processed through routes A and BC of ECAP.

Texture evolution during ECAP processing of IF steel after 1 pass, and after 2 and 4 passes via processing routes: A and BC.3)
As mentioned earlier, the mode of deformation in HCP materials is dictated primarily by c/a ratio. Mg and Co have their c/a close to ideal, as theoretically predicted for a close packed HCP structure (∼1.633). In materials with higher c/a ratio, deformation is only accommodated by slip on the basal plane and twinning, whereas with lower than ideal c/a ratio, it is possible to activate slip on other planes also in addition to basal slip and twinning.32) In the following sections, texture evolution in HCP materials with different c/a ratio has been discussed.
3.1 3.1.3.1 Texture evolution in materials with near ideal c/a ratioMagnesium and its alloys are the most investigated materials in this category. The comprehensive study by Beausir et al. on texture evolution during ECAP of Mg with strong basal fiber texture showed the formation of different final textures when processing through routes A, BC and C33) (Fig. 7). Texture after the 1st pass consists of a weak B fiber formed by rotation of initial orientations by about 105° in the clockwise direction around TD. It was also observed that when the textures were rotated by +90° before reinsertion of the sample for the second pass, the texture appeared very similar to the undeformed sample with just a small tilt of −15° along the TD axis of the sample. The same observation was made in the texture evolution after each pass in route A. This phenomenon was attributed to rotation of the sample by 90° before reinsertion in the real space. Thus, the second pass onwards, the rotation of textures before reinsertion positions the textures to that of the initial sample. Biswas et al. also reported a constant formation of the B fiber on ECAP of pure Mg by route A upto 8 passes34) and that with an increase in the deformation temperature, the activity of the pyramidal ⟨c + a⟩ II type slip system increased, resulting in the appearance of C2 fiber along with B fiber.35)

In route BC too, formation of B fiber texture was observed. This B fiber forms at a position which is 20° rotated in the clockwise direction position around the simple shear direction axis. In route C, similar B fiber texture formed, with the only difference being a split in the fiber from the 3rd pass onwards, which is best visible in (0002) pole figure. The findings were consistent with studies carried out later.36)
Studies have also been carried out on effect of alloying additions on the texture evolution during ECAP of Mg alloys such as AZ31, AZ80, ZK60, WE43, Mg4L.37–40) Based on these studies it could be inferred that deformation of the AZ group of alloys took place predominantly by basal slip with a low activity of non-basal ⟨a⟩ and ⟨c + a⟩ slip, and the B fibers showed an inclination of ∼55° to the ED. For the ZK and WE group of alloys B fiber aligned along ND, caused by a higher activity of non-basal ⟨c + a⟩ slip systems in conjunction with basal slip. Mg–Li alloys too develop similar textures with basal fiber aligned along ND, but do so because of higher activity of prismatic ⟨a⟩ slip.
3.2 3.1.3.2 Texture evolution in materials with c/a < 1.633Studies carried out on ECAP processed Ti, showed that after the 1st pass, texture resembled the characteristic simple shear textures of HCP materials (Fig. 7). A small deviation of 5° away from the ideal position was noticed. It was also observed that the basal poles tend to align in orientations between the normal direction (ND) and shear plane normal (SPN) direction.41,42) This was clearly different from the case of Mg, where the B fiber aligned along the SPN. Texture formed in subsequent passes in route A exhibit a similar trend observed in the case of Mg. In another study with the same die geometry by Jager et al.,43) the texture formed after 4th pass of ECAP by route A corroborated the results of this investigation. The only difference was due to the application of a back pressure between 270 and 590 MPa. The textures developed were found to be almost similar to those reported in a previous study by Beyerlein et al. on the texture development in pure Be processed through routes A and C of ECAP for 2 passes.44) They had previously reported that the textures developed in Be were tilted by ∼15° after 1st and 2nd pass of ECAP by route A. Yapici et al. reported similar trend in texture evolution for pure Be, Zr, and alloys Ti64 and AZ31, which leads to the conclusion that the trend of evolution of ECAP texture is more or less similar for all HCP metals with c/a ratio <1.633.45)
Route BC leads to the formation of more complex textures. Texture after two and three passes in route BC are distinguished from simple shear texture owing to non-centrosymmetric deformation geometry. Twins formed at the beginning of the 2nd pass were attributed to the reorientation of the untwinned grains to an orientation favourable for twinning due to the rotation of the sample before reinsertion.41,42) After 2nd and 3rd passes, lack of twinning activity was clearly noticed. It was also interesting to note that in a study by Sun et al.,46) using ECAP dies with inter-channel angles 120° and 20°, the grains of starting material with a strong (0002) ⊥ RD texture, rotated to orientations close to ND, RD and TD after 1st, 2nd and 4th pass, respectively. Absence of a stable orientation was clearly observed.46) As mentioned earlier, any change in die angle only contributes to a shift in the position of the ideal shear component. A curvature between the die channels, introduces an additional shear plane into the ECAP die. Therefore, the difference observed in this study was because of the change in die geometry and also the initial texture.
In route C, the 2nd pass texture resembled the 1st pass texture even though the shear plane and direction are completely complementary to each other in the two passes. It was also observed that the basal planes showed a tendency to stabilise at orientations ∼40° away from the ED. Another striking feature of route C ECAP in Ti was the unusually high lattice rotations, ∼160°, in a single pass.41,42) Beyerlein et al. had found that the 2nd pass ECAP textures by Route C showed a ∼35° tilt of the basal poles away from ND. Also the maxima of the basal poles were more diffuse in route C than that in route A, which could be attributed to the higher activity of basal slip in route C (∼80%) than in route A (∼70%).44)
3.3 3.1.3.3 Texture evolution in materials with c/a > 1.633ECAP textures of HCP materials with a c/a ratio greater than ideal has not been studied extensively because of their limited application. The paper due to Bednarczyk et al.47) reported texture evolution in single phase Zn alloy, Zn–0.5Cu. The samples were subjected to 4 passes of ECAP in a 90° die by route BC, and the resulting texture was characterized by the presence of prismatic – P and pyramidal ⟨a⟩ - Y fibers with a deviation of ∼15° from the ideal orientation.
To summarize, it was observed that after ECAP processing, a basal B fiber texture formed in materials with c/a ratios close to and lower than ideal, while formation of prismatic P and pyramidal Y fiber textures were observed in hcp materials with c/a ratio greater than ideal. It was also observed in both Mg and Ti that multi-pass ECAP by route C led to the formation of a split basal fiber texture.
3.2 High pressure torsion (HPT)High pressure torsion is the perhaps the oldest SPD processing technique.48) This technique has been used extensively over the last couple of decades owing to the possibility of subjecting the material to extremely high amount of strains. Some review papers on the mechanics of HPT, and the physical and mechanical responses of the material after processing by HPT can be easily found.49,50) Texture evolution during HPT of different types of materials is discussed in the following sub-sections.
3.2.1 Texture evolution in HPT processed FCC materialsTextures developed after HPT of FCC materials very closely resemble the simple shear textures as shown for the case of high purity Cu in Fig. 8.51) Naghdy et al.52) reported that commercially pure recrystallized aluminium exhibited simple shear type texture after being subjected to HPT to a strain of only 0.75, however without the characteristic monoclinic symmetry. Symmetrically equivalent components, such as B/$\skew3\bar{B}$ and A/$\skew3\bar{A}$, showed different relative intensities, which was attributed to the domination of texture weakening effect resulting from grain fragmentation and rotation over the texture strengthening. At higher strains, texture weakening further dominates. With increasing strains, γ > 4.0, continuous strengthening of the C and B components was observed at the expense of rotation of grains away from $A_{1}^{*}$ and $A_{2}^{*}$ ideal positions.52) Korneva et al. studied texture evolution in a Cu–Cr alloy under HPT after annealing at 550°C/1000°C and found that the position and maxima of shear components are nearly identical in both the samples.53) The position of texture components was deviated from the ideal simple shear texture components by a small angle along φ1. Similar texture evolution was observed in Cu phase of a nanolayered Cu–Nb composite post HPT.54) Study on HPT processed pure Al57) indicated texture evolution from $A_{1}^{*}$, $A_{2}^{*}$ to C components up to a strain of 4, followed by an overall texture weaking. Pure Ni58) too shows a strengthening of C and B/$\skew3\bar{B}$ components, similar to pure Cu and 70/30 Brass.
The study by Skrotzki et al. on a randomly textured nanocrystalline Pd–10 at%Au sample, also showed the pronounced dominance of B/$\skew3\bar{B}$ components, which attained a maximum relative intensity at a shear strain of ∼6 and texture evolution got saturated.55) Weak $A_{2}^{*}$ and C components were also observed beyond this deformation level. Another important observation in this study was the shifting of all the texture components along φ1 by ∼10°. The mechanism of formation of strong B fiber was attributed to an easier ⟨112⟩ slip, which was found from texture simulations using Taylor model.
Among the low SFE FCC materials, the most notable study is due to Skrotzki et al.,56) who investigated texture evolution in HPT processed high-entropy alloy CrMnFeCoNi up to shear strain ∼170. A weak, yet a characteristic shear type texture with dominant B/$\overline{\text{B}}$ components was observed, which was attributed to deformation mainly by partial dislocation slip accompanied by twinning and grain boundary sliding.
3.2.2 Texture evolution in HPT processed BCC materialsRelatively fewer studies have been performed on texture evolution during HPT of BCC materials. Zhao et al. studied the texture of HPT compacted Fe powder.59,60) The [110] pole figures showed the strengthening of BCC texture components with increase in deformation, i.e., transition from top to bottom surface of the sample. A strengthening of typical simple shear texture components of BCC materials was exhibited from the undeformed to transition to severely deformed zones. Texture evolved in the severely deformed zone is shown in Fig. 8. The texture however, manifested a significant rotation of nearly 10° from the ideal positions of texture components and also a noteworthy deviation from its centro-symmetric peaks. Another observation was the non-uniform development the shear texture components; the relative intensities of texture components in decreasing order were J/$\skew3\bar{J}$, D1/D2 and F. The E/$\skew3\bar{E}$ components showed a relative weaker intensity.59)
Huang et al.61) and Renk et al.62) reported the texture evolution of pure vanadium and tantalum, respectively, when subjected to HPT. They found that after subjecting the sample to a rotation of 180°, the material exhibited a ⟨212⟩ ∥ ND fiber near the center and ⟨101⟩ ∥ ND texture near the edge. However, upon subjecting the material to 10 turns, a homogeneous texture ⟨101⟩ ∥ ND was observed. This was attributed to the occurrence of slip on the (110) planes of BCC materials. It was also observed that Ta developed strongest shear texture when processed at room temperature followed by annealing. Other BCC materials such as Nb63) and β-Ti64–66) have been subjected to HPT, but texture evolution has not been studied.
3.2.3 Texture evolution in HPT processed cubic intermetallicsStudies have also been done on various other alloys having a cubic based structure, such as Ni50Mn29Ga21 magnetic SMA,67) NiAl and YCu intermetallics having a B2 structure and TiAl intermetallic having an L12 structure.68,69) Chulist et al. reported the appearance of strong oblique cube component (001)⟨100⟩ and a weak (110)⟨001⟩ F component. In NiAl, YCu and TiAl intermetallics also, the oblique cube component formed in addition to weak shear texture components. All the texture components were found to be slightly deviated from their ideal positions. Except for TiAl, the relative strength of texture components weaken with an increase in deformation temperature while that of the cube component strengthens. This strengthening of oblique cube component was attributed to the occurrence of discontinuous dynamic recrystallization. In TiAl, neither did the texture strengthened, nor did it exhibit any clear trend in the volume fraction of components with varying temperatures.69) Overall, all the intermetallics showed a tendency of forming oblique cube component.
3.2.4 Texture evolution in HPT processed HCP materials 4.1 3.2.4.1 Texture evolution in materials with c/a ratio close to idealMost of the studies in this category of HCP materials have been carried out on Mg. Bonarski et al. studied the texture evolution during HPT under the application of different hydrostatic pressures,70) and found that under all conditions, a B fibre formed post HPT. However, higher hydrostatic pressures led to a corresponding decrease in texture intensity and also introduced deviation from the ideal position of the B fiber. Torbati-sarraf et al. studied the texture evolution during HPT in a ZK60 Mg alloy71) having an initial texture with strong intensity of basal poles aligned perpendicular to the extrusion axis, a texture termed as “cylindrical texture”, a typical extrusion texture of HCP materials.32) The basal poles reoriented to align along ND after 5 rotations, while the prismatic and pyramidal poles aligned perpendicular to ND.71,72) Texture developed in Mg after a shear strain of ∼55 under 4 GPa pressure is shown in Fig. 8.
4.2 3.2.4.2 Texture evolution in materials with c/a ratio <1.633Extensive studies have been carried out on HPT of Ti and its alloys. However, most of these were aimed at studying phase transitions in CP-Ti73,74) and Ti alloys like Ti–Fe, Ti–Nb, Ti–Mo and Ti–Co.75–79) Out of a few published literature on texture evolution, the most complete study is due to Kilmametov et al., who reported that in α-Ti phase, HPT processing led to the formation of B fiber with their position slightly away from ND.75) Formation of P1 fiber was also revealed in the ω-Ti phase.
4.3 3.2.4.3 Texture evolution in materials with c/a ratio >1.633Unlike in the case of ECAP, there are quite a few studies carried out in HCP materials with a c/a ratio greater than ideal. These studies have mostly been carried out at room temperature with a few reports also available on HPT at cryogenic as well as high temperature.63,80–82) This was possible because of high hydrostatic pressure associated with the HPT. Srinivasarao et al. studied texture evolution in CP Zn and found that under pure compression, a weak split basal texture parallel to ND formed. However, with increase in the number of rotations, the maximum intensity of basal poles along ND increased. In fact, a proportional increase in the volume fraction of basal fiber with deformation was noticed.82)
3.3 Friction stir processing (FSP)Friction stir processing is a relatively new SPD technique, originating from friction stir welding, wherein a material is subjected to intense localized plastic deformation to yield a UFG microstructure.83) The details of the process can be found in Ref. 84. The biggest advantage of this technique is the spatial tailoring of microstructure and texture in the sample by optimising the processing parameters, such as the tool rotating and traversing speeds.85) The process is associated by intense shear deformation, hence develops characteristic shear textures. Textures in FSP materials are measured with respect to the working direction (WD), normal direction (ND) and transverse direction (TD).
3.3.1 Texture evolution in FSP processed FCC materialsStudies carried out on texture evolution during FSP of Al alloys86–90) have shown that the nugget zone exhibits typical shear textures of FCC materials. Field et al. reported that in the Al alloys 1100, 6061 and C485, the material on the top surface of the plate and adjacent to the FSP tool shoulder, had texture characteristic of shear deformation, whereas texture of the material below the tool displayed the characteristic texture for uniaxial deformation. A strong ⟨111⟩ A fiber was present in the shearing region of the weldment, whereas ⟨100⟩ fiber was observed in the region compressed under the FSP tool.91) Strong ⟨111⟩ ∥ ND fiber prevailed even in the mid-plane of the weld nugget. The study also revealed that in the material under the tool pin, partial A fiber forms. Similar textures were observed in 7xxx series of Al alloys.92,93) However, in the presence of reinforcements in the matrix, textures formed after FSP appear more diffuse because of the hindrance the reinforcement caused to the material flow. In another study on Al–Mg alloy by Suresh et al.,94) it was observed that the nugget region tended to exhibit strong $(111)[1\skew3\bar{\textit{2}}1]$ and (011)[100] texture components, which were analogous to simple shear texture components in FCC materials. In the thermo-mechanically affected zone (TMAZ), strong $(111)[1\skew3\bar{\textit{1}}0]$ and $(112)[11\skew3\bar{\textit{1}}]$ texture components were observed with the recrystallized part of TMAZ showing orientations close to $(011)[23\skew3\bar{\textit{3}}]$.94) Nadammal et al. also reported the formation of a predominant component C in the shear texture near to the top surface of the nugget zone and strong B/$\skew3\bar{B}$ and $A_{2}^{*}$ components towards the middle of the nugget zone in the Al alloys 2024 and 221986,89) (Fig. 9). In the Al–Mg alloy 5086, the C component was found to have the highest intensity owing to static annealing after the deformation.86) In multi-pass FSP, the Al alloy 2024 exhibited a strong C component, a texture characteristic of high temperature-high strain deformation.88) Apart from Al, HSLA steel was investigated for the evolution texture post FSP, where it was observed that the material flow during FSP occurred in the high temperature austenite phase. This resulted in the formation of ideal shear components of FCC materials, which gave rise to a BCC transformation texture that followed a Kurdjomov-Sachs (KS) orientation relationship84) (Fig. 9).

To conclude, textures formed in FCC materials post FSP, were found to be similar to torsion, ECAP and HPT textures. The cube component strengthened in Al and its alloys. While B/$\skew3\bar{B}$ components showed strengthening with a decrease in SFE. The positions of texture components coincided with ideal simple shear orientations of FCC materials.
3.3.2 Texture evolution in FSP processed BCC materialsVarious reports are found on the FSP of BCC materials. Some of them include FSP of a near - β alloy Ti-5111 by Kipling et al.,95) and FSW of Al-steel joints by Patterson et al.96) The material was deformed in the high temperature BCC phase due to the heat generated during FSP, and hence the D2 $(\skew3\bar{\textit{1}\skew3\bar{\textit{1}}}2)[111]$ shear component of the high temperature BCC phase must have formed as a result, because upon cooling the (0002) basal poles aligned perpendicular to the direction of shear with a 35° tilt from ND.
3.3.3 Texture evolution in FSP processed HCP materialsBahl et al. have studied the texture evolution in cp-Ti post FSP and observed the formation of two distinct texture components:- one with the basal poled tilted by 5° from ND and the other tilted by 38° from ND in the sample processed using 600 rpm (Fig. 9). The volume fraction of basal poles in this condition was ∼6%. When the rpm was increased to 1250, the sample showed the weakest texture with the volume fraction of the basal poles as 4%.97) Young et al. studied the FSP textures of the Mg alloy AZ31 and observed that a strong basal peak formed at a tilt of ∼45° from the processing direction. However, similar to Bahl et al., they too observed that with increase in the deformation rate, there appeared a decrease in the texture strength.98,99)
Accumulative roll bonding (ARB) is an SPD processing technique that does not require any specially designed die or heavy load cells for acquiring heavy forming loads. Instead, ARB can be performed using a conventional rolling mill. The process was invented for severe plastic deformation by Tsuji and his co-workers.100,101) The final product after ARB is in the form of rolled sheets with UFG microstructure. It is most common to carry out ARB at room temperature due to the ease of operation. However, high temperature ARB processing is also practiced. Milner et al.102) assumed that there was no significant drop from the starting temperature as the samples were very thin, transferred very rapidly from furnace to the rolling mill (≤2 s) and deformed at high strain rates (20 s−1).
The evolution of texture during ARB has been well established and was found to be inhomogeneous throughout the sample thickness.103,104) The texture components have been generally described in terms of rolling texture components. However, there exist subtle differences between rolling and ARB textures.
4.1.1 Texture evolution in ARB processed FCC materialsStudies on ARB of pure Al up to 8 passes by Huang et al.105,106) revealed the weakening of texture with increase in number of passes. Locally, most lamella was characterised by typical rolling texture components.105) Chekhonin et al.107) carried out texture investigations on ARB processing of high purity and commercial purity (CP) Al laminates. They observed that the CP-Al layers preferentially exhibitted orientations close to S, Cu and Bs, while the high purity Al layers exhibit orientations close to Cube and Rotated Goss. Studies on ARB of aluminium alloys by Roy et al. showed that after subjecting two Al alloys, AA5086, AA2219 to 8 pass ARB, the intensities of the texture components in decreasing order are: Bs, S, Dillamore, Cube, Cu and Goss.108–110) Nearly similar observations were made in other studies on Al alloys, for example, like Al–0.2%Sc,111) AA6016 and AA1050112) (Fig. 10). The primary difference between the textures formed in Al and Al alloys was that in the alloys, the strength of the Cu component was the highest111) and the components exhibited a higher orientation spread from the ideal positions.107,112–117) Dominance of rolling texture components was observed during ARB of pure Ni by Bhattacharjee et al.,118) with the strength of components in decreasing order S → Cu → Bs followed by weak intensities of Goss, Cube and RD-rotated cube. In copper, studies by Takata et al.119) and Suresh et al.103) have shown that though the textures at the surface and the center are qualitatively similar, showing components like S, Cu, Bs, Goss, cube, and RD-rotated cube, their relative intensities at both the sample locations are different. They found that near to the surface, a strong cube texture formed, with S and Bs orientations being second strongest and Cu being the weakest orientation. On the contrary, in the center of the sample, the deformation texture components were relatively weaker. It exhibited a strong cube component with a nearly continuous γ-fiber with Bs and Goss components showing similar volume fractions. The higher intensities of S, Cu and Bs was attributed to continuous recrystallization (CRX), which retains the deformation texture components. The high amount of Bs component, as against Cu, was observed because of imposing large amount of shear. The higher volume fractions of cube and RD-rotated cube components were observed due to discontinuous recrystallization (DRX) during inter-pass annealing.103)

Other studies were carried out on FCC-BCC nano-lammelar composites, such as the Cu/Nb composites, processed via ARB, which have captured the texture evolution in each phase.120–129) Carpenter et al. observed that in the Cu phase, when the thickness of each layer remained above the nanoscale regime, the C component in rolled FCC materials remained dominant.122) On the other hand, when the thickness of the layer reduced to <50 nm, the C orientation weakened with a strengthening of the S component. At layer thickness below 20 nm, the S component retained its strength with a simultaneous formation of Goss component. However, in this case, the formation of Goss component was not attributed to the recrystallization associated with nucleation of strain free grains along shear bands. The absence of the Q orientation, which usually appears with the Goss component during recrystallization, confirmed that the material manifested the Goss orientation without any recrystallization.122) The Q orientation, {013}⟨231⟩ at the Euler angles (45°, 15°, 10°), appears alongside the Goss component during recrystallization because of a shared 40° ⟨111⟩ orientation relationship to the initial rolling texture.130)
To summarize, except for pure Al, all other pure FCC metals showed a general tendency of forming rolling texture components when subjected to ARB processing at room temperature. With an increase in the temperature of ARB, recrystallization textures formed. Similar observations were made in the FCC phase of multi-layered composites with S orientation generally having the highest volume fraction.
4.1.2 Texture evolution in ARB processed BCC materialsOne of the first works on ARB of IF steels was done by Tsuji et al.,131) where they found signatures of both deformed and recrystallized textures in the ARB processed material. They also found that region near the thickness center revealed a ⟨110⟩ ∥ RD texture, similar to the rolling texture, while shear textures dominated near to the sample surface. Jamaati too studied ARB of IF steels, where the initial sample comprised of a strong γ-fiber component.104) Domination of shear texture over rolling texture was observed after the 1st pass. A relatively strong ζ-fiber and weak α-fiber and γ-fiber was observed. Second pass onwards, rolling textures dominated. The ζ-fiber did not exhibit any trend with increase in straining, but showed a transition from {011}⟨211⟩ to {011}⟨100⟩ after the 1st pass and a transition back to {011}⟨211⟩ from {011}⟨100⟩ after the 3rd pass. The α-fiber remained weak all throughout. The sharp weakening of the γ-fiber was observed to change after the 2nd pass, wherein its relative intensity increased slightly upon further straining. A strong ε-fiber formed after the 1st pass but then disappeared after subsequent passes. The η-fiber, exhibited a trend opposite to that of the γ-fiber; it first increased sharply and then decreased. Slight strengthening of the θ-fiber was observed 2nd pass onwards.104) However, with an increase in the number of passes, a saturation was reached in the intensities of both shear and rolling texture components.
Several studies have also reported the evolution of ARB textures in the BCC phase in FCC-BCC120–129) and HCP-BCC nanolammelar composites.127,132–134) Ardeljan et al. reported the textures developed in the Nb phase of an ARB processed Zr/Nb layered composite.134) They observed that the Nb phase within the composite showed strong ⟨110⟩ α-fiber and ⟨111⟩ γ-fiber with strong relative intensities along {001}⟨110⟩ and {111}⟨110⟩, respectively (Fig. 10). Knezevic et al. found that the texture in Nb phase of Zr–Nb sheets developed by the simultaneous activity of (110) and (112) slip systems.133) Small intensities were also observed by Carpenter et al. on the {001}, {113} and {334} orientations when layer thickness remained above 1.5 µm. However, post rolling down to 92 nm layer thickness, they observed a strong α-fiber with minor intensity peaks at $\{ 115\} \langle 1\skew3\bar{\textit{1}}0\rangle $ and $\{ 334\} \langle 1\skew3\bar{\textit{1}}0\rangle $.132) Hansen et al. studied and modelled the texture evolution in Cu/Nb laminates after a single pass of ARB with a reduction in layer thickness from 24 to 12 µm.121) The Nb phase manifested a texture similar to the one reported by Knezevic et al. for a Zr/Nb system.133) A completely different texture was observed in the Nb phase in Cu/Nb composite system when the thickness was reduced to the nanoscale regime. It was observed that when the layer thickness of Nb reduced below 30 nm, the ⟨111⟩ ∥ ND texture was replaced by a texture with ⟨110⟩ ∥ RD fiber being the strongest, ⟨111⟩ ∥ TD fiber being the second strongest and ⟨111⟩ ∥ ND and ⟨112⟩ ∥ ND fibers being the weakest.120,123,128) This texture was attributed to the activation of deformation twinning which gives rise to {112}Cu ∥ {112}Nb interface and remains stable under severe plastic deformation.128) Han et al. have studied that this interface follows a Kurdjomov-Sachs orientation relationship,135) with $\{ 112\} \langle 111\rangle _{\text{Cu}}\parallel \{ 112\} \langle 1\skew3\bar{\textit{1}}0\rangle _{\text{Nb}}$ being the predominant variant of the twin interface due to its lowest interfacial energy (γ = ∼825 mJ/m2).120)
In summary, it was observed that the gradient texture which develops through the sample thickness post ARB processing was characterised by a simple shear BCC textures near the surface and rolling textures near the mid-sections. Domination by ⟨110⟩ ∥ RD rolling texture components is observed with the exception of FCC-BCC composite systems in the nanoscale regime, where the interfacial energy controls texture evolution.
4.1.3 Texture evolution in ARB processed HCP materialsAs mentioned earlier, Ardeljan et al.134) also reported the textures developed in the Zr phase of an ARB processed Zr/Nb layered composite. They found that with increasing number of passes, the initial split rolling textures of Zr was retained remarkably. Zr exhibited a strong (0002) basal texture component with a 30–50° tilt away from ND towards TD.134) Schwarz et al. studied the texture evolution during ARB of twin-roll cast (TRC) and heat treated twin-roll (TRC + HT) cast Mg alloy AM20 (Fig. 10). Both the materials exhibited a strong (0002) basal texture post ARB processing. The relative intensity of basal component in both the materials increased with increasing number of passes. However, ARB of TRC samples developed a noticeable split basal texture along RD, while the split basal texture of the ARB processed TRC + HT samples was inconspicuous. This split basal texture was attributed to the activation of ⟨c + a⟩ pyramidal slip.136) Similar observations in Zr were made by Carpenter et al.,132) who carried out ARB processing of Zr–Nb sheets, where the Zr phase developed a split basal texture along RD.132) Knezevic et al. revealed that in Zr, large-strain deformation is accommodated by the simultaneous activation of prismatic, basal and pyramidal slip.133) This texture is characteristic of rolling textures of HCP materials having a c/a ratio less than ideal.
4.2 Multi-axial forging (MAF)Multi-axial forging is perhaps the easiest of all the SPD techniques in terms of die design and processing owing to the wide range of processing temperatures (0.1–0.7 Tm). It is a plane strain deformation process, owing to the constraints imposed by the die. The process is also called multi-axial compression, either as a synonym or as a variant. The samples to be deformed are always square cross-sectioned billets having dimensional ratios of either x:y:z = 1:1:1 or x:y:z = 1:1:2. The samples are then inserted into the MAF die with the longest dimension aligned parallel to the compression direction, and then compressed to half its height. Multi-axial compression (MAC), a variant of MAF, has also been studied in certain cases.137,138) In MAC, no die is used. Instead the sample is compressed sequentially along each axis in a simple forging press. The fundamental difference in MAC and MAF lies in the shape of the shear plane and therefore the strain path during processing. In each pass of MAF, no deformation occurs in one axial direction perpendicular to the compression axis due to constraints imposed by the die. The sample undergoes deformation under plane strain condition during each pass. The sample is then rotated to realign the longest dimension parallel to the forging direction (FD). Similarly, deformation is carried out by repeated compression in the x, y and z directions, which comprises of one cycle. The true strain experienced by the sample in each press is ∼0.8. Thus, the accumulated true strain imparted to the sample after one cycle is about 2.4. Despite the large strain imparted, the homogeneity of the strain within the sample is lower compared to ECAP and HPT.
Textures evolved during MAF are usually compared to those of rolling textures. Due to the rotation of the sample for aligning the three orthogonal axis along the compression/forging direction, the macroscopic strain path induced in each pass (comprising of three presses), is different from the center of the sample to the surface. As a result, textures developed in MAF are quite different from those in other SPD processing.
4.2.1 Texture evolution in MAF processed FCC materialsIn spite of a number of investigations carried out on MAF/MAC of various FCC materials such as Al alloys, Cu alloys and Ni alloys, the evolution of texture during the process has been scarcely documented. Moghaddam et al.139) found that MAF of 7075 Al–Zn alloy led to the strengthening of Goss and Cube texture components. Formation of Goss and cube components was also observed in a 2024 Al–Cu–Mg alloy.140–142) In another study by Rao et al.,143) it was observed from an EBSD micrograph that after 9 cycles of MAF processing of a 6061 Al alloy, the final texture was (110) ∥ FD. However, due to absence of data along the other directions, it was not possible to describe the texture completely. The predominance of (110) ∥ FD texture was also reported in another study on MAF of CP-Al by Zhao.137)
4.2.2 Texture evolution in MAF processed BCC materialsStudies by Bhowmik et al.144) and Gurao et al.145) have shown that in the texture of MAF processed IF steels, the intensities were concentrated at particular values of φ1 when measured near to the centre, predominantly having {011}⟨211⟩ and {011}⟨111⟩ components, while near to the surface, (001) fiber along Φ = 0/90° and (111) fibre along Φ = 54.7° in φ2 = 0° and 45° sections were observed. Additionally intensities were found at {110}⟨111⟩ and {110}⟨011⟩ locations as well144,145) (Fig. 11). Then again, observations were made in pearlitic steels deformed via two different routes which gave different major texture components. When β-Ti alloy, with a chemical composition of Ti–10V–3Fe–2Al was subjected to 1 pass MAF, post solution treatment, it was found that a weak (001)[100] cube type texture and $(2\skew3\bar{\textit{1}}2)[\skew3\bar{\textit{3}}24]$ component were formed, whereas, uniaxial compression resulted in the formation of ⟨111⟩ ∥ ND-γ-fiber texture.146) This was observed due to the activation of multiple slip systems, which resulted from the alteration of strain path in each pass, which led to a weakening of texture.147)
4.2.3 Texture evolution in MAF processed HCP materialsA study was done on MAF of magnesium above its recrystallization temperature (T > 100°C). The starting material exhibited an axisymmetric texture as can be seen from the (0002) pole figure where the basal poles occupy the peripheral positions.148) It was observed that MAF led to the evolution of a split basal texture after 2 passes (Fig. 11). After the 1st MAF cycle, a two-fold split basal component was observed along the forging direction in the (0002) pole figure. After the second pass, a four-fold split in the basal components was observed. A gradual weakening of texture was noted in the pole figures indicating that the alteration of compression axis with each pass resulted in the activation of different strain paths.
In general, it was observed that deformation by ECAP lead to texture evolution dominated by processing route. Unlike routes A and C, the absence of a dyad symmetry about TD axis lead to the development of asymmetric textures in all materials deformed by routes BA and BC. Strengthening of texture components was observed in most cases when deformed by route A, while strength of shear components when processed by route C was dependent on the pass number. In FCC metals and alloys, with a decrease in the SFE, a shift from A/$\skew3\bar{A}$ to B/$\skew3\bar{B}$ components was observed. In BCC materials, predominance of D1, D2 and F components was observed. While in HCP materials, strong basal texture was observed in materials having c/a ratio less than and near to ideal, with deviation in fiber position appearing as a function of c/a ratio. In HCP materials with c/a > 1.633 the predominance of prismatic and pyramidal fibers were observed. The shift in texture components away from their ideal orientation position was a function in the internal channel angle of the ECAP die.
In HPT and FSP processing, position of texture components post deformation of all FCC, BCC and HCP materials closely coincided with the torsion textures of the respective materials. In FCC materials, strength of the components was SFE dependent. In HCP materials, texture development was primarily governed by the c/a ratio. The c/a ratio dictates the deformation mode. When basal planes were closely spaced, multiple slip and twinning systems can get activated which yields a B-fiber, whereas, when basal planes are less closely spaced, (the case of materials with c/a > 1.633), only basal and twinning systems are responsible for accommodating the applied deformation, leading to the formation of prismatic and pyramidal fibers.
In ARB and MAF, textures were found to be similar to rolling textures of FCC, BCC and HCP materials. In cases of easier recrystallization, FCC and BCC materials, predominantly exhibit cube textures, whereas, in other cases, rolling texture components are exhibited. HCP materials, reveal a texture analogous to HCP rolling textures with a split basal fiber texture, which is characteristic of the c/a ratio.
In conclusion, it was established that the texture evolution was path dependent, and that the conventional SPD processing techniques gave rise to a texture either similar to simple shear textures or rolling textures. Also, there still appears to be a wide scope for studying texture evolution during MAF of FCC materials, and FSP and MAF of BCC and HCP materials. Texture components formed in various FCC, BCC and HCP materials during various SPD processing techniques are compiled in Table 3.

SS gratefully acknowledges the interactions with Profs. Laszlo Tóth (University of Lorraine, France), Werner Skrotzki (TU Dresden, Germany), Günter Gottstein (RWTH Aachen, Germany), H.-G. Brokmeier (TU Clausthal, Germany), Drs. B. Beausir and J.-J. Fundenberger (University of Lorraine, France). A large part of the SPD work was carried out during the stay of one of the authors (SS) in France and Germany, for which he acknowledges the funding/fellowship from Labex DAMAS, University of Lorraine, France and Alexander von Humboldt Foundation, Germany. The review work was initiated during author’s (SS) stay at TU Dresden as Frederich Wilhem Bessel Research Awardee from Alexander von Humboldt foundation, Germany for which he is grateful to the foundation. The authors would like to thank K.U. Yazar, and R.J. Vikram, their help in manuscript preparation.

