Abstract
A new dual-scale instrumented indentation test (DualS-IIT) methodology is here proposed to determine the yield stress (in a tensile-like sense). The methodology involves measuring the bulk yield radius, as defined by the expansion cavity model (ECM), induced by a Vickers macro-indentation in a medium plane cross-section. The bulk yield radius is measured by means of a subsurface nano-hardness survey along the load direction in correspondence to the transition interface between the hemispherical strain hardened region and the surrounding elastic region. The methodology has been applied to an Al–Li (A2198-T3) alloy and a yield stress of 297 MPa has been measured (in agreement with a tensile test); moreover, anomalous plastic deformation behaviour has appeared under indentation. The combination of macro- and nano-indentation tests in one single experiment, as in the proposed methodology, offers a unique experimental basis to directly correlate the mechanical properties of a material at two different scales, which at present is an open issue in the research on indentation.
1. Introduction
High strength aluminum alloys offer great advantages for aerospace and automotive applications, as a result of their outstanding specific mechanical properties and corrosion resistance.1) A tensile test is generally employed to characterize the mechanical properties of materials in order to aid either the design of structures or their in-service verification.
Depth sensing, on the other hand, represents an alternative testing method that introduces additional advantages over the conventional uniaxial tensile test, in terms of sample requirements (simple geometry and small size) and testing features (a quick, easy and non-destructive test). The latter qualities are very attractive in an industrial environment, especially for tuning manufacturing (e.g., precipitation and aging) processes or to tailor an alloy microstructure to meet certain prescribed mechanical properties.
However, high strength aluminum alloys (e.g., AA7075) have been found, upon indentation testing and after different aging treatments, to exhibit both a strong size effect (ISE)2) and abnormal mechanical behavior.3) Surprisingly, the induced stress-strain field has been found to resemble that of a wedge indentation,3) which suggests a great deviation from the common uniaxial radial compression behavior of metallic alloys upon indentation with Vickers or other similar large-apical angle indenters (α > 60°).4) The unique combination of a low Young modulus (E) and a low strain hardening coefficient (n) are considered as key factors of such an unusual elastoplastic behavior of aged aluminum alloys upon indentation.3,5) Therefore, the systematic development of high-strength aluminum alloys, with the aid of in-situ indentation testing, may slow down, until the abnormal behavior of aged aluminum alloys has been sufficiently elucidated.
The principal aim of this study has been to estimate the tensile-like (i.e., macroscopic) yield stress (σ), in view of prospective industrial applications, with particular focus on the analysis of the stress-strain field response upon indentation of an aluminum alloy (AA2198-T3) used in the aircraft industry. A new dual-scale instrumented indentation test (DualS-IIT) methodology, which combines a prior macro-indentation and a subsurface nano-hardness survey, is here proposed. The terms “tensile-like” and “macroscopic” yield stresses are here intended as being equivalent, since the prior indentation is employed to promote a prior massive plastic deformation which involves a volume that is statistically representative of all the relevant features (size and distribution) of the microstructure of the alloy. Thus, the yield stress measured by any indentation methodology will be comparable with the tensile yield stress.
It is well-known that the strain field underneath an indentation results from the elastoplastic properties of a material. Various papers have reported on the strain field induced by a macro-indentation in the cross-section of the medium plane after complete unloading.3,6–23)
The clear identification of the elastic-plastic boundary represents the initial yielding of the material.6,7) This boundary has been detected visually using chemical etchants sensitive to low strains, in the case of brass and steel, after indenting with spherical, Vickers, conical and wedge indenters.6,7) Analogous effects have been analyzed using a wedge indenter shaped with various apex semi-angles (20 to 68°).7) It has been recognized that the plastic strain fields induced by any type of indenters with an apical semi-angle of 68° are similar to each other, except for the strained regions nearest the indent.6,7) More detailed studies4) have clarified that the strain field imparted by indenters with α ≥ 60° is of a compression type, i.e., composed of concentric hemispherical iso-strain surfaces. It has been assumed that these hemispheres are centered in a point close to the initial contact.6,7)
The determination of the stress-strain field underneath a spherical macro-indentation was pioneered by Krupkowsky,8) who conducted a spherical micro-hardness survey over a cross-sectioned median plane of a spherical macro-indentation. The same method was later extended by other researchers to different alloys, different indenter geometries and using different micro-hardness techniques.3,9,10,13,14,17–19)
However, in most of these studies, the outer iso-strain boundaries were elliptical, rather than hemispherical, with the long axis coinciding with the loading direction.3,14,19,28) Ellipticity has been found to decrease markedly in AA7075 as the yield stress and strain hardening coefficient increase.3) The behavior of the latter has been later confirmed by finite element analysis.19)
It should be noted that all the above mentioned studies referred to the unloading stage and that the observed ellipticity was related to the recovered structure, which is known to be governed by the Young modulus rather than yield stress.
From a theoretical point-of-view, the original expanding cavity model (ECM)24) and subsequent upgrades (see Ref. 4) as an example) assume a radial compression stress-strain field (i.e., hemispherical in shape). The entire elastoplastic region underneath the indenter has been divided into three characteristic sub-regions, namely, a) hydrostatic (near the tip); b) elastic (at a distance from the indent); and c) elastic-plastic transition (between a and c).4) A yielding condition was set at the interface between c and the outer elastic region. Such an interface defined the yield radius (r), as it represented the locus of points in which the material yields upon indentation. Thus, it contains information on the yield strain and yield stress.4) Johnson’s ECM4) (hereinafter, denoted as the J-model) is valid for an elastic-perfectly plastic material: H/σJ = (2/3)[1 + ln((E tan(β))/(3σJ))], where H is the hardness and β = 90° − α is the angle of inclination of the indenter to the surface at the edge of the indentation. In addition, two alternate ECM equations25,26) have been introduced for comparison purposes. These models are denoted hereinafter as the simplified Johnson’s model (SJ-model)25) and the Gao-Jing-Subhash model (GJS-model),26) respectively. While the SJ-model is expressed as rSJ = [(1.5F)/(πσ)]1/2, the GJS-model reads rGJS = a3[(E cot(α))/(3σ)]1/3. Here, F is the maximum indentation load and a is the contact radius of a conical imprint. The SJ-model is valid for both Vickers and conical indenters and has recently been validated on a physical basis.27) The GJS-model was first derived for a conical indenter and assumes a power law hardening material. The parameter a can reasonably be approximated with the semi-diagonal of the Vickers indent.
All the ECM equations can be solved for the yield stress, provided that the other quantities have been measured.
When the SJ- and GJS-model equations have been solved for the yield stress, the measurement of r poses a serious accuracy problem for two reasons. The first problem is linked to the power of the equations (3 and 2 for the GJS- and SJ-models, respectively). Thus, the possible measurement errors on r will make the GJS-model more inaccurate than the SJ-model. The second problem is intrinsic to the actual nature of the r-boundary, since it identifies a region with the lowest indentation strains.6)
A systematic analysis, by means of a finite element model,29) suggested that the dimensionless yield radius ($\tilde{r} = r/a$) decreased as σ/E increased, but it was not affected to any great extent by the contact depth. On the other hand, $\tilde{r}$ decreased as the Poisson ratio increased and n decreased, on condition that all the other quantities were constant.
It should be noted that the SJ-model has already been used by other researchers to predict the yield stress, starting from the measurement of the yield radius on the pile-up surface and assuming a hemispherical elastic-plastic boundary.30–32) The attained σ agreed well with the values of tensile tests on aluminum, copper, iron and molybdenum alloys,30–32) but its agreement was poor for the case of tungsten, zinc and titanium alloys.30–32)
The extensive literature on indentation clearly encourages the use of an indentation test in place of a tensile test to extract tensile-like elastoplastic properties. However, it is not so clearly pointed out that the best matching between an indentation test and a tensile test can be achieved using a macro-indentation test as the volume of the sensed material in both tests is of the same order of magnitude.
Unlike previous studies,3,14) this work is mainly concerned with the study of the elastoplastic region, at a distance from the indent, and in particular at the elastic-plastic boundary (or yield radius), with the final aim of estimating a “tensile-like” yield stress by measuring the yield radius.
The method consists of two basic steps. First, a macro-instrumented indentation test (MIIT) induces a sufficiently large elastoplastic region in the tested material. Such an indented volume is hypothesized to be equivalent to the volume involved in the tensile test measurement. Second, it follows a nano-instrumented indentation test (nIIT) survey along the loading direction in the medium plane cross-section to build a nano-hardness vs. depth graph which is used to detect the yield radius. Here, the combination of the nano- and macro-instrumented indentation has been denoted as dual scale instrumented indentation test - DualS-IIT.
2. Materials and Methods
According to existing studies on subsurface indentation,3,8–11,13,14,16–19) a 20 × 10 × 4 mm sample of cold rolled AA2198-T3 (a naturally aged Al–Li alloy) was Vickers macro-indented with an MIIT tester33) under a maximum load of 400 N and the loading time, holding time and unloading time were set to 30 s, 30 s and 10 s, respectively. The procedure adopted to extract the indentation properties conformed with the ISO-14577 standard.34)
The sample was then cut parallel to the diagonal of the macro-indent (Fig. 1(a) and 1(b)) to less than a pre-established allowance. Subsequently, it was mechanically polished using various SiC papers down to P2400 and then electropolished (25 s at 40 V) in a perchloric acid, ethanol, distilled water and butoxyethanol solution, to obtain a strain-free surface.

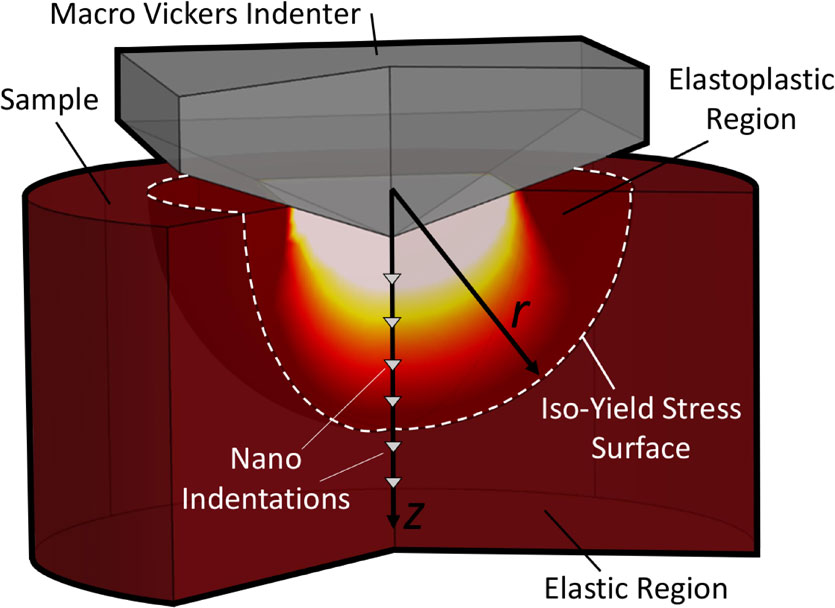
The nIIT surveys were carried out using a Hysitron Triboindenter (Bruker Co.) equipped with a Berkovich indenter (Fig. 2). Preliminary experiments were devoted to avoiding ISE phenomena. Thus, an optimal load of 1000 µN was selected along with a holding time and loading rate of 10 s and 50 µN s−1, respectively, for the nano-hardness measurements. The polished face of the sample was divided into 6 smaller (25 × 20 µm2) zones (probe points) across and along the centerline at a distance from the macro-indent (zones I to IV in Fig. 2). Each zone contained 8 to 12 nano-indentations. The measured indentation properties were conveniently averaged over the individual zone areas. It should be pointed out that, in the case of hardness, the mean value of the nano-hardness per zone was here equivalent to one micro-hardness value of that shown in previous works.3,13,14,18) All the measurements were conveniently filtered and accidental outliers were eliminated: only measurements which reduced modulus (Er) was within the 95% confidence interval were retained. For methodology validation purposes, a tensile test was also conducted on AA2198-T3.

Another set of nIITs was performed in an undisturbed zone of the polished sample, i.e., at a distance from the Vickers macro-indent, in order to establish the reference hardness (H∞) of the alloy.
Finally, a two-dimensional graph of the measured nano-hardness (y-axis) vs. the corresponding depth (x-axis) was built. As the hardness increased in the deformed zone, due to strain hardening, the nano-hardness vs. depth plot showed the location of the minimum depth at which plastic deformation occurred (i.e., the yield depth). Assuming a radial compression stress-strain field upon indentation,24) described by hemispherical iso-strain lines centered at the point of first contact,4) the yield radius corresponded to the yield depth. In order to quickly locate the yield radius, the two end probe points were first defined (i.e., zones I and VI) where the nano-hardness of the furthest point from the macro-indent corresponded to H∞. The following probe points were located between the latter points so that the measured nano-hardness decreased tending to H∞.
The yield stress value was obtained upon substitution of the known yield radius in the SJ-model equation. For comparison purposes, the yield stress was estimated using the J- and GJS-models, by introducing the measured Young modulus from the tensile test as input.
For validation purposes, the 700 N load was also assessed.
3. Results
A top view (optical) and a cross-section view (FESEM) of the Vickers macro-imprint are shown in Fig. 1. The semi-diagonal length (a), macro-indentation modulus (EIT) and the permanent indentation depth after unloading measured 382 µm, 65 GPa and 100 µm, respectively.
A schematic of the indented regions is shown in Fig. 2. The inset shows a magnification of an atomic force microscopy (AFM) image of the indented V-zone. The reduced modulus measurements (∼90 GPa mean value, Fig. 3), populated according to a Gaussian law, agree with previous findings pertaining to aluminum alloys.35–37)
The yield strength and Young modulus, as obtained from the tensile test (Fig. 4), were 311 MPa and 76 GPa, respectively. The best fit of the plastic trace of the curve, by means of a Hollomon law (σ = kHεn), gave a strain hardening coefficient of 0.167 MPa and a strength factor (kH) of 707 MPa, respectively.

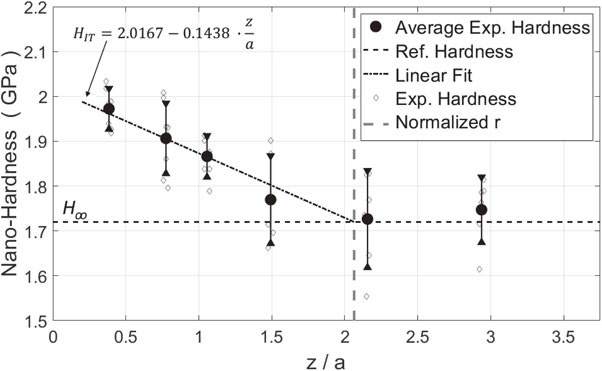
Figure 5 shows the recorded load-displacement curves (ICs) at two representative zones of the indented surface, namely the I-zone (Fig. 5(a)), near the Vickers macro-indent, and the VI-zone (Fig. 5(b)), at a distance from the macro-indent. The ICs were more repeatable in the I-zone than in the VI-zone. The latter underwent pop-in events over a 50–100 µN range on loading. The maximum indentation depths were lower in the I-zone than in the VI-zone, consistent with its larger local strain hardening state. The results of the nano-indentation measurements are depicted in Fig. 6. The small diamond symbols and vertical bars denote the retained nano-indentations and twice the standard deviation per probe point. The oblique dashed line represents a least square regression line. Its intersection with the horizontal reference line (H∞ = 1.72 GPa) identifies the elastic-plastic boundary at a dimensionless depth (z/a) of 2.1 ± 0.3, which corresponds to the actual depth of 802 µm. Assuming a radial compression stress-strain field upon indentation,24) the yield radius (and dimensionless yield radius) corresponds to the latter depth (and dimensionless depth). The percent error of the yield radius, which is equal to 14%, is in agreement with previous measurements on aluminum, tungsten and copper (see Figs. 5 and 8 in Ref. 30) and Fig. 2 in Ref. 31)).

The experimental value of the dimensionless yield radius can be compared with that predicted by the SJ- and GJS-models by introducing the measured tensile yield stress as input. Upon invoking the GJS-model equation, the tensile Young modulus had to be entered as input. The results were $\tilde{r}_{SJ} = 1.98$ and $\tilde{r}_{GJS} = 2.92$, respectively. On the basis of these results, it is possible to confirm the validity of the SJ-model.
The estimation of σ using the SJ-model (and the GJS-model for comparison purposes), resulted in 297 MPa (and 1105 MPa). Furthermore, the J-model gave 301 MPa as the yield stress when using E from the tensile data and the hardness from the Vickers macro-hardness (Table 1).

Table 1 Comparison of σ estimates upon Vickers macro-indentation for AA2198-T3 and other materials.
4. Discussion
The measured value of the dimensionless radius ($\tilde{r} = 2.1$) was confirmed by our 3D finite element analysis (not shown) for the given AA2198-T3, which provided 1.9 for the Vickers macro-indentations for several maximum loads (100, 400 and 700 N). Its value was also consistent with that assumed by Durst et al.38) in their computations (i.e., $\tilde{r} = 1.9$) and with the value found in the finite element analysis (i.e., $\tilde{r}$ in the 1.3–2.4 range) for several metals and alloys.29)
On the other hand, the estimated value of $\tilde{r}_{GJS}$ largely exceeded the measured one for AA2198-T3, although it was consistent with other measured values found for other materials, namely, 2.8–3.4 for brass,6) low-carbon steel7) and 0.7% hardened carbon steel,7) as measured by Vickers macro-indentation and an etching technique, ∼3 in annealed pure copper,14) 2.8–4 in an aged AA70753) as measured by Vickers macro-indentation and a micro-hardness survey. It should be pointed out that the GJS-model has not yet been validated experimentally.
However, a deeper inspection of the measured value of $\tilde{r}$ found in this work for AA2198-T3 showed that it was somewhat lower than those reported for other alloys6,7,14) and other aluminum alloys.3) This can be ascribed to the unique combination of a low Young modulus and a relatively high yield stress of AA2198-T3, which implies a larger yield strain (σ/E) on loading and a greater elastic recovery on complete unloading than those observed for other metals.
Furthermore, an inspection of the strain field in AA7075 indicated a marked decrease in $\tilde{r}$ as n increased.3) Consistently, a much smaller $\tilde{r}$ was found in AA2198-T3 than those found in AA70753) for any aging treatment, because the latter exhibited a lower n than the former. Instead, r was observed to increase linearly as the maximum indentation depth increased, while the r/hMAX ratio was 6.5 for metals considering σ/E = 0.006 and n = 0.3.29) Such a ratio compares well with the value of 7.38 of this work, where σ/E = 0.004 and n = 0.167 were assumed for AA2198-T3.
As for the relationship between hMAX and a, which can be considered to be linear for displacements >6 µm in the macro-range,34) we expected that $\tilde{r}_{Y}$ would remain independent of hMAX (or of the applied load). However, Table 1 shows that $\tilde{r}$ decreased slightly from 2.1 to 1.9 when the load was increased from 400 to 700 N. This may result from the unfavorable combination of a low Young modulus and the poor strain hardening ability of AA2198-T3. These factors may in fact contribute to a broader definition of the outer elastic-plastic boundary and, hence, to a less precise value of $\tilde{r}$. Such an inaccuracy of $\tilde{r}$ with n may became worse as the load increases. This is apparent from the ECM results, when higher loads were used to extract σ for AA2198-T3. Accordingly, at 400 N, both the J- and SJ-models gave reliable values of σ, whereas the GJS-model overestimated the experimental value (see Table 1). At 700 N, the J- and SJ-model estimations deviated slightly, whereas the GJS-model result suffered from analogous previous limitations. However, care should be taken when selecting the maximum load for aluminum alloys in order to prevent such additional anomalies as accidental distortion and other less understood spurious effects.
Mention should also be made about the constitutive laws of the material associated with the three ECMs. The J- and SJ-models presupposed an elastic-perfectly plastic law, while the GJS-model embodied a power hardening law. As the A2198-T3 alloy was described quite well with a power law, one would expect the GJS-model to perform better than the other ECMs. However, the computed Hollomon law fit (Fig. 4) was good for large strains (R2 = 0.9847), but it was poor for smaller strains than 0.013, including the yield point. Thus, the accuracy of the fitting law around the yield point is particularly crucial for the reliability of the GJS-model results. It should also be mentioned that, to the best of the authors’ knowledge, no attempts have been made to validate the GJS-model, whose applicability to indentation experiments still remains an open research subject.
Conversely, as shown in Table 1, the SJ-model and the J-model appear to be comparable and adequate to estimate the yield stress of AA2198-T3. This would imply that both models accurately described the outer elastic-plastic boundary, despite their inherent input data constraints. The J-model in fact requires the Young modulus, which can be determined from MIIT or other alternate testing methods. In the J-model equation, the Young modulus is contained in the logarithm argument (E tan(β))/(3σ), which is usually much larger than the number one for metals and alloys. Thus, as a further approximation, the Young modulus can reasonably be replaced by the indentation modulus EIT (e.g., its mean value from MIIT) with a negligible influence on the estimation of σ. Table 1 shows that the yield stress for AA2198-T3 was 310 MPa with EIT, instead of 301 MPa with E.
Overall, the SJ-model equation, as a result of its relative simplicity, offers a wider field of applicability. Its applicability for the estimation of σ in other materials was here verified in terms of Vickers macro-hardness and a Vickers micro-hardness survey using data taken from the literature.3,14,18) The results shown in Table 1 attest that the agreement was good for the case of an annealed pure copper, when comparing the estimation of σ using the SJ-model equation and Vickers macro-hardness14) vs. either tensile39) or compression data;40) however, deviations were encountered vs. the tensile test in the case of AA70753) and P675 SS.18)
Such deviations can be rationalized by comparing the E tan(β)/σ parameter4,30) of each of the investigated alloys. It was here found to be ∼60 and ∼100 for the P675 SS18) and A2198-T3 alloys, respectively. The difference in such a parameter is sufficient to explain the poor applicability of the SJ-model to the P675 SS alloy. The A70753) alloy with different aging times (6 h and 94 h) gave results of 82 and 84, respectively, which were much closer to the 100 of the A2198-T3 alloy. However, the strain hardening coefficients of the A7075 alloy were 0.070 and 0.110, respectively,3) that is very small compared to the 0.167 of AA2198-T3. This indicates that the elastoplastic properties of aluminum alloys are very sensitive to aging treatments upon indentation.3) The distinct elastoplastic properties of the A7075 alloy also had an impact on their characteristic elliptical strain field3) which, in turn, determined the applicability of ECM to these alloys. As ellipticity decreases markedly with an increasing strain hardening coefficient,3,29) the larger value of n in AA2198-T3 explained the applicability of both the J- and SJ-models to AA2198-T3 compared to the aged AA7075. Moreover, looking at the individual stress-strain curves of each alloy, it was observed that AA2198-T3 differed from both the A70753) and P675 SS18) alloys, especially at the yield point. In other words, the elastic-to-plastic transition of the former was abrupt, while the transition of the latter alloys was smoother and round in shape (see Fig. 3 in Ref. 3) and Fig. 3(a) in Ref. 18)). Thus, AA2198-T3 behaved more like an elastic-perfectly plastic material than the A70753) and P675 SS18) alloys. As a result, the estimation of the σ with the J- and SJ-models was inaccurate for both the AA7075 and P675 SS alloys.
Accordingly, when the J-model was applied to annealed pure Cu using published hardness data19) and a conical indenter (α = 75°), the estimation of σ (= 62 MPa) was in fairly good agreement with the tensile value of 65 MPa.19) However, the accuracy of the J-model estimates decreased as the angle α decreased, and hence deviated from the ECM assumptions. An angle α > 65° (or somewhat greater than 60°4)) was in fact a necessary condition to fulfill the radial uniaxial compression condition in annealed copper.4)
Regardless of the material under testing, and even for the same A7075 alloy under different aging conditions, the boundary of the elastoplastic region or the bulk elastoplastic properties under indentation of any alloy, markedly depend on the plastic deformation behaviour induced by the Vickers macro-indentation rather than by the type of either nano- or micro-hardness surveys3,14,18,19) used for its characterization.
In short, the proposed methodology is valid for those materials in which straining by hemispherical shells takes place on loading, according to the assumption behind the ECM, which is valid for materials exhibiting sufficiently large n and σ. The possible loss of sphericity after complete unloading is not a critical issue, provided that the elastic recovery does not affect r along the centerline to a great extent. The proposed methodology cannot be used for those materials that exhibit non-hemispherical iso-shells on loading, as they deviate from the assumption of radial compression.
More theoretical studies are needed to generalize the existing relationships so that more engineering materials can be analyzed successfully by means of DualS-IIT to provide tensile-like elastoplastic properties.
5. Conclusion
A new dual-scale (nano- and macro-) instrumented indentation test (DualS-IIT) has been proposed with the primary purpose of: first, measuring the yield radius (underneath a Vickers macro-indent) and then determining the tensile-like (i.e., macroscopic) yield stress.
The methodology has been applied to an A2198-T3 alloy, due to its relevance for lightweight design for transportation.
Nano-hardness measurements conducted along only the z-axis were found to be sufficient to detect the outer elastic-plastic interface.
Three expanding cavity models have been considered to estimate the yield stress. Their validity was tested against the investigated alloys as well as against other metals and alloys taken from literature. The dimensionless yield radius of the AA2198-T3 was about 2, which is abnormally lower than that of other alloys, whereas the yield stress was as high as 297 MPa (with the SJ-model), in agreement with the tensile test and the J-model. The abnormal behaviour of AA2198-T3 was ascribed to the unique combination of the low Young modulus, high yield stress and low strain hardening coefficient of the given alloy.
It was found that the elastoplastic properties of materials could be discriminated more accurately by the yield interface (radius and outline) than by hardness.
The proposed methodology paves the way toward new research in which the combination of nano- and macro-indentation in one single experiment will allow macro- and nano-indentation properties, which at present are uncorrelated, to be correlated directly.
REFERENCES
- 1) N.D. Alexopoulos, E. Migklis, A. Stylianos and D.P. Myriounis: Int. J. Fatigue 56 (2013) 95–105.
- 2) J. Li, F. Li, F. Xue, J. Cai and B. Chen: Mater. Des. 37 (2012) 491–499.
- 3) G. Srikant, N. Chollacoop and U. Ramamurty: Acta Mater. 54 (2006) 5171–5178.
- 4) K.L. Johnson: J. Mech. Phys. Solids 18 (1970) 115–126.
- 5) M. Morozov, G.Y. Tian and P.J. Withers: Nondestruct. Test. Eval. 28 (2013) 300–312.
- 6) L.E. Samuels and T.O. Mulhearn: J. Mech. Phys. Solids 5 (1957) 125–134.
- 7) T.O. Mulhearn: J. Mech. Phys. Solids 7 (1959) 85–88.
- 8) M.A. Krupkowski: Rev. Métall. 28 (1931) 641–660.
- 9) B.J. Koeppel and G. Subhash: Wear 224 (1999) 56–67.
- 10) G.H. Williams and H.J. O’Neill: Iron Steel Inst. 182 (1956) 266.
- 11) R. F. Bunshah: Techniques of Metals Research Volume 5: Measurement of Mechanical Properties Part 2, (Interscience Publishers, 1971) p. 164.
- 12) M.M. Chaudhri: Philos. Mag. Lett. 67 (1993) 107–115.
- 13) M.M. Chaudhri: Philos. Mag. A 74 (1996) 1213–1224.
- 14) M.M. Chaudhri: Acta Mater. 46 (1998) 3047–3056.
- 15) M. Okayasu, Z. Wang and D.L. Chen: Mater. Sci. Technol. 21 (2005) 530–538.
- 16) M. Okayasu, K. Sato and M. Mizuno: J. Mater. Sci. 43 (2008) 2792–2798.
- 17) G. Sundararajan and Y. Tirupataiah: Acta Mater. 54 (2006) 565–575.
- 18) N.A. Branch, G. Subhash, N.K. Arakere and M.A. Klecka: Acta Mater. 58 (2010) 6487–6494.
- 19) K.E. Prasad, N. Chollacoop and U. Ramamurty: Acta Mater. 59 (2011) 4343–4355.
- 20) C.H. Yew and W. Goldsmith: J. Appl. Mech. 31 (1964) 635–646.
- 21) A.G. Atkins and D. Tabor: J. Mech. Phys. Solids 13 (1965) 149–164.
- 22) A.C. Fischer-Cripps: J. Mater. Sci. 32 (1997) 727–736.
- 23) B. Riccardi and R. Montanari: Mater. Sci. Eng. A 381 (2004) 281–291.
- 24) D. Marsh: Proc. R. Soc. London, Ser. A 279 (1964) 420–435.
- 25) W.W. Gerberich, N.I. Tymiak, J.C. Grunlan, M.F. Horstemeyer and M.I. Baskes: J. Appl. Mech. 69 (2002) 433–442.
- 26) X.L. Gao, X.N. Jing and G. Subhash: Int. J. Solids Struct. 43 (2006) 2193–2208.
- 27) T. Zhang, S. Wang and W. Wang: Int. J. Mech. Sci. 148 (2018) 9–19.
- 28) Z.H. Xu and D. Rowcliffe: Philos. Mag. A 82 (2002) 1893–1901.
- 29) Z. Yuan, Y. Wang, W. Tian, Y. Wang, K. Wang, F. Li, Y. Guo, Y. Hu and X. Wang: Philos. Mag. Lett. 98 (2018) 209–217.
- 30) D. Kramer, H. Huang, M. Kriese, J. Robach, J. Nelson, A. Wright, D.F. Bahr and W.W. Gerberich: Acta Mater. 47 (1998) 333–343.
- 31) J.S. Robach, D.E. Kramer and W.W. Gerberich: MRS Proc. 522 (1998) 133.
- 32) D.F. Bahr and W.W. Gerberich: Metall. Mater. Trans. A 27 (1996) 3793–3800.
- 33) G. Barbato, G. Genta, R. Cagliero, M. Galetto, M.J. Klopfstein, D.A. Lucca and R. Levi: CIRP Ann. 66 (2017) 495–498.
- 34) International Organization for Standardization. (2002). Metallic Materials: Instrumented Indentation Test for Hardness and Materials Parameters. Verification and Calibration of Testing Machines. ISO.
- 35) R. Rodrıguez and I. Gutierrez: Mater. Sci. Eng. A 361 (2003) 377–384.
- 36) W. Ni, Y.T. Cheng, C.M. Cheng and D.S. Grummon: J. Mater. Res. 19 (2004) 149–157.
- 37) R. Saha and W.D. Nix: Acta Mater. 50 (2002) 23–38.
- 38) K. Durst, B. Backes and M. Göken: Scr. Mater. 52 (2005) 1093–1097.
- 39) W.D. Jenkins, T.G. Digges and C.R. Johnson: J. Res. Natl. Stand. 58 (1957) 201–211.
- 40) Y.Y. Lim and M.M. Chaudhri: Philos. Mag. A 82 (2002) 2071–2080.