Abstract
The effect of heat treatment temperature on texture formation in Ti–5.5Mo–8Al–6Zr (mol%) alloy sheets was systematically investigated in this study. α′′ martensite was induced by cold-rolling. Although the deformation texture of α′′ martensite could not be detected, the formation of $\{ 130\} _{{\alpha ''}}\langle 3\bar{1}0\rangle _{{\alpha ''}}$ and (100)α′′[010]α′′ textures was proposed. The specimen heat-treated at 1073 K or higher consisted of a single β phase, and Goss, {110}β⟨113⟩β, and Brass orientations were formed as the recrystallization textures. The Goss orientation, which is irregular for β-Ti alloys, developed with increasing heat treatment temperature, and became the dominant component in the specimens heat-treated at 1173 K. The specimen heat-treated at 973 K consisted of the β + α phase. {113}β⟨110⟩β, {113}β⟨141⟩β, {223}β⟨252⟩β, {223}β⟨692⟩β, and {332}β⟨113⟩β were formed in the β phase, whereas $\{ 11\bar{2}0\} _{\alpha }\langle 1\bar{1}00\rangle _{\alpha }$–$\{ 11\bar{2}2\} _{\alpha }\langle 1\bar{1}00\rangle _{\alpha }$ was formed in the α phase. Transmission electron microscopy observations revealed that the specimen heat-treated at 973 K was not completely recrystallized. This microstructural difference led to a difference in texture components between the specimens heat-treated at 973 K and at 1073 K or higher.

1. Introduction
β-Ti alloys are widely used to develop biomaterials because of their high biocompatibility, corrosion resistance, and cold workability.1,2) In particular, these alloys are promising alternatives to Ti–Ni shape memory alloys (SMAs), which are associated with the risk of Ni hypersensitivity despite their widespread use in the biomedical field.3) The shape memory effect and superelasticity of β-Ti alloys originate from martensitic transformation from β (bcc) to α′′ martensite (c-orthorhombic) and their reverse transformation. Lattice deformation strain (LDS), one of the factors that determine the shape recovery strain of SMAs, depends on the crystallographic parameters (e.g. lattice parameters and crystal direction). The shape memory properties of β-Ti alloys can be improved by controlling the texture, and in this regard, the relationship between the texture and shape memory properties have been investigated extensively.4–11) The {001}β⟨110⟩β, {112}β⟨110⟩β, {111}β⟨110⟩β, and {111}β⟨112⟩β orientations are formed as rolling or recrystallization textures in β-Ti alloy sheets (the subscripts indicate the phase).4–14) The rolling direction (RD) is parallel to the ⟨110⟩β or ⟨112⟩β directions in these textures. In particular, under tensile stress, β-Ti SMAs preferentially adopt the ⟨110⟩β // RD direction. It is expected that large shape recovery stain is obtained along this direction because the maximum tensile component of LDS can be obtained along ⟨110⟩β.6,15–20) However, the compressive component of the LDS is minimum along ⟨110⟩β.21) For practical application, it is desirable that the tensile and compressive components of the LDS are large and close to each other.
We have previously reported that Goss orientation, which is irregular for β-Ti alloys, is formed in Ti–Mo–Al–Zr SMAs sheets.22–24) It is reported that the Goss orientation is formed in some β-Ti alloys, though it is not dominant.25) In contrast, this is the dominant texture component in Ti–Mo–Al–Zr alloys. The Goss orientation, {110}β⟨001⟩β, is ⟨001⟩β // RD and this orientation is preferential direction when compressive stress is applied to β-Ti SMAs because the maximum LDS of compressive component can be obtained along ⟨001⟩β.21,26) On the other hand, the minimum tensile component of the LDS is obtained along the ⟨111⟩β direction and not along the ⟨001⟩β direction,6,15–19) indicating that the tensile and compressive components of the LDS are balanced better along ⟨001⟩β than along ⟨110⟩β.
In addition, the formation of the ⟨001⟩β // RD texture is useful for obtaining an implant material with low Young’s modulus. Young’s modulus around 30 GPa is required for implant material because differences in Young’s modulus of implants and bone lead to bone resorption.2) In β-Ti alloys, Young’s modulus shows a large anisotropy and assumes the minimum value along ⟨001⟩β;27–29) thus the formation of the ⟨001⟩β // RD texture is effective to reduce Young’s modulus along the RD. Indeed, Young’s modulus along the RD decreased in sheets with Goss orientation and in cold-groove-rolled wires with ⟨001⟩β-fiber.24,28)
With this background, we state that the formation of Goss orientation is advantageous for biomedical SMAs and implant materials. In our previous study, we investigated the effect of thermomechanical treatment on texture formation in Ti–5.5Mo–8Al–6Zr (mol%) alloy sheets.22,23) The following aspects were revealed: (1) α′′ martensite is induced by severe cold-rolling and retained after cold-rolling, (2) Goss orientation is formed in the sheet subjected to severe cold-rolling (nominal reduction in thickness is higher than 90%) and subsequent heat treatment at 1173 K. However, the formation conditions for the Goss orientation have not been clarified. Hence, in the present study, the effect of heat treatment conditions on the texture evolution and microstructure formation in Ti–5.5Mo–8Al–6Zr shape memory alloy was systematically investigated.
2. Experimental
2.1 Specimen preparation
An alloy with the composition Ti–5.5Mo–8Al–6Zr (mol%) was fabricated by Ar-arc melting in an Ar–1% H2 atmosphere and homogenized at 1273 K for 7.2 ks. The obtained ingot was cold-rolled without lubricant with nominal reduction in thickness to 99% (final thickness of the sheet was about 250 µm). The test specimens were heat-treated at 973, 1073, and 1173 K for 3.6 ks and labeled based on the thermomechanical process used. For example, “CR” denotes the cold-rolled specimen and “HT1173” denotes the “CR” specimen heat-treated at 1173 K. All heat-treatment processes (homogenization and heat-treatment) were performed in an Ar atmosphere, and the heat-treated samples were quenched in water.
2.2 Phase constituents, texture measurements, and microstructure observation
All measurements were performed at room temperature. The phase constituents and lattice parameters were identified by X-ray diffraction (XRD) analysis using a Cu-Kα X-ray source. An X-ray diffractometer equipped with a one-dimensional detector (X’pert MPD, Malvern Panalytical) was used.
The texture in the CR specimen was evaluated by X-ray pole figure (XPF) measurements. The global and local textures in the HT specimens were evaluated by XPF and electron backscatter diffraction (EBSD) measurements, respectively. The XPF measurements were performed using an X-ray diffractometer with a Cu-Kα X-ray source (X’pert MRD, Malvern Panalytical). A polycapillary X-ray lens and a parallel plate collimator were used on the incident and detector sides, respectively. The specimen size was set to 8 mm × 8 mm, and the elevation angle was varied from 0° to 80°. The maximum beam size of the X-rays for these measurements was approximately 30 mm × 1 mm, and therefore, the specimen size was much smaller than the beam size. The orientation distribution functions (ODFs) were constructed based on the measured XPFs using a texture analysis software program (X’pert texture, Malvern Panalytical). The algorithm used in this program is the Williams-Imhof-Matthies-Vinel (WIMV) method. Pole figures for ODF calculations were as follows: 110β, 211β, 222β, and 310β for β phase in HT1173 and HT1073; 200β and 310β for β phase in HT973; and $1\bar{1}00_{\alpha }$, $1\bar{1}02_{\alpha }$, and $\bar{2}110_{\alpha }$ for α phase in HT973.
EBSD analysis was performed using a scanning electron microscope (SU5000, Hitachi) equipped with an EBSD detector. The observation area was 3 × 10⁻⁴ mm2 for HT973, and 5 mm2 for HT1073 and HT1173. An orientation imaging microscopy system (OIM, TSL Solutions) was used to analyze the inverse pole figure (IPF) maps, grain reference orientation deviation (GROD) maps and calculate the ODFs. The ODFs were calculated using a harmonic series expansion. The results of EBSD analysis were used for a quantitative texture analysis. The texture strength was evaluated based on the orientation density in these ODFs. Grain boundaries were defined by a misorientation of 2° or more. The specimens for the XPF and EBSD measurements were finished by electropolishing in a mixture of 6 vol% perchloric acid, 35 vol% butanol, and 59 vol% methanol at 233 K. Measurement was performed at 50-µm depth from the rolled surface.
The microstructure of HT973 was evaluated by transmission electron microscopy (TEM, JEOL, JEM-2100) at 200 kV. The specimens for TEM observations were finished by twin-jet polishing in a mixture of 5 vol% sulfuric acid, 2 vol% hydrofluoric acid, and 93 vol% methanol at 233 K.
3. Results and Discussion
3.1 Phase constituents
Figure 1 shows the XRD profiles of the CR and HT1173–HT973 specimens. α′′ martensite was detected in the CR specimen, but it could not be discerned whether the peaks at 2θ = 38° and 2θ = 82° were due to the α′′ phase or β phase. It has been reported that α′′ martensite is induced by severe deformation and that it remains in Ti–5.5Mo–8Al–6Zr alloy sheets.22,23) In other words, stress-induced martensitic transformation (SIMT) occurs during cold-rolling. Thus, the phase constituents identified in this study were consistent with the literature data. The lattice parameters of the α′′ phase determined from this XRD profile were aα′′ = 0.3038 nm, bα′′ = 0.5040 nm, and cα′′ = 0.4684 nm. However, these values likely have large errors because of peak broadening owing to the introduction of dislocations.

In contrast, sharp peaks diffracted from the β phase were observed in HT1173–HT1073, whereas peaks due to the α (hcp) and β phase were observed in HT973. The fact that only the β phase was observed in the specimens heat-treated at temperatures of 1073 K or higher implied reverse transformation of the α′′ phase to the β phase under these conditions as well as the existence of β-transus between 973 and 1073 K. The estimated β-transus of this alloy using the equation proposed by Guo et al. was 1072 K.30) The lattice parameter of the β phase was aβ = 0.3290 nm, as calculated from the HT1173 profile.
3.2 Textures of the CR specimen
Figure 2 shows the XPFs of the α′′ phase in the CR specimen under the conditions 2θ = 35.7° and 53.1°, which correspond to the diffraction angles of 020α′′ and 022α′′ in Fig. 1. However, other poles with similar plane spacing could overlap with these PFs because the plane-spacing ranges were broadened due to the introduction of dislocations in the CR specimens. Lattice parameters obtained in Section 3.1 indicate that 110α′′ (2θ = 34.5°) and 112α′′ (2θ = 52.5°) peaks exist in the vicinity of 020α′′ and 022α′′ peaks. Thus, it is reasonable to assume that Fig. 2 indicates 110α′′ + 010α′′ and 112α′′ + 011α′′ PFs. The 110α′′ and 010α′′ planes are tilted by about 30° toward the RD from the ND, while the 112α′′ and 011α′′ planes are tilted by 30°–60° from the ND.

On the basis of the aforementioned results, we attempted to identify the textures satisfy the following conditions for 010α′′ and 011α′′ poles. The conditions for the 010α′′ poles are as follows: the poles are tilted by about 30° toward the RD from the ND, or are out of the measurement range (tilted by more than 80° from the ND). The conditions for the 011α′′ poles are as follows: the poles are tilted by 30°–60° from the ND, or are out of the measurement range. Table 1 shows some candidate orientations that satisfy these conditions.

Table 1 List of candidate textures in the CR specimen. The condition satisfying the orientation is also shown (A: tilted by about 30° toward the RD from the ND, B: tilted by 30°–60° from the ND, C: out of the measurement range).
We could not identify the orientation of the deformation texture because if the large number of candidates, such as $\{ 130\} _{{\alpha ''}}\langle 3\bar{1}0\rangle _{{\alpha ''}}$ and {301}α′′–(100)α′′ // ND. However, we focused on two orientations, $\{ 130\} _{{\alpha ''}}\langle 3\bar{1}0\rangle _{{\alpha ''}}$ and (100)α′′[010]α′′. The ideal position of the 110α′′ + 010α′′ and 112α′′ + 011α′′ poles in these orientations is shown in Fig. 3. Only the 010α′′ poles in $\{ 130\} _{{\alpha ''}}\langle 3\bar{1}0\rangle _{{\alpha ''}}$ are tilted by about 30° toward the RD from the ND, while this pole in the other orientations listed in Table 1 are located out of the measurement range. The position of the 110α′′ and 112α′′ poles in (100)α′′[010]α′′ correspond to the experimental data, though the 010α′′ and 011α′′ poles in this orientation are out of the measurement range. (100)α′′[010]α′′ corresponds to the ⟨110⟩β // RD texture (α-fiber) which has commonly been reported as a deformation texture in bcc alloys31) when the lattice correspondence of the martensitic transformation is considered.

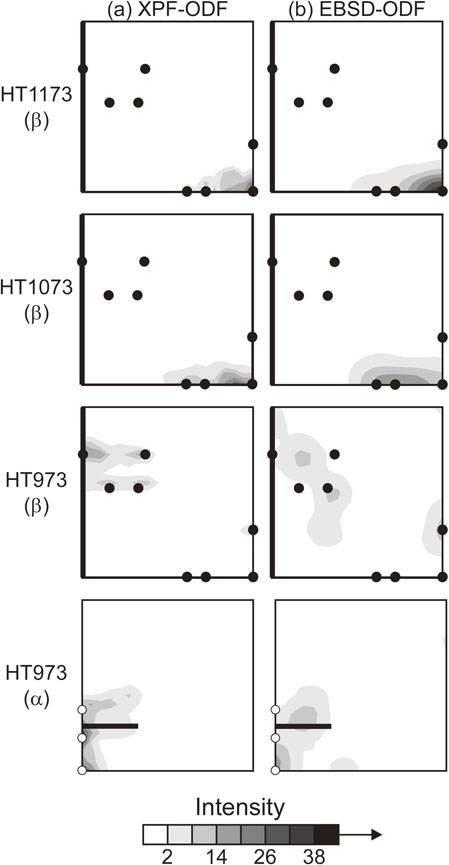
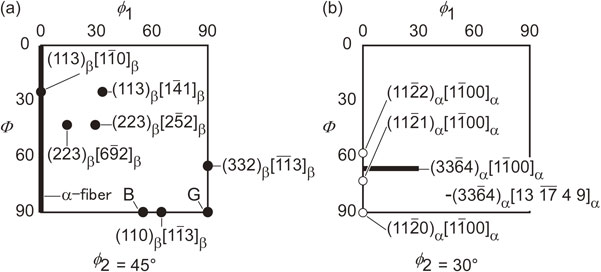
Figure 4 shows the locations of the key orientations and fiber in the ϕ2 = 45° (for β phase) and ϕ2 = 30° (for α phase) cross section of the ODF. In the α phase, {ϕ1, Φ, ϕ2} is set to $(0001)_{\alpha }[2\bar{1}\bar{1}0]_{\alpha }$. Hereafter, the ODF coordinates follow those in Fig. 4. The ϕ2 = 45° cross section of the ODFs in the β phase for HT1173–HT973 is shown in Fig. 5. The α phase is detected in HT973, so the ϕ2 = 30° cross section of the ODF in the α phase for HT973 is also shown in Fig. 5. The left and right columns indicate the ODFs calculated from the information obtained in XPF (XPF-ODF) and EBSD (EBSD-ODF) measurements, respectively. The XPF-ODFs and EBSD-ODFs indicate the global and local texture.
For the global texture, texture with a maximum intensity close to {110}β⟨001⟩β (Goss orientation) developing along Φ = 90° line on the ϕ2 = 45° sections was observed in HT1173 and HT1073. α-fiber, ⟨110⟩β // RD, which are commonly formed in β-Ti alloys were not observed in these specimens.
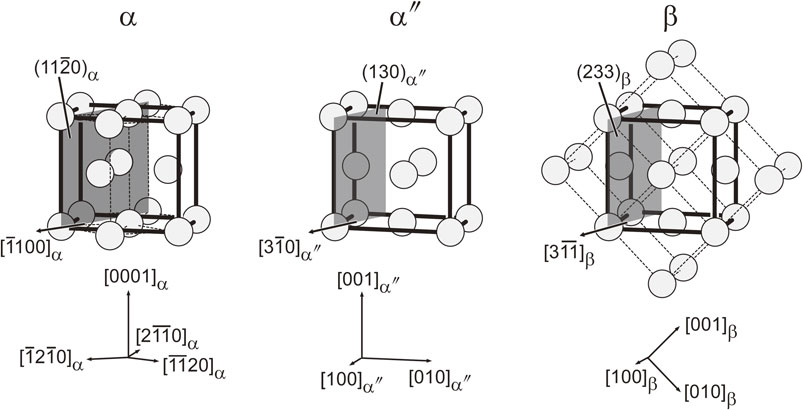
On the other hand, {113}β⟨110⟩β, {113}β⟨141⟩β, {223}β⟨252⟩β, {223}β⟨692⟩β, and {332}β⟨113⟩β were observed in HT973. {113}β⟨110⟩β were included in the α-fiber, while Goss, {110}β⟨113⟩β, and Brass orientations disappeared. The α phase in HT973 formed $\{ 11\bar{2}0\} _{\alpha }\langle 1\bar{1}00\rangle _{\alpha }$–$\{ 11\bar{2}2\} _{\alpha }\langle 1\bar{1}00\rangle _{\alpha }$. The texture of the α phase partially corresponds to that of the β-phase in HT973 when the Burgers orientation relationship between the two phases is considered.32) $(233)_{\beta }[3\bar{1}\bar{1}]_{\beta }$ corresponds to $(11\bar{2}0)_{\alpha }[\bar{1}100]_{\alpha }$. $(233)_{\beta }[3\bar{1}\bar{1}]_{\beta }$ also corresponds to the deformation texture, $(130)_{{\alpha ''}}[3\bar{1}0]_{{\alpha ''}}$, listed in Table 1 when the lattice correspondence of the martensitic transformation is considered. This correspondence among α, α′′, and β is depicted in Fig. 6. The orthorhombic lattices in these three phases is marked in thick lines; the hcp structure can be regarded as having an orthorhombic lattice. Based on this orientation relationship, orientation spread from $(\bar{3}1\bar{1})_{\beta }[011]_{\beta }$ to $(\bar{3}1\bar{1})_{\beta }[141]_{\beta }$ observed in Fig. 5(a) corresponds to $(6\bar{3}\bar{3}\bar{4})_{\alpha }[0\bar{1}10]_{\alpha }$–$(6\bar{3}\bar{3}\bar{4})_{\alpha }[\bar{4}\ \bar{13}\ 17\ \bar{9}]_{\alpha }$. Formation of $\{ 33\bar{6}4\} _{\alpha }$ // ND texture was confirmed in the ODF of α phase.
As shown in Fig. 5, the global texture component of HT1173 and HT1073 is reflected in the local texture. Texture with a maximum intensity close to the Goss orientation also appears in the EBSD-ODFs. Figure 7 shows the intensity profile along the Φ = 90° line on the ϕ2 = 45° sections of EBSD-ODF in HT1173 and HT1073. {110}β⟨112⟩β (Brass orientation) slightly developed in addition to Goss orientation in HT1173, whereas texture with a maximum intensity at {110}β⟨113⟩β was observed in HT1073. However, the EBSD-ODF in the β phase of HT973 has little in common with that of the XPF-ODF, although the EBSD-ODF for the α phase seems consistent with that of the XPF-ODF. The formation of {113}β⟨110⟩β, {223}β⟨252⟩β, and {332}β⟨113⟩β in the XPF-ODF is reflected in the EBSD-ODF, although the intensity of {113}β⟨141⟩β and {223}β⟨692⟩β are not reflected in the EBSD-ODF. As the observation area for HT973 was too small, the data obtained from EBSD did not correspond to the entire specimen; the observation area for HT973 was extremely small as compared to that for HT1073 and HT1173, as mentioned in section 2.2. For quantitative analysis, we regard the local texture information as that for the global texture of HT1173 and HT1073. In addition, the texture components confirmed in both the XPF-ODF and EBSD-ODF ({223}β⟨252⟩β, {332}β⟨113⟩β, and {113}β⟨110⟩β) are discussed for HT973.

Figures 8(a) and (b) show the relationship between the heat treatment temperature and the texture intensity in the ODFs. The texture components formed in HT1173 and HT1073 are shown in Fig. 8(a), namely, Goss, {110}β⟨113⟩β, and Brass orientations. The Goss orientation is dominant in HT1173, while the intensity difference among these three orientations is small in HT1073. In other words, the Goss orientation strongly develops with increasing heat treatment temperature, with the maximum texture intensity of 38 in HT1173. The intensity of the {110}β⟨113⟩β and Brass orientations is the highest in HT1073. It is noted that the intensity of the Goss, {110}β⟨113⟩β, and Brass orientations is close to zero in HT973.

The texture components formed in HT973, {113}β⟨110⟩β, {223}β⟨252⟩β, and {332}β⟨113⟩β are shown in Fig. 8(b). These orientations are formed only in HT973 but not in HT1173 and HT1073 (intensity was near zero). The texture component dramatically switched when the heat treatment temperature is decreased from 1073 K to 973 K.
3.4 Microstructure of HT specimens
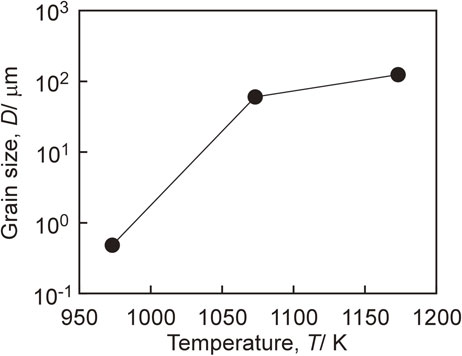
Figure 9 shows the IPF (ND) maps and GROD maps of the β phase for HT1173–HT973 and the α phase for HT973. Equiaxed recrystallized grains of the β phase were observed in HT1173 and HT1073. On the other hand, a duplex microstructure of the β and α phase was observed in HT973. The grain size and area fraction of the α phase in HT973 were 0.4 µm and 33%, respectively. Figure 10 shows the heat treatment temperature dependence of the β grain size: the grain size decreased with decreasing heat treatment temperature. In particular, the microstructure in HT973 was extremely fine, and the β grain size decreased from 60.8 µm to 0.5 µm with a decrease in the heat treatment temperature from 1073 K to 973 K. It has been reported that secondary recrystallization is responsible for the development of the Goss orientation as the preferred orientation in grain-oriented silicon steels.33) However, in the present study, no large grains were observed, regardless of the heat treatment temperature. The average sizes of the Goss-oriented grains in HT1173 and HT1073 are 140.3 and 77.2 µm, respectively. The average sizes of the grains not showing the Goss, {110}β⟨113⟩β, and Brass orientations (that is, orientations not formed as a texture component in HT1173 and HT1073) are 132.3 and 50.3 µm, respectively.
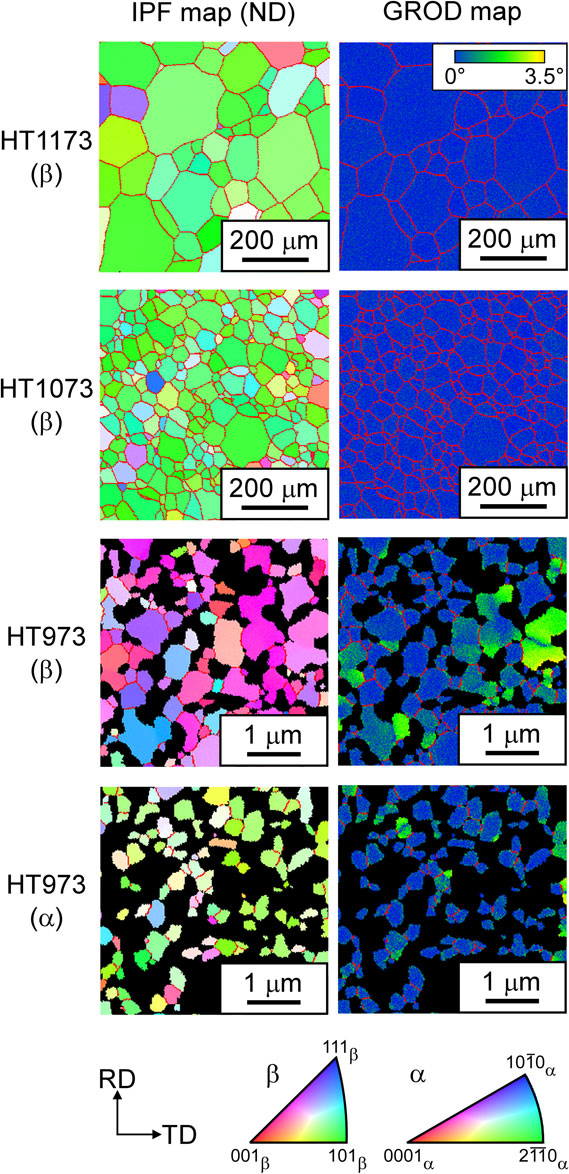
GROD maps, which are indicators of strain in the crystal map, are shown in the right column of Fig. 9. These are shaded according to the angular deviation to the reference orientation for the grain to which the point corresponds to. High GROD grains (>2°) of the α and β phase exist in the GROD maps for HT973, while the grains in HT1173 and HT1073 show a low GROD. The high GROD in the case of HT973 is thought to be associated with the high density of dislocations induced by cold-rolling.
The texture and microstructure (grain size and GROD) in HT973 appear to be different from those of HT1173 and HT1073, therefore the microstructure in HT973 was investigated in detail by TEM observations. Figures 11(a) and (b) show the bright-field (BF) image and selected-area diffraction pattern (SADP) of HT973. The key diagram of the SADP is shown in Fig. 11(c). Fine grains and a Debye ring-like pattern of the α and β phases were observed. In addition, a contrast of the dislocations induced by cold-rolling was observed, and the specimen was not recrystallized completely. A dark-field (DF) image of the α phase is shown in Fig. 11(d). The DF image was formed using the reflection indicated by the thick circle in Fig. 11(b). The globular α phase was observed to exist at the grain boundary. These results were consistent with those of the EBSD analysis.

Texture of β phase in HT973 is considered to be formed by recrystallization and/or reverse transformation from α′′ to β (and recovery) because HT973 was not recrystallized completely. Especially, it is likely that {113}β⟨110⟩β is not formed by reverse transformation because all the orientations of α′′ that correspond to {113}β⟨110⟩β do not satisfy the condition of candidate textures in the CR specimen mentioned in section 3.2: $(142)_{{\alpha ''}}[2\bar{1}1]_{{\alpha ''}}$, $(\bar{1}24)_{{\alpha ''}}[\bar{2}1\bar{1}]_{{\alpha ''}}$, $(14\bar{2})_{{\alpha ''}}[\bar{2}11]_{{\alpha ''}}$, $(\bar{1}\bar{2}4)_{{\alpha ''}}[211]_{{\alpha ''}}$, $(320)_{{\alpha ''}}[00\bar{1}]_{{\alpha ''}}$, and $(\bar{3}02)_{{\alpha ''}}[0\bar{1}0]_{{\alpha ''}}$ correspond to $(113)_{\beta }[1\bar{1}0]_{\beta }$. The definition of those six lattice correspondence variants is given in Ref. 21). The results of microstructure observation also imply that complete recrystallization of the specimen is critical for Goss orientation formation in the Ti–5.5Mo–8Al–6Zr alloy. In previous study, two mechanisms are proposed to understand the change in orientation by α phase precipitation. One is the possibility of α phase precipitation in the highly strained region, and the other case is the pinning of particular grain boundaries especially the grain boundary of the Goss, {110}β⟨113⟩β, and Brass oriented grains.23) Highly strained regions such as shear bands and grain boundaries are preferential nucleation sites for precipitation and the initiation sites for recrystallization. When α phase precipitation at these preferential sites occurs before recrystallization, the recrystallization behavior is strongly affected by the precipitation in the present alloy. The formation mechanism of the α phase and the effect of the α phase on the recrystallization texture are unclear, however, TEM observation results in this study support the mechanism proposed.
4. Conclusion
The effect of the heat treatment temperature on the evolution of the recrystallization texture was investigated in cold-rolled Ti–5.5Mo–8Al–6Zr (mol%) alloy sheets and the following conclusions were drawn:
-
(1)
α′′ martensite was induced by cold-rolling. The deformation texture of α′′ martensite could not be detected, but the formation of $\{ 130\} _{{\alpha ''}}\langle 3\bar{1}0\rangle _{{\alpha ''}}$ and (100)α′′[010]α′′ textures was proposed.
-
(2)
The specimens heat-treated at 1073 K or higher consisted of a single β phase. Goss, {110}β⟨113⟩β, and Brass orientations were formed as the recrystallization textures in these specimens. In particular, the Goss orientation strongly developed with increasing heat treatment temperature and became the dominant component in the specimens heat-treated at 1173 K.
-
(3)
The specimen heat-treated at 973 K consisted of the β + α phase. {113}β⟨110⟩β, {113}β⟨141⟩β, {223}β⟨252⟩β, {223}β⟨692⟩β, and {332}β⟨113⟩β were formed in this specimen, and the texture components observed in the specimens heat-treated at 1073 K or higher vanished. The α phase formed $\{ 11\bar{2}0\} _{\alpha }\langle 1\bar{1}00\rangle _{\alpha }$–$\{ 11\bar{2}2\} _{\alpha }\langle 1\bar{1}00\rangle _{\alpha }$. TEM observations revealed that the specimen heat-treated at 973 K was not completely recrystallized.
Acknowledgments
This work was supported by the Japan Society for the Promotion of Science (Grant numbers Wakate B: 17K14833, Wakate A: 17H04959, Kiban S: 26220907, and Kiban B: 18H01728).
REFERENCES
- 1) M. Niinomi: Metall. Mater. Trans. A 33 (2002) 477–486.
- 2) M. Niinomi: Sci. Technol. Adv. Mater. 4 (2003) 445–454.
- 3) W. Haider, N. Munroe, C. Pulletikurthi, P.K.S. Gill and S. Amruthaluri: J. Mater. Eng. Perform. 18 (2009) 760–764.
- 4) T. Inamura, Y. Kinoshita, J.I. Kim, H.Y. Kim, H. Hosoda, K. Wakashima and S. Miyazaki: Mater. Sci. Eng. A 438–440 (2006) 865–869.
- 5) T. Inamura, Y. Yamamoto, H. Hosoda, H.Y. Kim and S. Miyazaki: Acta Mater. 58 (2010) 2535–2544.
- 6) H.Y. Kim, T. Sasaki, K. Okutsu, J.I. Kim, T. Inamura, H. Hosoda and S. Miyazaki: Acta Mater. 54 (2006) 423–433.
- 7) L. Wang, W. Lu, J. Qin, F. Zhang and D. Zhang: Mater. Charact. 61 (2010) 535–541.
- 8) M.F. Ijaz, H.Y. Kim, H. Hosoda and S. Miyazaki: Mater. Sci. Eng. C 48 (2015) 11–20.
- 9) L.L. Pavón, H.Y. Kim, H. Hosoda and S. Miyazaki: Scr. Mater. 95 (2015) 46–49.
- 10) Y. Shinohara, M. Tahara, T. Inamura and H. Hosoda: J. Japan Inst. Met. Mater. 80 (2015) 45–50.
- 11) J. Fu, H.Y. Kim and S. Miyazaki: J. Mech. Behav. Biomed. Mater. 65 (2017) 716–723.
- 12) T. Inamura, R. Shimizu, H.Y. Kim, S. Miyazaki and H. Hosoda: Mater. Sci. Eng. C 61 (2016) 499–505.
- 13) H. Tobe, H.Y. Kim and S. Miyazaki: J. Japan Inst. Metals 72 (2008) 965–969.
- 14) F.W. Ling, E.A. Starke and B.G. Lefevre: Metall. Trans. 5 (1974) 179–187.
- 15) J. Fu, A. Yamamoto, H.Y. Kim, H. Hosoda and S. Miyazaki: Acta Biomater. 17 (2015) 56–67.
- 16) H.Y. Kim, T. Fukushima, P.J.S. Buenconsejo, T.-h. Nam and S. Miyazaki: Mater. Sci. Eng. A 528 (2011) 7238–7246.
- 17) H.Y. Kim, N. Oshika, J.I. Kim, T. Inamura, H. Hosoda and S. Miyazaki: Mater. Trans. 48 (2007) 400–406.
- 18) H.Y. Kim, Y. Ikehara, J.I. Kim, H. Hosoda and S. Miyazaki: Acta Mater. 54 (2006) 2419–2429.
- 19) H.Y. Kim, J. Fu, H. Tobe, J.I. Kim and S. Miyazaki: Shap. Mem. Superelasticity 1 (2015) 107–116.
- 20) L.L. Pavón, E.L. Cuellar, S.V. Hernandez, I.E. Moreno-Cortez, H.Y. Kim and S. Miyazaki: J. Alloys Compd. 782 (2019) 893–898.
- 21) M. Tahara, N. Okano, T. Inamura and H. Hosoda: Sci. Rep. 7 (2017) 15715.
- 22) K. Hiramatsu, M. Tahara, T. Inamura, H. Hosoda and S. Miyazaki: Mater. Sci. Forum 738–739 (2013) 262–266.
- 23) T. Sasaki, K. Hiramatsu, M. Tahara, H. Hosoda, S. Miyazaki and T. Inamura: Adv. Mater. Res. 922 (2014) 622–625.
- 24) Y. Shinohara, D. Narita, M. Tahara, H. Hosoda and T. Inamura: Mater. Trans. 57 (2016) 1998–2001.
- 25) B. Sander and D. Raabe: Mater. Sci. Eng. A 479 (2008) 236–247.
- 26) T. Inamura, Y. Fukui, H. Hosoda, K. Wakashima and S. Miyazaki: Mater. Trans. 45 (2004) 1083–1089.
- 27) M. Tane, S. Akita, T. Nakano, K. Hagihara, Y. Umakoshi, M. Niinomi and H. Nakajima: Acta Mater. 56 (2008) 2856–2863.
- 28) Y. Shinohara, Y. Matsumoto, M. Tahara, H. Hosoda and T. Inamura: Materialia 1 (2018) 52–61.
- 29) T. Inamura, H. Hosoda, K. Wakashima and S. Miyazaki: Mater. Trans. 46 (2005) 1597–1603.
- 30) Z. Guo, S. Malinov and W. Sha: Comput. Mater. Sci. 32 (2005) 1–12.
- 31) H. Hu: Texture 1 (1974) 233–258.
- 32) W.G. Burgers: Physica 1 (1934) 561–586.
- 33) Z. Xia, Y. Kang and Q. Wang: J. Magn. Magn. Mater. 320 (2008) 3229–3233.