Abstract
Solidification of aluminum plate and cylinder was analyzed by tracing the flow of latent heat of solidification from liquid-solid interface to surface and therefrom to outside by heat transfer. Temperature drop at surface below melting point during the solidification was found to be related closely to the thickness of solid layer for each mode of solidification. Temperature gradient set by the above relation enabled to estimate the growing rate of solid layer. Repetition of above calculations from the beginning of solidification revealed the times for solid layer to attain varied thicknesses. Thus the solidification times of plate and cylinder with varied size and varied coefficient of heat transfer were calculated. The results of calculation were shown in numerical tables for each mode of solidification. Solidification of the superheated aluminum plate was analyzed by use of parabolic distribution of temperature in liquid before and during the solidification.
This Paper was Originally Published in Japanese in Japan Inst. Met. Mater. 83 (2019) 124–127.
1. Introduction
When molten aluminum is cast in a metal mold, solidification proceeds by the flow of latent heat of solidification from surface to outside. In continuous casting, molten metal is cast into water-cooled metal mold then cooled by direct water spray during solidification. These flows of heat from surface to outside during the solidification are considered to be “heat transfer” in engineering term. Although solidification of metal induced by heat transfer has been studied,1,2) the knowledge about it seems to be insufficient.
Solidification of aluminum plate and cylinder was analyzed by tracing the flow of latent heat of solidification from the liquid-solid interface to surface and therefrom to outside by heat transfer. Growth of solid layer and temperature drop at surface below melting point during solidification were investigated numerically. To simplify the calculation, temperature at outside and the heat transfer coefficient were supposed to be constant during solidification. Sizes of plate and cylinder as well as heat transfer coefficient were supposed to be variables in the analysis. Heat transfer coefficient was varied from 0.05 to 0.4 W/cm2 °C, taking into consideration that the cooling ability of water in quenching of steel was about 0.4, which was almost equal to heat transfer coefficient 0.4 W/cm2 °C.3)
Solidification of superheated aluminum plate was also analyzed by the use of “Direct Solving Method of Differential Equation4)” (DSM). This report shows how to analyze the solidification induced by heat transfer and its results with the discussion on it.
2. Solidification of Plate without Superheat
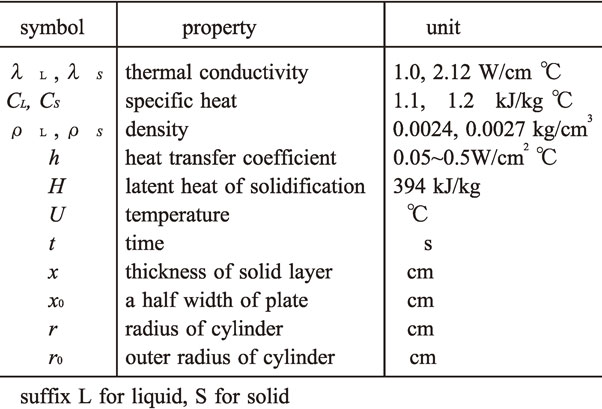
A commercial personal computer is used for the calculations in this study. Symbols of thermal constants and their numerical values are listed in Table 1. Solidification of molten aluminum plate at 660°C is supposed to be induced by heat transfer with its coefficient h from surface to outside at 0°C. The growth rate of solid layer during solidification is generally expressed by following equation.1)
| \begin{equation}
\rho H\,\mathrm{d}x/\mathrm{d}t = \lambda_{\text{S}}(\mathrm{d}U/\mathrm{d}x)_{\text{solid}}-\lambda_{\text{L}}(\mathrm{d}U/\mathrm{d}x)_{\text{liquid}}
\end{equation}
| (1) |
Because the second term in the right side of
eq. (1) disappears when superheat is absent,
eq. (1) changes to
| \begin{equation*}
\rho H\,\mathrm{d}x = \lambda_{\text{S}}(U_{\text{M}}-U_{\text{S}})\mathrm{d}t/x
\end{equation*}
|
where
UM and
US stand for melting point and temperature at surface respectively. When the temperature drop at surface below melting point is expressed by
ΔU, above equation changes to
2)
| \begin{equation}
\mathrm{d}x = \varDelta U\lambda_{\text{S}}\,\mathrm{d}t/(\rho H x)
\end{equation}
| (2) |
Because heat flux into the surface is equal to the heat flux from surface to outside by heat transfer, following equations are given;2)
| \begin{equation*}
\lambda_{\text{S}}\varDelta U/x = h (660 - \varDelta U)
\end{equation*}
|
| \begin{equation*}
\therefore\lambda_{\text{S}}/hx = (660 - \varDelta U)/\varDelta U
\end{equation*}
|
| \begin{equation*}
1+\lambda_{\text{S}}/hx = 660/\varDelta U
\end{equation*}
|
| \begin{equation}
\varDelta U = 660/(1 +\lambda_{\text{S}}/hx)
\end{equation}
| (3) |
Reciprocal of λ
S/
hx in
eq. (3), namely
hx/λ
S, is known as Biot’s number which has no dimension.
Putting ΔU obtained by eq. (3) into eq. (2) yields dx, which is cumulated to x. Repetition of the calculations eq. (3) and eq. (2), and cumulations of dx and dt enables to give the solidification time of any sized plate. A special technique is necessary in the beginning of calculation of eq. (3). In order to get the size of initial dx, x = 0.001 cm and dt = 0.01 sec. are put in eq. (3), for example. In place of putting x = 0.001 cm in eq. (3), any value of x is useful unless the initial size of x (= dx) changes appreciably.
Table 2 shows the effect of thickness of solid layer x0 and heat transfer coefficient h on the time of solidification tF. Equation (2) shows that the growth rate of x is constant if the temperature gradient is kept constant. Actually, the temperature gradient is nearly constant, as will be seen later. Hence, the time of solidification is basically proportional to the thickness of solid layer. Growth of solid layer, however, increases temperature drop ΔU, which decreases the difference in temperature between surface and outside. Therefore, cooling rate at surface slows down and solidification time becomes longer than that is proportional to thickness. Time of solidification is inversely proportional to the heat transfer coefficient basically, as the temperature drop ΔU increases in proportion to heat transfer coefficient. Time of solidification is increased in addition by the increased ΔU which slows down cooling rate. Table 2 shows such a complex effect of the layer thickness of solid and heat transfer coefficient on the time of solidification as described above.

Table 2 Solidification time tF/s of aluminum plate.
To investigate the solidification of a plate more precisely, a half thickness of plate, or size x0, is divided into 10 divisions. Node number from 0 to 10 are given to every dividing point including center and surface in order from center. Distance between neighboring node Δx becomes x0/10. When liquid-solid interface locates at x from surface and between node number p and p − 1, relation x = (10 − p)Δx + a is valid, when a stands for the distance between interface and node p. Then da = dx becomes useful. Temperature at node i, Ui is expressed by
| \begin{equation}
U_{i} = 660-(10-i)\cdot\varDelta U/(10-p)
\end{equation}
| (4) |
At the start of solidification,
p = 10 is assumed. Solidification proceeds gradually at every time of repeated calculations of
eq. (3),
eq. (2) and cumulations of d
x and d
t. At every time when
a ≧
Δx,
p is replaced with
p − 1 and
a is replaced with
a −
Δx. When
p becomes 0, solidification ends.
Figure 1 shows distribution of temperature at every time when p decreases, under the solidification conditions with x0 = 2 cm and h = 0.2 W/cm2 °C. Times after start of solidification are added to every distribution lines of temperature, which show the increase in time intervals between distribution lines as solidification proceeds. Although distribution lies in Fig. 1 seems parallel at first sight, precise examination reveals that the inclination of lines decreases gradually as solidification proceeds.
Figure 2(a) and (b) show the effect of heat transfer coefficient on the temperature distribution during solidification. They show that the inclination of temperature distribution line, or temperature gradient, doubles roughly, when heat transfer coefficient doubles.
Figure 3 shows cooling curve of 10 divisions of a plate during solidification which is composed by arranging the notes of temperature shown in Fig. 1 in order of time, followed by Newton’s cooling.5) Figure 3 shows the familiar pattern of cooling curve at the center of pure metal ingot.
3. Solidification of Plate with Superheat
Superheated metal cast in a metal mold is supposed to be cooled by diffusion of heat in the same mode as that of solid metal.5) Then distribution of temperature in liquid becomes parabolic until the temperature at surface reaches melting point. Thereafter the growth rate of solid layer is expressed by eq. (1). When liquid-solid interface locates between node p and p − 1, eq. (1) turns to
| \begin{equation}
\mathrm{d}a = [\lambda_{\text{S}}\varDelta U/x - \lambda_{\text{L}} (U_{p-1} - 660)/(\varDelta x - a)]\mathrm{d}t/(\rho H)
\end{equation}
| (5) |
Ui in liquid is expressed as follows by the use of parabolic distribution of temperature5) during cooling.
| \begin{equation}
U_{p-1} = U_{0}-(U_{0} - 660)\cdot (p-1)^{2}/(p-a/\varDelta x)^{2}
\end{equation}
| (6) |
According to DSM d
U0 is expressed by
| \begin{equation}
\mathrm{d}U_{0} = 2\mathrm{d}T^{*}\cdot(U_{0}-U_{1})
\end{equation}
| (7) |
where d
T* = λ
L d
t/(c
Lρ
LΔx2).
dUi between node number i = 1 to p − 2 is expressed by
| \begin{equation}
\mathrm{d}U_{i} = \mathrm{d}T^{*}\cdot(U_{i+1}-2U_{i}+U_{i-1})
\end{equation}
| (8) |
On the other hand, temperature in solid layer is calculated by eqs. (3), (4), (5). At the start of calculation eq. (3), a special technique is necessary like the case without superheat.
Figure 4 shows temperature distribution in plate during 10 second after casting at 720°C. Figure 4 shows that the distribution of temperature in liquid becomes almost horizontal when fraction of solid becomes about 0.2.
Figure 5 shows temperature distribution at whole stage of solidification under the same conditions as that of Fig. 4. The time of complete solidification 40.7 second shown in Fig. 5 is 20% longer than 33.8 second shown in Table 2 under the same conditions without superheat. Whereas, increase in heat content by superheat 60°C corresponds to 15% of latent heat of solidification roughly, which seems fairly different from the ratio of solidification time.
Figure 6 shows a cooling curve of plate drawn by arranging the notes of temperature in order of time. The cooling curve at center in Fig. 6 seems familiar when molten metal is cooled in a crucible. But, when molten metal is cast in a metal mold, temperature at center drops much more quickly to melting point in fact, probably because of turbulent flow of molten metal during pouring.
4. Solidification of Cylinder without Superheat
Solidification of cylinder resembles to that of plate as a whole. Therefore, only differences from the solidification of plate will be described mainly.
The pattern of temperature distribution in solid layer changes from strait line in plate to logarithmic line in cylinder, therefore, eq. (2) changes to
| \begin{equation}
\mathrm{d}r = \varDelta U\lambda_{\text{S}}\,\mathrm{d}t/[\rho H r\ln(r_{0}/r)]
\end{equation}
| (9) |
changes to
| \begin{equation}
\varDelta U = 660/\{1+\lambda_{\text{S}}/[h r_{0} \ln(r_{0}/r)]\}
\end{equation}
| (10) |
At the beging of simulating calculation, r0 = 2 cm, r = 1.99 cm, dt = 0.01 sec, for example, are put in eq. (10) to get initial dr. Then, initial r is obtained by r = r0 − dr. Afterwards, calculations of eq. (9), replacing r with r − dr and eq. (10) are repeated until r becomes 0.
Table 3 shows the effect of cylinder size and heat transfer coefficient on the solidification time. Comparison of solidification times of cylinder in Table 3 with that of plate in Table 2 reveals that their ratio is exactly 1/2 when the size and heat transfer coefficient are equal. This value, 1/2 coincides well with the ratio of volume to surface area for same-sized plate and cylinder. Therefrom, the solidification times of plate and cylinder are basically proportional to volume to surface area when their sizes and heat transfer coefficient are equal.

Table 3 Solidification time tF/s of aluminum cylinder.
The ratio of cooling rate at surface of solid aluminum plate, cylinder and sphere induced by heat transfer is 1 : 2 : 3,5) which corresponds to the ratio of surface area to volume. That is, cooling times are proportional to the ratio of volume to surface area, too. On the other hand, solidification times of casting solidified in sand mold are proportional to volume to surface area squared.6) This difference in proportion seems to come from the difference in heat flow, heat transfer or diffusion, between the metal surface and outside.
5. Conclusions
The results of this study are summarized as follows:
-
(1)
Equations to express the relation between thickness of solid layer in molten aluminum and temperature drop at surface below melting point are created for plate and cylinder geometry respectively.
-
(2)
Algorithm to describe growth of solid layer in molten aluminum is created using the result of above calculation.
-
(3)
Solidification times of plate and cylinder without superheat are listed in tables as function of size and heat transfer coefficient, respectively. Solidification times listed in tables are essentially proportional to size of ingot and inversely proportional to heat transfer coefficient. Additional time from the proportion is considered to be resulted from the increased temperature drop at surface during solidification.
-
(4)
Solidification of superheated plate is able to calculate by the use of parabolic distribution of temperature before and during the solidification.
Acknowledgment
Software “Jisshin basic” was used in this study. Author wishes to express his hearty thanks to K. Siraishi for his publishing the software.
REFERENCES
- 1) I. Onaka: Kompyuta den-netu gyouko nyumon, (Maruzen, Tokyo, 1985) (in Japanese).
- 2) E. Niiyama: Chuzo den-netu kogaku, (Agune gijutu center, Tokyo, 2001) (in Japanese).
- 3) T. Araki (ed.): Tekko kogaku koza, vol. 8 hagane no netushori gijutu, (Asakura Shoten, Tokyo, 1969) (in Japanese).
- 4) G.D. Smith: Numerical Solution of Partial Differential Equations, (trans. by Fujikawa, Saiensusha, Tokyo, 1971) (in Japanese).
- 5) T. Owadano: J. Japan Inst. Metals Mater. 82 (2018) 183–187 (in Japanese).
- 6) M. Sugiyama (ed.): Chuzo-gijutu no Kiso, (Sogo-imono center, Tokyo, 1978) (in Japanese).