1. Introduction
Titanium and its alloys are widely used as endosseous implants in dentistry due to their favorable biocompatibility, corrosion resistance and mechanical properties.1,2) However, titanium is bioinert, and hence some form of surface modification is required to enhance the osseointegration performance. Previous studies2–4) have shown that modifying the surface topography, or depositing bioactive material coatings, can significantly improve the adhesion, proliferation and differentiation of cells seeded on titanium surfaces. However, further improvements in the osseointegration performance are still required to shorten the healing time and improve the bonding strength of the implant to the bone tissue.5)
Most commercially available dental implants feature some form of surface modification to enhance their surface roughness. Several studies have shown that micro- and nanoscale surface roughness is beneficial in enhancing the osseointegration and biomechanical fixation of dental implant materials both in vitro and in vivo.6,7) Moreover, changing the surface composition by using physiochemical methods to induce titanium oxide layers, or bond functional groups to the surface, also appears to provide a promising approach for stimulating cell activity.8,9) Laser ablation (LA) is a convenient and straightforward means of patterning biomedical substrates with microscale surface roughness.10) Mwenifumbo et al. showed that the micro-groove texture obtained by LA processing results in a strong orientation of the cells in the groove direction.11) The literature contains many studies on the use of ultraviolet (UV) lasers to pattern micro grooves with various geometries and textures on titanium surfaces.11–16)
Previous studies on the cell proliferation effect of micrometer and nanometer structures have considered the use of both chemical methods17) and laser ablation methods10) to modify the surface. The chemical methods produced irregular micro-pits or dimple-like micrometer- and nanometer-hybrid structures. By contrast, the laser ablation methods produced regular microscale or nanoscale geometries. Thus, while the effects of micrometer- and nanometer-hybrid structures produced by chemical methods on the cell behavior (proliferation) are reasonably clear, the literature lacks a detailed investigation into the interaction effect between laser ablation-induced micrometer- and nanometer-hybrid structures and cells. Moreover, many studies have examined the growth behavior of biological cells on material surface using fibroblasts, human bone osteosarcoma cell line MG-63, and osteoblastic cell line MC3T3-E1.10,15,18) However, the effects of the morphology and size of the micrometer- and nanometer-hybrid structures produced by laser ablation on the adhesion and proliferation of osteoblast cells are not yet fully understood.
Accordingly, in the present study, titanium substrates were treated by UV laser ablation with travel speeds in the range of 10∼300 mm/sec to investigate the effect of the resulting micro- and nanoscale hybrid surface structures on the cell proliferation behavior. The effects of surface structure scale and process parameters on cell growth were investigated. The microstructure, chemical composition and Ti compounds formed on the LA surfaces were investigated by optical microscopy (OM), scanning electron microscopy (SEM), energy-dispersive X-ray spectroscopy (EDS) and X-ray diffraction (XRD). Rat calvarial osteoblast cells were cultured on the various samples for 1∼7 days. The proliferation of the cells on the sample surfaces was examined by means of MTT (3-(4,5-Dimethylthiazol-2-yl)-2,5-diphenyl tetrazolium bromide) dye-reduction assays. The results showed that the cells exhibited a significantly better adhesion and proliferation behavior than those seeded on sandblasted acid-etched (SA) or machined (MA) titanium surfaces, respectively.
3. Results and Discussion
3.1 Surface morphology
Figure 2 presents SEM micrographs showing the surface morphologies of the LA, SA and MA samples. The LA sample ablated with a travel speed of 10 mm/sec contains deep and narrow grooves with a width of approximately 5.44∼10.03 µm (Fig. 2(a)). As the travel speed is increased to 50 mm/sec, the groove width increases to around 9.84∼16.88 µm (Fig. 2(b)). Finally, for the maximum travel speed of 300 mm/sec, the grooves are shallower and the width increases to approximately 10.97∼20.06 µm (Fig. 2(c)). In contrast to the LA samples, the surface of the SA sample contains irregular micro-pits or dimple-like structures with a size of around 0.29∼2.58 µm (Fig. 2(d)). Finally, the MA sample has a smooth surface with only minor scratches (Fig. 2(e)). (Note that a detailed analysis of the surface metrology of the various samples is shown in Table 2.)

Table 2 Surface metrology results for MA, SA and LA samples.
In the LA process, the heat input to the sample surface is determined mainly by the laser travel speed. In particular, at low speeds (i.e., 10 mm/sec and 50 mm/sec), the heat energy density per pulse is increased, and hence the material surface undergoes a greater melting effect. Moreover, the melt pools formed in successive pulses overlap, and hence a groove-like geometry is produced as the laser beam travels over the sample surface. However, at high travel speeds (i.e., 300 mm/s), the heat energy density per pulse reduces, and consequently, the melt pool depth also reduces. Furthermore, the melt pools are more widely separated, and hence a series of shallow ripples are produced on the sample surface.
Figure 3 presents OM images of the LA, SA and MA sample cross-sections. A quantitative analysis of the various cross-sections shows that the surfaces of the S10, S50 and S300 samples have a micro scale characteristic (greater than 1 µm) and the depth range was reduced from 35.3 to 4.5 µm. By contrast, the SA sample has a submicron depth (less than 1 µm but greater than 100 nm) with an average value of 0.7 µm (see Table 2). For the LA samples, the laser ablated depth and depth-to-width (D/W) ratio increase with a decreasing laser travel speed. However, the D/W ratio has a value of just 0.29 at the highest laser speed of 300 mm/sec. Consequently, the surface has a shallow wave-like morphology (Fig. 3(c)) rather than a deep groove-like structure, as for the samples processed at lower travel speeds of 10 mm/sec and 50 mm/sec, respectively (Figs. 3(a) and 3(b)). The D/W ratio of the SA sample is slightly higher than that of the LA sample processed at 300 mm/sec, respectively, but is significantly lower than that of the LA sample ablated at 10 mm/sec. Finally, the MA sample has a smooth surface with a D/W ratio equal to zero.

Figures 4(a)∼(c) present high-magnification SEM images of the groove/wave surfaces of the LA samples ablated at laser travel speeds of 10, 50 and 300 mm/sec, respectively. The images show that the rapid melting and subsequent solidification of the sample surface results in the formation of agglomerate structures with a nanoscale dimension on the groove surface.19) As the laser travel speed increases, the agglomerate size decreases (see Fig. 4(d)). In particular, the agglomerate size reduces from around 100 nm at a travel speed of 10 mm/sec to just 30 nm at a speed of 300 mm/sec.

In general, the results presented in Figs. 3 and 4 confirm the effectiveness of the LA technique in controlling the geometry of the ablated surface (e.g., grooves or waves) and producing a mixed hybrid micro- and nanoscale structure. Previous studies have reported that the geometry and structure of LA surfaces depends on many factors, including the type of laser source, the wavelength, the pulse repetition rate, the travel speed, the pulse duration, and the output power.20) These parameters have a significant effect on both the amount of heat input to the sample and the subsequent cooling rate, and therefore lead to obvious changes in the microstructure, topography and chemical composition of the ablated surface. The adhesion, growth and proliferation of cells on metal and alloy surfaces depend significantly on the surface roughness and geometry.21) Fancsaly et al.20,22) ablated substrates with an IR pulsed laser with a wavelength of 1064 nm and found that many microscale asperities were produced on and between the ablated grooves on the sample surface. The asperities were found to have an average size of approximately 10–50 µm. By contrast, in the present study, the agglomerations on the UV laser-ablated surfaces have a characteristic scale in the order of just nanometers. Previous studies have reported that a nanoscale surface texture is beneficial in promoting cell spreading with extended filopodia in the early growth stage.17,23) Hence, it is reasonable to infer that the nanostructures formed on the micro-grooves produced in the present LA samples should also enhance the attachment and differentiation of biological cells. Furthermore, given that the size of the nanostructures increases with a decreasing laser travel speed, it is also reasonable to assume that the LA samples processed at lower speeds of 10 mm/sec and 50 mm/sec, respectively, will provide a better cell proliferation performance (see Section 3.3).
3.2 EDS and XRD analysis of LA, SA and MA samples
Figure 5 presents the EDS spectra of the MA, LA and SA samples. The detailed analysis results are presented in Table 3. It is seen that the surfaces of the MA and SA samples are composed exclusively of Ti. By contrast, the LA samples contain both Ti and oxygen (O). Figure 6 shows the XRD patterns of the LA, SA and MA samples. The LA sample processed at the lowest travel speed of 10 mm/sec consists of pure Ti together with TiO and TiN0.3 phases (see pattern S10). For a higher travel speed of 50 mm/sec, the surface contains pure Ti and TiN0.3 phase (see pattern S50). However, for the highest travel speed of 300 mm/sec, the surface contains only Ti (see pattern S300). In other words, the formation of TiO and TiN0.3 phases reduces with an increasing travel speed. The TiO and TiN0.3 phases are produced as a result of the reaction between the Ti content of the ablated surface and the O and N contents of the ambient environment. At a higher travel speed, the ablated surface cools more rapidly. Consequently, the reaction time with the environment is reduced, and hence the quantity of formed TiO and TiN0.3 phase also reduces. TiO is a metastable phase and thus cannot be reliably detected by EDS (see Fig. 5). However, its existence can be detected and confirmed by XRD (see Fig. 6), as reported also in the literature.24) The MA and SA surfaces consist mainly of Ti (see patterns MA and SA in Fig. 6). However, the SA pattern also contains several small peaks corresponding to TiH2 originating from the hydrochloric and sulfuric solution used in the etching process.


Table 3 Semi-quantitative EDS analysis results for MA, SA and LA samples.
It has been reported that the presence of a titanium oxide layer on the surface of biomedical implants promotes biocompatibility and bone healing.25,26) In addition, titanium oxide has good blood compatibility and corrosion resistance.27) Allegrini et al.28) ablated a titanium surface using a Nd:YAG laser under ambient conditions. The ablated surface was found to have a high oxygen concentration.29) By contrast, the LA samples processed in the present study with a low laser travel speed (i.e., 10 mm/sec and 50 mm/sec) have an oxide layer on the surface, and are hence expected to provide a better cell growth.
3.3 Cell proliferation
Figure 7(a) shows the MTT assay results for the LA, SA and MA samples after culturing periods of 1∼7 days. For all five samples, the cell proliferation increases with an increasing culturing time. For culturing periods of 1 and 3 days, the OD value is less than 0.4 in every case and no significant difference is observed between the cell proliferation rates of the different samples (p > 0.05). After 5 days, a significant difference is observed between the MA, LA-S10 and SA samples (p < 0.05). However, no statistically significant difference (p > 0.05) is noted between the MA, LA-S50 and LA-S300 samples. After 7 days, noticeable differences in the proliferation rates of all the samples are observed. In particular, the OD values of the five samples are ranked as S10 > S50 > S300 > SA > MA. In other words, the proliferation rates of the samples treated by LA are higher than those of the samples treated by SA or MA. Furthermore, the cell proliferation rate increases as the laser travel speed decreases. The detailed analysis results presented in Fig. 7(b) show that the cell proliferation rate of the LA surface processed at 10 mm/sec is significantly higher than that of the SA or MA surface (p < 0.001). Moreover, the proliferation rate of the S10 sample is significantly higher than that of the S50 or S300 sample (p < 0.05). Consequently, the effectiveness of the deep groove surface structure and nanoscale agglomerates in enhancing the cell proliferation rate is confirmed.
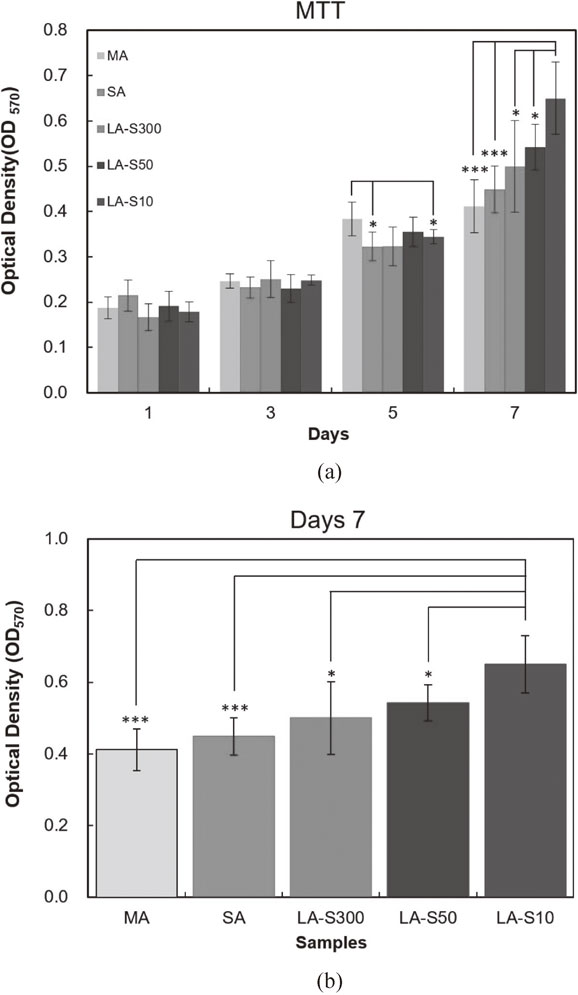
Figure 8 presents SEM images of the MA, SA and LA sample surfaces following culturing for 7 days. It is seen that the cells have a long strip-like morphology in every case. Figure 8(a) shows that the MA surface contains relatively few filopodia and lamellipodia. By contrast, the LA surface contains a large number of filopodia (Fig. 8(b)). Finally, the SA surface shows no obvious pseudopodia (Fig. 8(c)). Overall, the results therefore suggest that the nanosurface of the LA sample is beneficial in promoting cell growth.30)

Chen et al.15) showed that human osteo-sarcoma (HOS) cells seeded on a laser-ablated Ti6Al4V grooved surface showed a strong directional guidance effect; particularly for groove widths in the range of 8∼12 µm. In general, the topography or roughness of nanoscale surfaces improves cell adhesion and proliferation. In particular, a nanoscale topography alters the protein interaction with the surface. A previous study found evidence of increased osteoblast adhesion on nanosurfaces compared to that of fibroblasts.31) In addition, Matsugaki et al. showed that laser-induced periodic structures induced cell alignment, while surfaces with an anisotropic geometry and a fine-dot structure did not induce a preferential osteoblast orientation.32) In the present study, the nanoscale agglomerates produced by the laser ablation process have an anisotropic structure. Therefore, the cells show no strong orientation effect in the growth process. Comparing the three samples, the MA surface is smooth, while the SA surface has irregular micro-pits, and the LA surface is discontinuous. However, the rat calvarial osteoblasts on the three surfaces all have a long strip-like morphology. In other words, no obvious difference in the cell morphology is observed despite the difference in the surface characteristics. Furthermore, for the LA samples (with groove widths ranging from around 5∼20 µm), no obvious directional guidance of the rat calvarial osteoblast cells is observed. The discrepancy between this finding and as reported previously32) is interesting and will be investigated in a future study.
Generally speaking, the adhesion behavior of osteoblasts is more sensitive than that of MG63 cells.33) Therefore, the morphology characteristics of the present osteoblast cells after culturing are significantly different from those of the MG63 cells reported in the literature.33) The ridge width between the grooves is of particular importance in facilitating cellular behavior.34–36) As described above, the present LA samples have a discontinuous groove-like surface structure (S10 and S50) or wave-like structure (S300). It may well be that the discontinuous nature of these surface structures inhibits the spreading of the cells in any particular direction. Moreover, the absence of a strong directional guidance effect may also suggest that rat calvarial osteoblasts have an inherently low contact sensitivity. However, the published literature contains scant information regarding the effects of LA surface features on osteoblast adhesion and contact guidance. Thus, as commented above, further research is required to clarify this issue in future studies.
Previous studies have reported that the proliferation of osteoblast cells on LA and SA surfaces is the same as that of MG63 cells. Moreover, the proliferation of MG63 cells on a smooth surface is better than that on a LA or SA surface.24,37) Conversely, for mouse osteoblastic (MC3T3-E1) cells and primary human osteoblastic-like cells, rough surfaces have a detrimental effect on the proliferation rate compared to polished surfaces.38) However, in the present study, no significant difference was observed in the early-stage proliferation of rat calvarial osteoblast cells grown on machined surfaces or LA surfaces. A previous study reported that the number of cells on a polished surface after 7 days of culturing was higher than that on a LA surface.39) However, the present results show that the proliferation rate of rat calvarial osteoblasts on LA surfaces is higher than that on SA or MA surfaces. It is speculated that the enhanced proliferation rate is due partially to the rougher surface of the LA samples compared to the SA and MA surfaces and partially to the effects of the nanoscale structures produced on the LA surface in changing the osteoblast response.40)
The LA processing of titanium has a particularly beneficial effect on cell proliferation when the pore structure dimension is similar to the cell size.28) The groove widths of the present samples processed using laser travel speeds of S10 and S50 (i.e., 5.44∼16.88 µm) are close to the mouse osteoblast cell size (around 5∼10 µm). Consequently, they provide a better cell growth performance than the sample processed at a higher travel speed of 300 mm/sec (groove width 10.97∼20.06). Many studies have shown that a microscale surface structure promotes cells growth, proliferation and adhesion.22,41,42) However, in recent years, several studies21,43) have indicated that a nanometer surface structure is also beneficial in enhancing cell proliferation and adhesion since it improves the adsorption behavior of the cellular protein in the growth process. Thus, in comparing the cell proliferation behaviors of the SA and MA samples, an improved performance was observed for the SA sample due to its mixed micro- and nanoscale structure.21,44) A similar tendency was observed in the study of Gittens et al.,17) who used the SA technique to pattern titanium samples with a hybrid micro- and nanoscale structure to promote cell growth. These results, together with those presented in the present study for the LA samples, suggest that a mixed microscale and nanoscale structure is beneficial in improving the biocompatibility of titanium-based bioimplants. Moreover, the effectiveness of the mixed structure in promoting cell proliferation is particularly apparent when the characteristic structure size approaches that of the cells.
Besides the scale of the structures on the sample surface, the geometry and surface topography of the sample also impact the cell growth. Previous studies7,45,46) used various techniques to roughen the sample surface, including SA, titanium plasma-spray, and anodization. It was shown that the SA method produced macro pores with a size of 25∼200 µm and micro pores with a scale of 0.5∼2.0 µm. Sul et al.47) showed that such rough surfaces promote cell adhesion, growth, proliferation and osseointegration both in vivo and in vitro. The present results have shown that LA surface treatment can also promote cell proliferation when the pore dimension is close to the osteoblast cell size. However, the mechanisms of osseointegration are rather complex. Hence, further studies are required to confirm whether the improved cell proliferation rate is accompanied by a better osseointegration performance.


