Abstract
The effects of C and Al concentrations on the specific resistance and rigidity of newly developed ultra-high strength titanium-based metal matrix composites (Ti-MMCs), fabricated using blended elemental reactive sintering (BERS), were investigated. Both TiC(1−X)/Ti–6Al–4V and Ti–8.6Al–5.7V composites were compared with TiB/, SiC/ and AlN/Ti-MMCs. TiC was found to react with Ti powder and to transform to TiC(0.50–0.62) during sintering. The resulting TiC(0.50–0.62)/Ti–8.6Al–5.7V exhibited a specific resistance of 2.33 µΩm, a Young’s modulus of 135 GPa and a tensile strength of 1.25 GPa, with a substantial elongation of approximately 2.5%. In contrast, TiB/Ti–6Al–4V showed excellent mechanical properties but an extremely low electrical resistance because the conducting TiB particles had a specific resistance of only 0.07 µΩm. Both SiC and AlN also reacted with Ti powder during sintering to form a brittle phase at the interfaces between the particles and the Ti matrix. As a result, Ti–6Al–4V MMCs suitable for use as structural materials could not be fabricated using BERS with SiC or AlN. The high specific resistance of the TiC(0.50–0.62)/Ti–8.6Al–5.7V is partly attributed to the C deficiency of the TiC(0.50–0.62) particles, which results in a specific resistance of approximately 1.7 µΩm. This value is approximately three times higher than the value of 0.52 µΩm for stoichiometric TiC particles. The solubility of excess C and Al in the Ti matrix also increases the specific resistance of the material.
This Paper was Originally Published in Japanese in J. Japan Inst. Met. Mater. 83 (2019) 97–106. The fifth author name was revised from Kiyoji Nakamura to Kiyoharu Nakamura. The bibliography information of an article for correction was listed in J. Japan Inst. Met. Mater. 83 (2019) 256.
1. Introduction
Titanium is an important raw material in the aerospace and automotive industries due to its high specific strength and superior heat and corrosion resistance compared to other lightweight materials, such as aluminum and magnesium alloys.1) However, steel is also widely used in the automotive industry, partly because titanium parts are generally too expensive for the consumer. In fact, the high cost for making titanium parts hinders their widespread mass production.
Interestingly, the recent, unprecedented revolution in powertrain design as a means of reducing CO2 emissions has led to significant changes. As such, new applications have been proposed for titanium, including as a separator material in fuel cell (FC) stacks.2) This separator is required to have a high strength to weight ratio in addition to superior corrosion resistance under extremely severe conditions. It has been reported that the total cost of an FC stack can be reduced significantly by eliminating high cost surface treatments as a result of employing a titanium separator instead of one made of stainless SUS316L.2)
The authors have previously researched the low cost fabrication of titanium parts using a blended elemental reactive sintering (BERS) method.3,4) This prior work developed TiB-reinforced titanium-based metal matrix composites (Ti-MMCs) for use in engine valves, which were initially sold on the Japanese market in 1998 and remain available up to the present day.5,6)
The most distinctive feature of the Ti-MMCs is the capacity of these materials to be tuned with regard to their physical properties depending on the application.2–4) In fact, it is believed that the BERS method could be employed to optimize both the mechanical and functional properties of titanium alloys. As an example, titanium has unique physical properties, such as being nonmagnetic and having relatively high electrical resistance. As electric motors become the primary motive force for vehicles, materials with specific electromagnetic properties will become more important. Electrical resistance is a very important characteristic of motor materials rotating at high speeds, because an increased resistance can reduce eddy current losses, thus lowering power consumption and enhancing the overall power supply efficiency.
This paper initially introduces basic concepts related to achieving high specific resistance and rigidity in Ti-MMCs in conjunction with ultra-high strength values. Work to obtain reinforced Ti-MMCs using the BERS process together with TiB, TiC, SiC and AlN as metallic or covalent particles is then described. The roles of reinforcements, the matrix, and the interface between reinforcements and the matrix in defining functional properties are examined, and these concepts are verified based on experimental results. The main goal of the present work was to determine the mechanism by which the high specific resistance and rigidity of newly-developed TiC(1−X)/Ti-MMCs materials are obtained. The focus is on the effects of the C and Al levels in these composites, with comparisons to TiB/, SiC/ and AlN/Ti-MMCs.
2. Ti-MMCs with Ultra-High Strength, High Specific Resistance and Increased Rigidity: Basis Concepts
Figure 1 summarizes the basic concepts related to the simultaneous achievement of high specific resistance and rigidity together with ultra-high strength in Ti-MMCs. Obtaining these properties requires a consideration of the particles themselves as well as the interactions between the particles and the matrix. An important governing principle is that high specific resistance in metallic materials is associated with the frequent scattering of electrons.7)

On this basis, the principal requirements of reinforcing particles are that the particles themselves exhibit high specific resistance and high rigidity, and that the reinforcements and interfaces have high specific resistance due to disordered or defective structures, based on in situ reactions between the reinforcements and matrix. As an example, even though the specific resistance of the reinforcements may be low, lattice distortion due to the loss of atoms during reactions between the reinforcements and the matrix can increase the specific resistance of the reinforcements. This occurs because the mean free path of electrons is reduced as a result of a lattice mismatch.8) The main requirement for the matrix in terms of obtaining high specific resistance is that it effectively utilizes the solubility of interstitial elements such as C and O, and of substitutional elements such as Al, such that they are randomly incorporated into the crystal lattice.9) Since TiB, TiC, SiC and AlN meet all the above requirements, they were selected as candidate reinforcements. Table 1 summarizes the physical and mechanical properties of the electrically conductive TiB and TiC materials, which are well known as structural reinforcements, and of SiC and AlN, which are covalent bonding reinforcements with high specific resistance values.10–17)

Table 1 Physical and mechanical properties of the various reinforcements.
3. Experimental Procedures
3.1 Raw materials and chemical compositions of Ti-MMCs
Table 2 provides the volume fractions of the various reinforcements, the chemical compositions (mass%), and the amount of each component (mass%) in the various specimens. Ti–6Al–4V (mass%) and Ti–8.6Al–5.7V were fabricated as Ti-MMCs matrices to investigate the effect of Al content on specific resistance and rigidity.

Table 2 Volume fractions of reinforcements, chemical compositions (mass%) and component concentrations in various specimens.
The raw materials used to fabricate the Ti-MMCs comprised hydride-dehydrate (HDH) titanium powder (43 µm median particle size (D50)) by Toho Technical, Al3V master alloy powder (16 µm (D50)), TiB2 powder (10 µm (D50)), TiC powder (2 µm average diameter) by Shinnihon-Kinzoku, SiC powder (SSC-A30, 34.4 µm (D50)) by Shinano Electric Refining and AlN filler (FAN-f30-Al) by Furukawa Denshi. Descriptions of these materials are provided in Table 2.
3.2 Fabricating Ti-MMCs specimens using BERS
HDH titanium powder was blended together with the other materials acting as alloying agents or reinforcements in a V-mixer machine over a time span of 3.6 ks. This was followed by compacting via cold isostatic pressing (CIP) at a pressure of 392 MPa with a hold time of 60 s, and subsequent sintering at 1573 K for 57.6 ks under a 10−3 Pa vacuum, followed by cooling in air. The sintered Ti-MMCs were hot swaged at 1273 K to 1473 K in conjunction with a reduction in area of approximately 50% using swaging dies from 15 to 10 mm in diameter and employing a Dai-Ni Yoshida Kinen 4SGM apparatus.
3.3 Microstructural analyses
Microstructural characterizations of the matrices and the morphologies of the TiB, TiC, SiC and AlN particles were conducted by a combination of optical microscopy (OM, Olympus; PMG 3), scanning electron microscopy (SEM, Hitachi; SU3500), energy dispersive X-ray spectrometry (EDX, Horiba; EMAX Evolution) and X-ray diffraction (XRD, Cu-Kα, Rigaku; Ultima IV), working along the longitudinal cross-section of each specimen in the swaging direction. Polished specimens for OM and SEM/EDX analyses were prepared using a conventional mechanical technique and were etched with an aqueous solution containing 10% HF and 10% HNO3 (mass%).
XRD patterns were analyzed using the JADE 9 software package (MDI) and International Centre for Diffraction Data PDF data. The lattice constants for TiC were determined using the least squares method, assuming the Fm3d space group and face centered cubic (fcc) packing and using the (111)TiC, (200)TiC, (220)TiC and (310)TiC peaks.18) The reinforcement volume fractions were determined using a segmentation method based on consideration of the particle morphologies and sizes.19) Measurements were performed by first drawing five cutting lines along the swaging direction, following which the contact lengths between reinforcements and these lines were determined. The average contact ratio was obtained by dividing the total contact length by the total cutting length based on five SEM images.
3.4 Evaluation of tensile properties and specific resistance
Tensile test pieces having a gauge section 3 mm in diameter and 20 mm in length were machined from swaged bars and were subjected to tensile tests at an initial tensile rate of 5 × 10⁻⁴ s−1 under ambient conditions, using an Autograph (Shimadzu; AG-1) with a force of 60 kN. Young’s modulus values were obtained from two strain gauges placed in parallel on the surface of each specimen. The tensile strength and elongation were acquired from stress-strain curves generated using a load cell and a video extensometer.
The electrical resistance values were determined using a DC four-terminal method, applying a constant input current (I) of 1 A for 30 s, and measuring the voltage (V) using a source meter (Keithley). The specific resistance (ρ/µΩm) was calculated based on the relationship:
| \begin{equation}
\rho=(V/I)\times (S/L),
\end{equation}
| (1) |
where
S and
L are the cross-sectional area and of length and of the test piece, respectively. In preparation for this analysis, test pieces 3 mm square and 20 mm in length were machined from swaged bars in the same manner as the samples prepared for tensile testing. Pure silver wires (0.2 mm in diameter) were used for connections to reduce the contact and wiring resistance. The current was input through both ends of the test pieces and the voltage was measured between two other contacts on the top faces of the test piece, 10 mm apart. Spontaneous potential measurements were conducted in advance to exclude the floating electric potential by adjusting the source meter.
4. Results
4.1 Characterization of reinforcements and matrices
4.1.1 Observations of reinforcement and matrix microstructures
Figure 2 shows typical OM images obtained from the 10TiB/Ti-64MMCs, 10TiC/Ti-64MMCs, 10SiC/Ti-86MMCs and 10TiC/Ti-86MMCs specimens after hot swaging (HSW). The TiB particles in the Ti-64MMCs exhibit a plate-like or needle-like shape, are approximately 20 µm in size, and are dispersed in homogenously with some arraying due to HSW defections. In contrast, the TiC particles are spherical and approximately 30 µm in size without arraying. The coalescence of particles due to Ostwald growth is observed in both the Ti-64MMCs and Ti-86MMCs specimens, and so this process was not affected by the chemical composition of the matrix.4) The SiC particles had a completely different morphology than those of the TiB and TiC particles. Based on the OM observations, many different reaction phases were present at the interfaces between the matrix and the internal particles, due to reactions between the SiC and Ti matrix during the high temperature sintering (Fig. 2(c)). It should be noted that sintered 10AlN/Ti-86MMCs could not be obtained because the material resulting from the BERS process was too brittle.

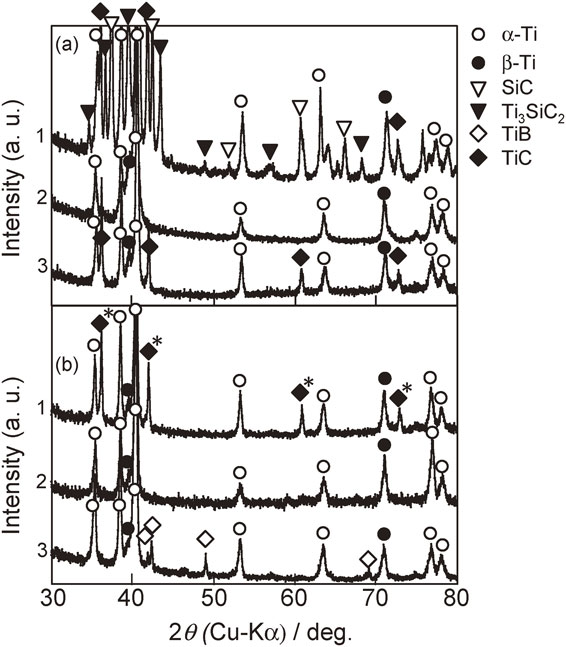
Figure 3 shows the XRD patterns generated by the Ti-MMCs including matrix alloys. The Ti-64 and Ti-86 consisted of α and β phases (Figs. 3(b)-2 and 3(a)-2), with no effect of the amount of Al–V. The 10TiB and 10TiC/Ti-64MMCs generated only α and β and TiB and TiC peaks, as shown in Figs. 3(b)-3 and 3(b)-1. The 10TiC/Ti-86MMCs peaks in Fig. 3(b)-1 are almost the same as those produced by the 10TiC/Ti-64MMCs. However, the 10SiC/Ti-86MMCs pattern in Fig. 3(a)-1 shows SiC, TiC, Ti3SiC, and undetected SixCyTiz peaks along with α and β peaks due to the matrix alloy. These titanium silicide phases correspond to the reaction phases observed between the SiC and Ti interfaces and it is highly likely that these act as brittle phases.12)
4.2 Physical and mechanical properties of Ti-MMCs
4.2.1 Mechanical properties of Ti-MMCs
Figure 4 summarizes the tensile strength and elongation of each Ti-MMCs fabricated in this study, based on the data in Table 2. The tensile strength of the Ti-64 was approximately 1 GPa, while that of the 10TiB/Ti-64MMCs was increased up to 1.3 GPa due to the dispersion of TiB particles. The tensile strength of the 10TiC/Ti-64MMCs was approximately 1.1 GPa, and thus not appreciably different from that of the matrix alloy. The elongation values decreased with increases in the levels of TiB and TiC particles, as shown in Fig. 4(b), but remained in the range of 2.5–5% in the case of the Ti-64MMCs. These values are sufficient for applications in automobile components.

The tensile strength of the Ti-86 was improved to 1.15 GPa as a result of the solution strengthening of aluminum, although the elongation to failure was 4% (Fig. 4(a)). It is well known that increasing the level of aluminum and other α stabilizing elements and reinforcements decreases the elongation of Ti-MMCs while enhancing the tensile strength due to the precipitation of an α2 phase. In the case of an α+β type alloy such as Ti–6Al–4V, the trade-off between strength and ductility can be controlled by optimizing the V concentration. This allows the best use of the solution strengthening of aluminum, which is typically added to a maximum of 7%. However, the primary goal of the alloy design in this study was to increase the specific resistance, even if elongation was sacrificed. Therefore, the optimal Al content was determined to be 8.6% (that is, Ti–8.6Al–5.7V). Although α2 phase peaks were could not detect (Fig. 3), it was inferred from the maximum solubility of Al in a Ti matrix that the impact on the reduction for elongation was larger than that for the tensile strength of Ti-86.
Tensile strength values greater than 1.4 GPa were exhibited by the 10TiB/Ti-86MMCs, while the 10TiC/Ti-86MMCs showed a value of approximately 1.25 GPa due to the effect of dispersed reinforcement particles, as shown in Fig. 4(a). However, the elongation of the ultra-high strength 10TiB/Ti-86MMCs was only 1%.4) The elongation of the 10TiC/Ti-86MMCs was approximately 2.5%, which was less than that of the 10TiC/Ti-64MMCs (Fig. 4(b)). In addition, the 10SiC/Ti-86MMCs was observed to fracture in the elastic region during tensile testing due to the formation of reaction phases, as shown in Fig. 2(c), such that the tensile strength of this material was low, at 0.5 GPa.
Figure 5 presents SEM images of the tensile fractures of the 10TiB, 10TiC/Ti-64MMCs and 10SiC/Ti-86MMCs specimens. TiB and TiC particles associated with cracks 10–30 µm in size are evident inside the grains on the fracture surfaces (Figs. 5(a) and (b)). Considering the strengthening mechanism in the TiB and TiC/Ti-64MMCs, and the stress transformation and sharing between particles and the matrix, it is believed that those particles acted as reinforcements. Conversely, the fracture surfaces of the 10SiC/Ti-86MMCs were covered with granular reaction phases having intergranular fractures, including cracks with sizes of 30–50 µm, as in Fig. 5(c). It is found from these observations results that Ti-MMCs suitable for use as structural materials cannot be fabricated using BERS in conjunction with covalent bonding reinforcements such as SiC and AlN.
4.2.2 Simultaneously achieving high specific resistance, high rigidity and ultra-high strength in Ti-MMCs
Figure 6 shows the relationship between the resistance and Young’s modulus of the Ti-MMCs specimens having tensile strength greater than 1 GPa and elongation above 2.5% in Fig. 4. For comparison purposes, data for Ti–6Al–4V, SP700 (Ti–4.5Mo–3V–2Fe–2Mo) and Ti–3Al–2V (fabricated by ingot metallurgy (IM)) are also plotted.20,21) There is an evident correlation between the resistance of Ti-alloys made using IM (with values of 1.25–1.7 µΩm) and the Young’s moduli, in the case of specimens with strengths of 100–110 GPa. The resistance values and the Young’s moduli of the Ti-64 and Ti-86 were also determined by extrapolation, giving values of 2.2 µΩm and 120 GPa in the case of the Ti-86, respectively.

Moreover, the resistance values of the Ti-86 were improved to 2.33 µΩm by the addition of reinforcing TiC particles, despite these particles having a low specific resistance of 0.52 µΩm. In contrast, the TiB/Ti-MMCs showed extremely low electrical resistance because the conducting TiB particles had a specific resistance of only 0.07 µΩm. The Young’s moduli of the Ti-MMCs were in the range of 135–140 GPa, as shown in Fig. 6.
5. Discussion
It is evident that TiC/Ti-MMCs having high strength values of over 1 GPa together with high rigidity and high resistivities can be obtained by controlling the chemical composition. However, Ti-MMCs with dispersed covalent bonding reinforcements, such as SiC and AlN, show inferior properties when produced using the BERS process. Therefore, in order to achieve both structural and functional optimization and to verify the governing principles, it is important to consider several concepts. These include the use of high specific resistance reinforcements and/or interfaces resulting from disordered and/or defective structures generated by in situ reactions between reinforcements and the matrix. It is also important to effectively utilize the solubility of interstitial elements, such as C and O, and substitutional elements such as Al, to obtain random periodicity in the crystal lattice.8) Finally, it is essential to perform analyses based on experimental results.
5.1 Factors improving the specific resistance and other characteristics of TiC particles in Ti-MMCs
5.1.1 Specific resistance and the formation of TiC(1−X) particles by BERS
The specific resistance of TiC is very low (0.52 µΩm), but still larger than that of TiB (TiB2), as shown in Table 1.8,22) Hence, the specific resistance of TiC/Ti-MMCs should be less than those of Ti-64 and Ti-86, if the low of mixture is applied similar to that of strength characteristic. The most important factor is the structural change in the TiC itself or at the interface resulting from in situ reactions between reinforcements and the matrix. Recent work has determined the thermodynamic stability of many different TiC compounds in the Ti–C binary diagram, based on progress in the calculation accuracy of the Calphad software program.4,23) However, definite values are often not available, and only specific resistances of single crystal TiC compounds have been reported in the literature.23) Therefore, the chemical compositions of TiC particles (at 17 points) in the 10TiC/Ti-64MMCs and in the 10TiC/Ti-86MMCs (at 7 points) were investigated using SEM/EDX. Figure 7 shows typical SEM images while Table 3 summarizes the chemical compositions of the 10TiC/Ti-86MMCs. The white circles in Fig. 7 indicate the positions at which the X-ray beam was applied. The EDX data demonstrate that these TiC compounds consisted of 64.3% Ti, 32.2% C, 3.33% V and 0.28% Al (on average) in the case of the 10TiC/Ti-64MMCs, and 59.7% Ti, 37.0% C, 2.85% V and 0.42% Al (on average) in the 10TiC/Ti-86MMCs, as shown in Table 3. Based on these data, the C/Ti ratios were calculated to be 0.50 and 0.62 for the 10TiC/Ti-64MMCs and 10TiC/Ti-86MMCs, respectively.


Table 3 Chemical compositions (at%) and C/Ti atomic ratios in TiC particles.
A quantification analysis was conducted to obtain accurate lattice constants for the TiC in the Ti-64MMCs, Ti-86MMCs and raw TiC powder, based on the (111)TiC, (200)TiC, (220)TiC and (310)TiC reflections marked with asterisks in the XRD patterns in Fig. 3(b)-1. Assuming that the TiC had an ordered Fm3d (fcc) structure, the lattice constants in both Ti-MMCs and the raw TiC powder were estimated to be 0.43001 and 0.43251 nm, respectively.
Figure 8 shows the relationships between the C/Ti ratio and the specific resistance, hardness and lattice constant, as determined using the Ramqvist software package.24) From the relationship between the lattice constant and the C/Ti ratio in Fig. 8(c), the C/Ti ratios in the 10TiC/Ti-64MMCs and 10TiC/Ti-86MMCs were estimated to be 0.54 while that of the TiC powder was 0.87. On this basis, together with the SEM/EDX and XRD results, it is apparent that the TiC powders reacted with Ti and transitioned to TiC(0.50–0.62) by losing C during the reactive sintering at 1573 K for 58.6 ks.

Gusev et al. reported the specific resistance values of single crystal TiC0.54–TiC0.62 specimens to be in the range of 1.40–1.75 µΩm (Fig. 8(a)).23) A detailed structural analysis of TiC(0.50–0.62) obtained using the BERS process has not yet been conducted, but it is believed that one factor associated with improved specific resistance is the presence of reinforcements and/or interfaces having high resistivities due to disordered or/and defective structures stemming from in situ reactions between reinforcements and the matrix. The results in Figs. 6–8 allow the specific resistance of the TiC(0.50–0.62) in the TiC/Ti-MMCs in this study to be estimated at approximately 1.7 µΩm, which is three times larger than the value for the raw TiC powder.23) Variations in the hardness of the TiC also tend to decrease with decreases in the C/Ti ratio as well as with changes in the lattice constant, such that the value for TiC0.5 is approximately 1.5 GPa (Fig. 8(b)). These results suggest that the main factor responsible for the lower strength of the TiC/Ti-MMCs specimens evident in Fig. 4 is a decrease in the hardness of the TiC particles.4)
5.1.2 Effect of C and Al on the specific resistance of the Ti matrix
The solubility of C in the Ti matrix is 0.45% at most in the β phase, but only 0.1–0.14% in the α phase.25) The C mass% in 10 vol% TiC is estimated to be 2.18% (1.8 at%), and so the C concentration in 10 vol% TiC0.54 would be 1.31%. Therefore, the excess C level is estimated to be 0.77%, assuming that the solubility of C in the α phase is 0.1% at ambient temperature.25) This C is thought to react with the 4.9% Ti in the Ti matrix, to generate TiC0.54 in situ at approximately 6 vol%. Consequently, the volume fraction of TiC0.54 should be 16 vol%. The Al content in the Ti-86 matrix is increased to approximately 9 mass% on the basis of these same calculations.
To confirm the solubility of Al in the Ti matrix, variations in the α and β phase peak positions towards the high angle side (from 70° to 80° 2θ) were investigated, focusing on the (112)α, (201)α and (211)β peaks. Figure 9 provides the XRD patterns of the 10TiC(0.50–0.62)/Ti-86MMCs, Ti-86 and Ti-64 specimens. A comparison between the Ti-86 and Ti-64 shows that the peak positions of the (112)α, (201)α and (211)β reflections in the Ti-86 pattern (the dotted lines) are shifted to the high angle side to a greater extent than those in the Ti-64 pattern (dashed lines). Furthermore, the (112)α, (201)α and (211)β peaks are shifted to even higher angles upon reinforcement of the Ti-86 with 10 vol% TiC(0.50–0.62), compared to those in the Ti-86 pattern. These shifts indicate shrinkage of the lattice due to the substantial dissolution of Al. It should be noted that the difference in lattice strain depends on whether the (112)α, (201)α or (211) peaks of the 10TiC(0.50–0.62)/Ti-86MMCs are assessed (Fig. 9(a)). This can be attributed to differing amounts of C and Al and variations in the solubility of these elements. It can be inferred from the results in Fig. 3(a)-3 that Al in the 10TiC(0.50–0.62)/Ti-86MMCs dissolves in the Ti matrix, considering that there is no identifiable α2 phase peak in the XRD pattern of this specimen in Fig. 9(a). Figure 10 shows the relationship between the specific resistance and the Al concentration in these materials. These data demonstrate that the specific resistance of the Ti matrix is proportional to the Al content, and that the value of the Ti–9Al–6V is expected to improve up to 2.5 µΩm with increasing Al concentration. Here the increased specific resistance is assessed solely considering Al rather than V. This is because the specific resistances of metals are determined by the number of atoms involved in lattice disruption, and Al has a greater effect than V at high concentrations in solid solutions.9)

Based on these experimental results, the most important factor is evidently the effective utilization of the solubility of interstitial elements, such as C, and substitutional elements, such as Al, to obtain random periodicity in the crystal lattice.9) This effect results in the high specific resistance and high rigidity of the TiC(1−X)/Ti-MMCs.
5.2 Specific resistance values of TiC(1−X)/Ti-MMCs
Several studies have reported the relationship between the conductivity and the volume fraction and/or the connectivity of fillers in composite materials.26) Characterizations regarding the percolation or jumping effect on electrical specific resistance have also been reported. The differences between the specific resistances of the filler and the matrix in these prior studies were orders of magnitude greater than in this study, and so the effects noted in the present work were substantially different.
The effects of reinforcements such as TiC(0.50–0.62) and TiB on the specific resistance were evaluated using the two-dimensional area ratio calculated by a segmentation method19) taking into account reinforcement morphology and size. Table 4 shows the average contact ratios for the 10TiB/Ti-64MMCs and 10TiC(0.50–0.62)/Ti-64MMCs, while Fig. 11 presents typical SEM images of both Ti-MMCs (for area number 1). The average contact ratios were 16% and 22% for the 10TiB/Ti-64MMCs and 10TiC(0.50–0.62)/Ti-64MMCs, respectively, the latter of which is greater than the volume fraction calculated from the composition of the 10TiC(0.50–0.62)/Ti-64MMCs. The specific resistance value of the 10TiC(0.50–0.62)/Ti-86MMCs was calculated using the Ti-64MMCs volume fraction in Table 4 and considering the microstructural morphology of the Ti-86MMCs and Ti-64MMCs (Figs. 2(b) and (d)).4)
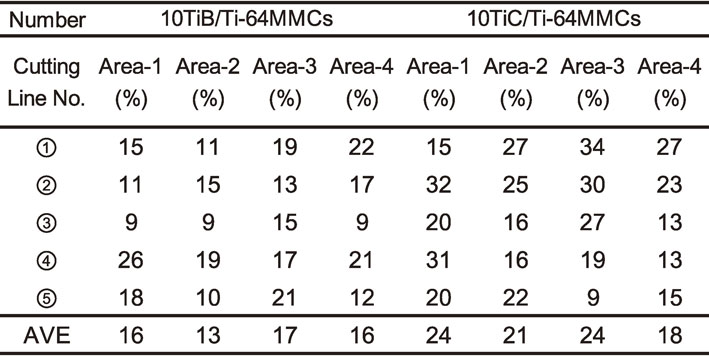
Table 4 Average area proportions of TiC(1−X) particles as determined by sectioning.
The specific resistance of the TiC(0.50–0.62)/Ti-86MMCs was determined to be approximately 2.33 µΩm (Fig. 6) while that of the Ti–9Al–6V matrix was estimated to be approximately 2.5 µΩm based on Fig. 10, due to the effects of the solubilization of Al and C. The specific resistance of the TiC(1−X) was estimated to be 1.7 µΩm based on the data for TiC(0.54) in Fig. 8. The value for the TiC(0.50–0.62)/Ti-86MMCs was determined to be approximately 2.32 µΩm by a simple low of mixture, which is close to that of the actual experimental value of 2.33 µΩm determined in this study. In addition, the TiC(0.50–0.62) volume fraction was calculated based on the contact ratio data in Table 4.
The expected specific resistance of the 10TiB/Ti-64MMCs was calculated using the Hashin-Strikman formula, which is often applied to MMCs reinforced with short fibers.27) The specific resistance of the Ti–6Al–4V matrix was assumed to equal the experimental value of 2.0 µΩm, while a value of 0.07 µΩm was employed for the TiB reinforcement (based on the value for TiB2). Using the average 10TiB/Ti-64MMCs contact ratio of 16% in Fig. 11, the specific resistance of this material was determined to be approximately 1.44 µΩm, and therefore slightly higher than the experimental value obtained in this study. Considering the results in Fig. 11 and Table 4, it appears that the low specific resistance of the 10TiB/Ti-64MMCs was partly the result of the rectangular particle morphology (with an aspect ratio of approximately 5), as well as the connectivity of the planar structure.
The high specific resistance of the TiC(0.50–0.62)/Ti-86MMCs (which had a high strength value of 1.25 GPa) resulted partly from the specific resistance of individual TiC(0.50–0.62) particles formed in situ by the BERS process (approximately 1.7 µΩm). This specific resistance was, in turn, due to the C deficiency of these particles, and was about three times higher than the value of 0.52 µΩm for stoichiometric TiC particles. In addition, the solubility of the excess C and Al in the Ti matrix also increased the specific resistance.
A further aspect of this work was the structural control of the TiC(1−X), such as the development of disorder, and/or the quantification of the specific resistance of the reinforcements and the reinforcement/matrix interfaces. We believe that the present results will be helpful in the future design of ultra-high strength, high specific resistance alloys. This research may also change the production design paradigm for titanium-based automotive materials rotating at high speeds.28)
6. Conclusion
This research examined basic concepts related to the fabrication of Ti-MMCs having high specific resistance and rigidity together with ultra-high strength. TiB, TiC, SiC and AlN were selected as metallic or covalent bonding type particles and reinforced Ti-MMCs were obtained using the BERS technique. The mechanism by which the newly developed TiC(0.50–0.62)/Ti–8.6Al–5.7V alloy achieved various performance criteria was also considered. The primary conclusions can be summarized as follows.
-
(1)
Both 10 vol% TiB-reinforced Ti–6Al–4V MMCs (10TiB/Ti-64MMCs) and 10 vol% TiC(1−X)-reinforced Ti–8.6Al–5.7V (TiC(1−X)/Ti-86MMCs) were fabricated as sintered compacts via the BERS process. Blending SiC and AlN with Ti powder during sintering was found to result in reactions that formed a brittle phase at the interfaces between the particles and the Ti matrix during the high temperature sintering.
-
(2)
The tensile strength of the 10TiC(0.50–0.62)/Ti-86MMCs was approximately 1.25 GPa, and so almost the same as that of the 10TiB/Ti-64MMCs. The former materials also showed 2.5% elongation and a 135 GPa Young’s modulus.
-
(3)
The specific resistance of the 10TiC(0.50–0.62)/Ti-86MMCs was approximately 2.33 µΩm. This material also showed ultra-high strength and a suitable degree of elongation that was twice that of the 10TiB/Ti-64MMCs.
-
(4)
TiC reinforcement of Ti-MMCs appears to improve specific resistance because the resulting TiC(0.50–0.62) has a resistance of approximately 1.7 µΩm due to a loss of C from the stoichiometric TiC powder. Consequently, the specific resistance of individual TiC(0.50–0.62) particles is likely three times higher than the value of 0.52 µΩm for stoichiometric TiC.
-
(5)
An important factor associated with improving the specific resistance of such materials is the effective utilization of the solubility of interstitial elements, such as C, and substitutional elements, such as Al, to obtain random periodicity in the crystal lattice in the Ti matrix. This effect increases both the specific resistance and rigidity of the TiC(1−X)/Ti-MMCs.
REFERENCES
- 1) Ministry of Economy, Trade and Industry Manufacturing Industries Bureau Non-ferrous metal division: Evaluation Summary of Process development of High performance Titanium alloy (2010-04-09), pp. 1–25.
- 2) S. Mizuno, H. Nakaji and H. Yoshikawa: Proc. 1st Research Workshop on Titanium Forum, (The Iron and Steel Institute of Japan 2017) pp. 54–59.
- 3) T. Saito and T. Furuta: Toyota Central Research and Development R&D Review 29, (1994) pp. 49–60.
- 4) T. Furuta: Doctoral Thesis, Tohoku University, (2008).
- 5) T. Furuta, T. Saito and T. Yamaguchi: Toyota Central Research and Development R&D Review 36, (2001) pp. 51–56.
- 6) T. Yamaguchi, T. Furuta and T. Saito: SAE TECHNICAL PAPER SERIES, 2000-01-0905, (2000) pp. 1–9.
- 7) K. Ikeda, S. Komatsu, T. Sugimoto and K. Kamei: J. JILM 42 (1992) 622–626.
- 8) H. Holleck: J. Vac. Sci. Technol. A 4 (1986) 2661–2669.
- 9) T. Christman, K. Heady and T. Vreeland, Jr.: Scr. Mater. 25 (1991) 631–636.
- 10) M. Naka, J.C. Feng and J.C. Schuster: Metall. Mater. Trans. A 28 (1997) 1385–1390.
- 11) C. Boehlert, B.S. Majumdar and D.B. Miracle: Metall. Mater. Trans. A 32 (2001) 3143–3155.
- 12) M.S. Selamat, L.M. Watson and T.N. Baker: Mater. Proc. Tech. 142 (2003) 725–737.
- 13) B. Huang, Y. Yang, H. Luo, M. Yuan and Y. Chen: Mater. Sci. Eng. A 489 (2008) 178–186.
- 14) Y. Shichi, M. Arita, K. Matsumoto and M. Matsunaga: J. Ceram. Soc. 97 (1989) 1354–1357.
- 15) Y. Paransky, I. Gotman and E.Y. Gutmanas: Mater. Sci. Eng. A 277 (2000) 83–94.
- 16) K. Mitsui: Research Reports of Kanagawa Institute of Technology B-15 (1991) 289–297.
- 17) K. Akechi and Z. Hara: Seisan Kenkyu 31 (1979) 639–642.
- 18) S. Tsurekawa and H. Yoshinaga: J. Japan Inst. Met. Mater. 56 (1992) 133–141.
- 19) Y. Takayama: J. JILM 44 (1994) 48–56.
- 20) https://www.daido.co.jp/products/titanium/index.html.
- 21) http://www.jfe-steel.co.jp/products/titanium/index.html.
- 22) S. Torizuka, J. Harada and H. Nishio: Bull. Jpn. Inst. Met. 29 (1990) 484–486.
- 23) A.I. Gusev: Phys. Uspekhi 43 (2000) 1–37.
- 24) L. Ramqvist, B. Ekstig, E. Källne, E. Noreland and R. Manne: J. Phys. Chem. Solids 30 (1969) 1849–1860.
- 25) S. Murakami, K. Ozaki, K. Ono and Y. Itsumi: KOBE STEEL ENGINEERING REPORTS 60 (2010) 37–41.
- 26) K. Miyasaka: Soc. Rubber Sci. Tech. 58 (1985) 561–568.
- 27) J. Hashin and S. Strikman: J. Mechan. Phys. Solids 11 (1963) 127–140.
- 28) T. Uesugi, S. Miyamae and K. Higashi: Mater. Trans. 54 (2013) 484–492.