Evaluation Method of Formability through Development onto Tangential Planes: Geometrical Evaluation for Forming of Closed Section Parts from Sheet
2019 Volume 60 Issue 9 Pages 1977-1982
Details
2019 Volume 60 Issue 9 Pages 1977-1982
New formability evaluation methods are investigated for closed section parts manufactured from sheet blanks. New methods are based on an analytical approach and geometrical information. The authors proposed developmental evaluation method in which in-plane strain is calculated by the development of product shapes. Two stage development using principal curvatures and a series of tangential planes enables application of developmental evaluation method to shapes with large curvature. In this paper, the results of calculation by the proposed method are compared with the results of FEM simulation regarding on sheet forming into horn tubes. The horn tube, which consists of circular, conical and transient portions, is one of the typical shapes of automotive parts. The conclusion is that the two sets of calculation results are in good qualitative agreement. For product shapes with widely spread, relatively small strain introduced in forming processes, the geometrical condition is dominant for the strain distribution and the prediction accuracy of the developmental evaluation method is improved.
This Paper was Originally Published in Japanese in J. JSTP 59 (2018) 241–246.
The automobile industry requires lighter and stronger car bodies, and closed section parts are being increasingly used in car bodies to help meet these needs. Closed section parts provide increased body rigidity and strength per unit weight. Since most conventional closed section parts are fabricated from tubular blanks, it is difficult to form a part that varies significantly in sectional circumferential length. On the other hand, technologies have been developed to fabricate 3D-shaped closed section parts directly from sheet blanks,1–3) and this has the potential to form closed section parts with large expansion of the circumferential length along the longitudinal direction.
To apply direct sheet forming to real parts production, it is important to be able to evaluate feasibility of the product shape in the early design phase. Although incremental forming simulation using FEM is powerful for evaluating formability and widely used, it requires detailed information such as tool shapes and forming conditions. FEM simulation is a kind of virtual prototyping and takes time and cost to be carried out. In the design phase, only the geometrical shape of the product has been decided, and thus formability evaluation based on geometrical information will be powerful tool. According to a report by Sato et al.4) on the horn tube, a product consisting of circular and conical portions smoothly connected via a transient portion, the effect of the product shape on the strain distribution is much greater than that of the material and sheet thickness. This is thought to show the utility of formability evaluation using geometrical information only. Although one-step FEM simulation has been put to practical use as an evaluation method based on product shape, no specific process for developing three-dimensional shapes onto the plane has been presented.5) In order to investigate the effects of various geometrical features on formability, it is desirable to have a method with a more analytical approach and clear calculation process.
Geometrical and analytical evaluation methods for three-dimensional shapes have been researched in the shipbuilding field.6,7) Methods have been proposed in which grids are generated using principal curvature lines and developed onto a plane.8,9) However, since automotive structural parts have a large curvature and cannot be developed onto a plane at once, conventional methods cannot be applied.
The authors have proposed a new analytic formability evaluation method, using only geometrical information on products, for closed section parts manufactured from sheet blanks.10) In this paper, the results of calculation using the proposed method are compared with the results of FEM forming simulation, with regard to sheet forming into horn tubes. The horn tube is one of the typical shapes among automotive parts.
Dimensions of the horn tubes discussed in this paper are shown in Fig. 1. The circular portion with diameter 2R0 and the conical portion with taper angle θT are smoothly connected via the transient portion with constant curve-radius ρ. The full length (L1 + L2 + L3) is 300 mm and the transient portion is situated in the middle of the longitudinal direction. As shown in the cross-sectional view in Fig. 1, the seam position of the sheet in actual sheet forming is called the edge portion, and the opposite side of the edge portion is called the bottom portion. Z and θC are defined as, respectively, length in the longitudinal direction with the origin at the tube end on the circular portion side, and the angle in the circumferential direction with the origin at the middle of the bottom portion.

Shape of horn tubes.
In the design phase, die shapes and forming conditions are undetermined, and only the geometrical shape of the part has been designed. Formability evaluation based on only geometrical information will be a powerful tool for the design phase. The authors have proposed a new formability evaluation method employing calculation of in-plane strain through development of the closed-section part shape onto the plane (Developmental Evaluation Method, DEM).10) As explained below, two stage development using principal curvatures and a series of tangential planes enables application of DEM to shapes with large curvature.
The product shape (horn tube) is developed through the following steps. Step 1: The matrix W (shown in eq. (1)) is calculated on the curved surface in the center of the thickness direction. This surface is regarded as the representative shape of the horn tube. In eq. (1), p is the position vector of the curved surface, u and v are parameters representing p, and n is the normal vector. At this time, principal directions at each position of the curved surface are generated by using the eigenvectors of matrix W. Step 2: The principal curvature lines l1 and l2 are drawn by using these principal directions, and these lines make an orthogonal grid on the target surface. For simplicity of calculation these lines have equal intervals. Figure 2 shows the grid on the transient portion of the target horn tube. Step 3: One of minor principal curvature lines l2 is chosen as a base line l2°. Then, a series of tangential planes T1, T2, T3 are generated along the base line l2°. The tangential planes are defined at each intersection of the base line and the major principal curvature lines. When the base line l2° is curved, these tangential planes are not on the same plane. One of the line l2 at opposite of the base line l2° is chosen as the cutting line.
| \begin{equation} W = \begin{bmatrix} \dfrac{\partial^{2}\boldsymbol{{p}}}{\partial u^{2}}\cdot \boldsymbol{{n}} & \dfrac{\partial^{2}\boldsymbol{{p}}}{\partial u\partial v}\cdot \boldsymbol{{n}}\\ \dfrac{\partial^{2}\boldsymbol{{p}}}{\partial v\partial u}\cdot \boldsymbol{{n}} & \dfrac{\partial^{2}\boldsymbol{{p}}}{\partial v^{2}}\cdot \boldsymbol{{n}} \end{bmatrix} \begin{bmatrix} \dfrac{\partial \boldsymbol{{p}}}{\partial u}\cdot \dfrac{\partial \boldsymbol{{p}}}{\partial u} & \dfrac{\partial \boldsymbol{{p}}}{\partial u}\cdot \dfrac{\partial \boldsymbol{{p}}}{\partial v}\\ \dfrac{\partial \boldsymbol{{p}}}{\partial v}\cdot \dfrac{\partial \boldsymbol{{p}}}{\partial u} & \dfrac{\partial \boldsymbol{{p}}}{\partial v}\cdot \dfrac{\partial \boldsymbol{{p}}}{\partial v} \end{bmatrix} ^{-1} \end{equation} | (1) |

Principal curvature lines and tangential planes of the horn tube.
Step 4 is the ‘1st development’: As shown in Fig. 3, the major principal curvature lines l1 cut by the cutting line are developed onto each tangential plane. The developed lines l1* are arcs with radius defined by 1/κ1* and the same length as l1. When the line l1 is a perfect circle, the tangential curvature κ1* is defined by κ1* = κ1 cos θ. Step 5 is the ‘2nd development’: The curved base line l2° is developed onto one flat plane. In this step, the base line is also developed by using Step 4. Lines l1 are moved onto a plane together with the development of the base line l2°.

Development onto tangential plane.
Step 6: After the horn tube is developed onto a plane, these developed lines generate a developed grid as shown in Fig. 4. At this time, the intervals of the developed lines l1* on the base line l2° are equal to the intervals of the original lines l1. The developed base lines l2 also keep their intervals.

Developed surface of the horn tube.
The above series of steps is called “Development onto tangential plane.” Grids developed on a plane are distorted. To evaluate in-plane strain, the developed grids are compared with the corresponding original grids. Since in-plane strains of the horn tube in this paper are more than 0.1, finite strain theory should be applied. In-plane strains are evaluated as Green strains. The Green strain tensor Eij is defined by eq. (2) using the infinitesimal lengths ds02 and ds2 shown in Fig. 5.

Schematic grid deformation.
Since each grid is developed around the base line in development onto tangential plane, strains around the base line are the smallest. On the other hand, it is thought that, in the actual forming processes, the sheet deforms to minimize the overall strain energy. Therefore, a reselected base line is chosen from the original base line and other minor principal curvature lines in the grid after the development onto the tangential plane. In the final developed grid, the reselected base line is determined in order to minimize the strain energy Estrain defined by eq. (3). εeq is the equivalent strain. Variation in developed shape due to reselection of the base line is shown in Fig. 6. Since the length of the base line is kept constant, the developed grid as a whole extends in the longitudinal direction as the base line shifts outward.
| \begin{align} & 2E_{\text{ij}}dx^{\text{i}}\,dx^{\text{j}} = ds^{2} - ds_{0}{}^{2}\\ & (dx^{1} = dx\quad dx^{2} = dy) \end{align} | (2) |
| \begin{equation} E_{\text{strain}} = \frac{1}{2} \varepsilon_{\text{eq}}{}^{2}dx'\,dy'\cos\theta \end{equation} | (3) |

Variation of developed surfaces by base-line reselection.
Mechanical properties and thickness of steel sheets used in the forming simulation are shown in Table 1. A blank sheet is shaped by smoothly connecting between a conical portion and circular portion developed in the plane. As shown in Fig. 7, horn tubes are formed from blank sheets through two processes of U-shaping and closing.


Forming processes using sheet blank.
PAM-STAMP universal software for the dynamic explicit method is used for FEM. Tools are assumed to be rigid bodies. Blank sheets are modeled using shell elements, and material properties are approximated using the Swift formula from stress-strain diagrams obtained in tensile tests. The friction coefficient between tools and sheets is 0.15 (Coulomb friction). The mesh is initially divided into 75 elements (approximately 4 mm) in the longitudinal direction and 26 elements (approximately 4.6 mm) in the circumferential direction. A refinement function is employed enabling the elements in signficantly deformed portions to be automatically re-divided (into four equal parts). Five integral points are used in the thickness direction. Note that contour diagrams appear to have thickness-sized gaps at edge portions after forming, but actually no such gaps remain. The cause of gaps in contour diagrams is that each element has a distance for determining contact with other elements even at edge portions. The satisfactory precision of the forming simulation has been confirmed in a previous paper.3)
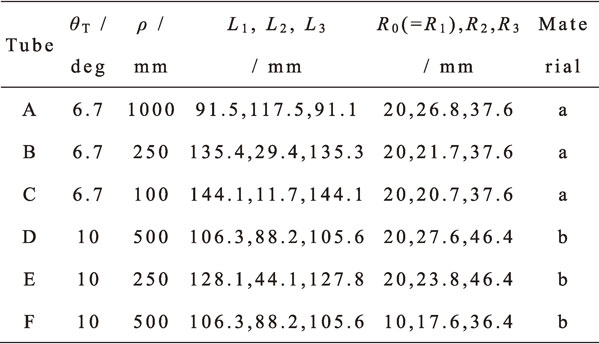
4.2 ComparisonDimensions of horn tubes used for comparison are shown in Table 2. Development onto tangential plane and the actual forming process give rise to opposite deformations. Also, in this paper, large strain (more than 0.3) is calculated to examine the accuracy of the DEM. Therefore, values obtained by positive and negative inverting of longitudinal strains calculated by the DEM, and longitudinal strains obtained by FEM simulation, are described as deformation ratios.
The deformation ratio distribution at the transient portion calculated using the DEM is shown in Fig. 8. The deformation ratio distribution of the entire horn tube calculated by FEM simulation is shown in Fig. 9. Note that Fig. 9 shows the result obtained by mapping the deformation ratio induced in the forming process onto the blank shape before forming. In both cases, the deformation ratio is compression at the bottom portion varying to tension towards the edge portion. The distribution trend is quite similar. Distributions of the deformation ratio at the middle cross section, the edge portion and the bottom portion are shown in Fig. 10 and Fig. 11. The distributions have good agreement at the cross section (Fig. 10). Deformation ratios are zero around θC = ±90° in both the DEM and FEM simulation. On the other hand, the maximum deformation ratio at the edge portion Emaj in the DEM is 1.18 times that in the FEM simulation in the longitudinal distributions at the edge portion and the bottom portion (Fig. 11). The maximum compressive deformation ratio at the bottom portion Emin is 2.23 times. Also, the distribution length Ld, defined as the region with a deformation ratio of 0.01 or more at the edge portion, is 0.35 times.

Distribution of deformation ratio at the transient portion calculated using the developmental evaluation method (tube B).

Distribution of deformation ratio calculated using FEM simulation (tube B).

Distribution of deformation ratio at the middle cross section (tube B).

Distribution of deformation ratio at the edge and bottom (tube B).
The effect of the curvature radius ρ at the transient portion (horn tube A, B and C) on Emaj and Ld is shown in Fig. 12 and Fig. 13. In both the DEM and FEM simulation, Emaj decreases and Ld increases as ρ increases. The difference between the DEM and FEM simulation is large when ρ is small, but decreases as ρ increases.

Effect of ρ on the maximum deformation ratio at the edge Emaj (θT = 6.7°, R0 = 20 mm).

Effect of ρ on the distribution length Ld (θT = 6.7°, R0 = 20 mm).
There are two main reasons for the larger difference between the deformation ratio calculated using DEM and the result of FEM simulation. The first reason is material inflow from the circular and conical portions to the transient portion. l1 at the circular and conical portions is aligned parallel by the development onto tangential planes because the curvature of l2 is zero. Strain does not arise in the DEM. In the actual forming process, longitudinal tensile stress is induced around the transient portion along with deformation of that portion. As a result, tensile strain is induced at the circular and conical portions, while the strain decreases at the transient portion. The second reason is the geometrical difference between the product shape developed in the DEM and the product shape as a result of FEM simulation. In actual forming, the sheet does not always follow dies completely and the curvature at each position is not exactly the same as the die design.
In order to discuss the effects of above two foctors, the deformation ratio distribution is calculated using the three methods shown in Table 3 and compared. Method I is the DEM for developing the designed shape shown in Table 2. Method III is FEM simulation. Method II is the DEM for developing the product shape as a result of FEM simulation (FEM-calculated shape). More specifically, In method II, the coordinates of the edge portion in the mesh after FEM simulation are extracted, and rotated around the center axis to generate a three-dimensional shape. DEM is applied to the curved surface of this three-dimensional shape. The difference between methods I and II seems to correspond to the latter of the above two foctors (geometrical difference). The difference between methods II and III seems to correspond to the former (material inflow).
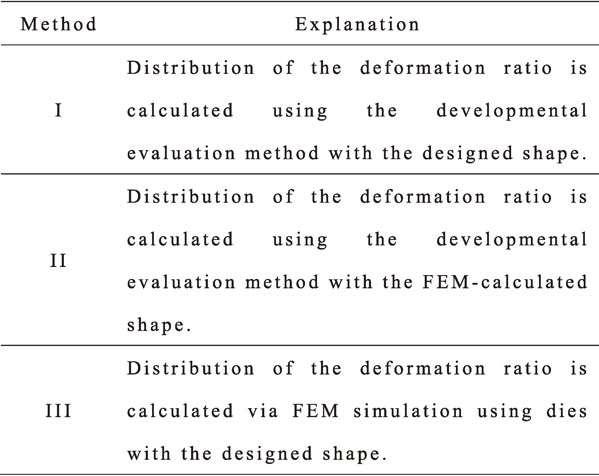
Figure 14 shows the results of comparing distributions of the deformation ratio at the edge portion of horn tubes A, B and C with different ρ. Compared to method I, the distribution of method II is closer to that of method III for all tubes. Emaj and Ld have very good agreement for horn tube A in particular. Emaj is in good agreement even in horn tube B. On the other hand, with respect to Ld in horn tube B and Emaj and Ld in horn tube C, method II approaches method III but a difference still remains. For product shapes with widely spread, relatively small strain (horn tube A), it is thought that the effects of material inflow are small and the geometrical condition becomes dominant. Conversely, for product shapes with large strain concentrated in a narrow area (horn tube C), the effect of material inflow is stronger and the prediction accuracy of DEM is thought to decrease even if the geometrical conditions are accurate.

Deformation ratios at the edge for calculation methods I, II and III.
With regard to Emaj and Ld, the errors are examined between EmajFEM and LdFEM calculated using FEM simulation (method III), and EmajGAM and LdGAM calculated using DEM (method I and II). The errors are defined as Dm = (EmajGAM/EmajFEM − 1) and Dd = (LdGAM/LdFEM − 1), and are calculated for conditions with variation in ρ, θ and R0 (Table 2). The relationship between ρθT/R0 with Dm and Dd is shown in Fig. 15 and Fig. 16. In both method I and II, the errors are large when the product shape has small ρθT/R0 but decreases as ρθT/R0 increases. In method II, the errors are very small with ρθT/R0 over 2.

Relationship between ρθT/R0 and Dm with designed shape or FEM-calculated shape.

Relationship between ρθT/R0 and Dd with designed shape or FEM-calculated shape.
The error of DEM with respect to FEM simulation is sufficiently small for product shapes with a long transient portion if the geometrical conditions are accurate. Although DEM (method I) overestimates strain compared to FEM simulation for product shapes with a short transient portion, large strain is induced in the actual forming process of such product shapes and forming defects may occur. Therefore, from the stanpoint of productivity, product shapes should be re-designed as more formable. Based on the above, DEM is thought to be effective for evaluating formability in the early phase of product design.
A formability evaluation method based on an analytical approach and using only geometrical information was investigated for closed section parts manufactured from sheet blanks. The authors have previously proposed a developmental evaluation method (DEM) in which in-plane strain is calculated by developing product shapes onto a plane. In this paper, forming of horn tubes is used as an example for study. The horn tube, consisting of circular, conical and transient portions, is one of the typical shapes among automotive parts. The main conclusions are as follows: