Materials Processing
Inlet Condition for Mold Filling Simulation in Gravity Casting of Aluminum Alloy
2020 Volume 61 Issue 10 Pages 1981-1986

Details
2020 Volume 61 Issue 10 Pages 1981-1986
The casting CAE is useful tool for casting design in order to obtain the sound castings without defects. It is very important to know the influence of casting conditions on the mold filling. In the present study, the inlet condition for the mold filling simulation in gravity casting of aluminum alloy is investigated to simulate the real phenomena changing with the difference in the casting shape. The direct observation experiment is carried out with six types of sprue designs using an aluminum alloy and sand mold. There are three types of sprues: the elbow, bend and stair-step shapes. The molten metal of Al–7%Si alloy is poured using the stopper ladle. The velocity change in accordance with the different casting condition is analyzed using images observed by the video camera. The velocity of flow front in the early stage of the mold filling is changed intensely. Then, the velocity after the middle stage of the mold filling is decreased calmly. It is difficult to simulate the present phenomena by the mold filling simulation using the velocity inlet boundary. In order to reproduce the difference of each filling behavior, new inlet condition, which is named to “OverFlow pouring Basin” (OFB), is proposed in this study. The mold filling behavior and filled-up time simulated using the inlet condition of OFB are more or less agreed with six real phenomena according with three sprue shapes and two sprue heights.
The casting CAE is useful tool for the casting plan and design to obtain the sound castings.1–3) Then, it is necessary to verify and validate the results obtained by simulation of real phenomena. In the previous study,4,5) the molten metal is poured into the cavity with the same pouring condition. However, the mold filling behavior is changed depending sprue height and sprue shape.
In this study, the inlet condition for mold filling simulation in gravity casting of aluminum alloy was investigated to simulate the real phenomena according to the casting shape. The direct observation experiment was carried out with six types of sprue designs using an aluminum alloy and sand mold. There are three types of sprue in the elbow, bend and stair-step shape. Two types of pouring methods, with the stopper ladle pouring and tilting ladle pouring type, were used in this study. Further, the mold filling simulation was carried out to reproduce actual phenomena using the casting CAE software TopCASTTM.6–8) Comparing to the experimental results, the inlet condition and calculation conditions are investigated to obtain suitable calculated results.
The direct observation experiments4,5) were carried out with six types of sprue designs using an aluminum alloy and sand mold. Schematic illustration of casting design is shown in Fig. 1. There are three types of sprue in the elbow, bend and stair-step shape. They are named as L, C, S, respectively. The heights of the sprue are two types of 220 and 150 mm. The casting designs are called as L-220, C-220, S-220, L-150, C-150, and S-150.

Schematic illustration of casting design.
The cavity has a disk shape of φ100 mm diameter and 7 mm thickness with a pocket of φ20 mm diameter.
2.2 Experimental procedureThe views of experimental apparatus are shown in Fig. 2. The mold consists of the green sand mold and the heat-resistant glass wall. In the experiments, a little graphite powder was applied to the glass wall. The casting material of aluminum alloy Al–7%Si was melted from pure Al of 99.99% and Al–25%Si alloy. The sample materials of 440 g are melted by a muffle furnace and set to the preheated pouring basin. At the pouring temperature of 973 K (700°C), the molten metal was poured from the ladle. Two types of pouring method, the stopper ladle pouring (a) and tilting ladle pouring (b), were used in this study. The mold filling behavior was observed by a video camera with 60 fps. Number of repetition times was 3 or more in consideration of reproducibility.

Views of experimental apparatus. (a) Stopper ladle. (b) Tilting Ladle.
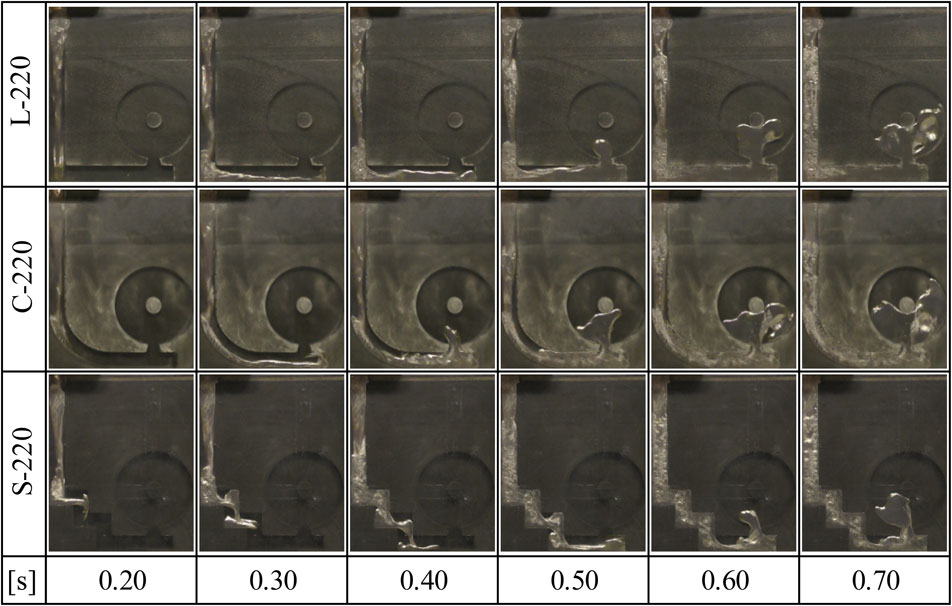
Figure 3 shows the comparison of mold filling behaviors varying with the sprue shape and height in the case of stopper ladle pouring. The molten metal was injected from the pouring basin. Then it passed through the sprue, runner, and ingate and inlet to the cavity. The passing speed in the sprue of C-type (C-220 or C-150) is faster than that of other types because the wall resistance is small. The filled-up time becomes short, as shown in Fig. 4. Comparing the filled-up time, C-type is the fastest, next is L-type, and S-type is the slowest.

Comparison of filling behavior varying with sprue shape and height in the case of stopper ladle pouring.

Comparison of filled-up time varying with sprue shape and height in the case of stopper ladle pouring.
Focusing on the state of sprue, S-type is filled earlier than other types. The sprue shape has a stair-step shape therefore it has large flow resistance. The molten metal passed through the ingate inflows to the cavity and fills calmly from the bottom to top. On the other hand, the molten metal for L-type or C-type inflows to the cavity at high speed. Then it collides with central pocket and divides into right and left.
(2) Influence of sprue heightComparing mold filling behavior between sprue height of 220 mm and 150 mm, in the case of 150 mm, molten metal flows and fills more calmly than the height of 220 mm. Although the pouring volume with a sprue height of 150 mm is smaller than that of 220 mm, the filled-up time is later. The velocity at bottom of sprue with a sprue height of 150 mm is slower than that of 220 mm. From these results, even if the pouring method is the same, the filled-up time and flowing velocity are changed depending on the casting design.
(3) Influence of pouring methodFigure 5 shows the comparison of mold filling behaviors varying with sprue shape in the case of tilting ladle pouring. As in shown Fig. 5, in the case of tilting ladle pouring method, the filling times of the sprue and runner are longer than the case of the stopper type shown in Fig. 3. Comparing the sprue shape of L, C, and S-type, the tendency of mold filling behavior with the tilting ladle pouring is more or less the same as with the stopper ladle pouring.
Comparison of filling behavior varying with sprue shape in the case of tilting ladle pouring.
The mold filling simulations are carried out to reproduce actual phenomena with the stopper ladle pouring, using the casting CAE software TopCASTTM.6–8) The influence of the setting method of the inflow and calculation conditions on the filling behavior was investigated.
Theoretical inflow velocity from pouring basin is calculated from Torricelli’s theorem.
| \begin{equation} v_{\textit{theory}} = \sqrt{2gh_{\exp}} \end{equation} | (1) |
| \begin{equation} v_{\textit{ave}} = C_{d}\cdot v_{\textit{theory}} \end{equation} | (2) |
The calculation conditions, mesh conditions, and physical properties are shown in Table 1, Table 2, and Table 3, respectively.


Comparing to the observed results, the results obtained by simulation indicate slower state in the early stage of mold filling and becomes faster after the middle stage of mold filling. Finally, the filled-up time is the same with experimental results.
3.2 Overflow pouring Basin (OFB)The mold filling behavior obtained using average inlet velocity in the case of L-220 and stopper ladle pouring is shown in Fig. 6. Figure 7 shows the comparison of inlet velocity change in the case of L-220. (a) is the average velocity of eq. (2), (b) is from observed result. The mold filling simulation using the inlet boundary condition of the average velocity is difficult to simulate the observed phenomena. The mold filling phenomena are simulated using the inlet velocity observed in the experiments. Further, even if the pouring method is the same, the filled-up time and flowing velocity are changed depending on the casting design. So, in order to reproduce the difference in the mold filling behavior for each casting design, new inlet condition, which is named to “OverFlow pouring Basin” (OFB), is proposed as shown in Fig. 8.

Mold filling behavior obtained using average inlet velocity in the case of L-220 and stopper ladle pouring.

Comparison of inlet velocity change in the case of L-220 in stopper ladle poring. (a) is average velocity by eq. (2), (b) is from observed results, (c) is simulated by OFB.

Overflow pouring basin (OFB).
The overflow height hofb shown in Fig. 8 is calculated from eq. (3).
| \begin{equation} h_{\textit{ofb}} = \frac{1}{2g}\left( \frac{V_{\textit{ofb}}}{A_{\textit{inlet}}\cdot C_{\textit{dd}}\cdot t_{\textit{ofb}}} \right)^{2} \end{equation} | (3) |
Figure 9 shows the mold filling behaviors obtained using OFB varying with sprue shape and height in the case of stopper ladle pouring. Comparing with Fig. 3, the simulated results are more or less the same mold filling behavior with experimental results. The (c) of Fig. 7 is simulated result by OFB. The (c) of Fig. 7 is similar to the actual phenomena (b).

Filling behavior obtained by using OFB varying with sprue shape and height in the case of stopper ladle pouring.
Figure 10 shows the comparison of filled-up time varying with the sprue shape and height in the case of stopper ladle pouring between experiments and simulation. The simulated results, for the filled-up time varying with the sprue shape and height, are agreed with the experimental value.

Comparison of filled-up time varying with sprue shape and height in the case of stopper ladle pouring between experiments and simulation.
Even if there is no experimental result, it is possible to reproduce the flow behaviors similar to the experiment such as the speed through the runner or cavity, and the filled-up time by using the OFB (Overflow Basin) condition. This is the advantage of the overflow (auto-tuning) system in the pouring basin.
3.3 Calculated results of tilting ladle pouringThe theoretical inlet velocity of stopper ladle pouring is a constant value as shown in Fig. 8. On the other hand, it is considered that the inflow rate of tilting ladle pouring is not a constant value but increases or decreases. Figure 11 shows an example of setting inlet velocity in tilting ladle pouring. The mold filling behavior in tilting ladle pouring simulated using OFB and the inlet velocity in Fig. 11 was more or less the same as the experimental result, as in the case of stopper ladle pouring. Figure 12 shows comparison of inlet velocity change in the case of L-220 in tilting ladle pouring. (a) is average velocity by eq. (2), (b) is observed results, and (c) is simulated by OFB. The inlet velocity by using the proposed method was closer to the experimental value than by using average inlet velocity. In comparison with the experimental values, the simulated inlet velocity did not agree well in the early stage of the mold filling. However, in the later stage, the behavior of the inlet velocity decreased due to the effect of OFB was shown correctly. The disagreement in the early stage of the mold filling is for further study.

An example of setting inlet velocity in tilting ladle pouring.

Comparison of inlet velocity change in the case of L-220 in tilting ladle pouring. (a) is average velocity by eq. (2), (b) is from observed results, (c) is simulated by OFB.
The mold filling behaviors for different casting design are investigated by direct observation experiment, the inlet condition and calculation conditions required to obtain suitable calculated results. The conclusion remarks are flowing.