Technical Article
Selective Extraction of Chromium from EAF Stainless Steel Slag by Pressurized Oxidation in a NaOH Solution
2020 Volume 61 Issue 10 Pages 2030-2039
Details
2020 Volume 61 Issue 10 Pages 2030-2039
Chromium was selectively extracted from electric arc furnace (EAF) slag by pressurized oxidation in a NaOH solution. The effect of the temperature (T), NaOH concentration, oxygen pressure and reaction time on the extraction ratio of the chromium was investigated. It was found that the chromium extraction rate was significantly impacted by the temperature. At the optimum conditions of T = 170°C, NaOH concentration of 40 wt.%, oxygen pressure of 1.6 MPa and reaction time of 4 h, a maximum chromium extraction rate of 60.04% was obtained. It was observed by scanning electron microscopy (SEM) with energy dispersive spectrometry (EDS) that the residual particles were enclosed by a “secondary precipitation layer” mainly composed of Fe and O, which prevented further extraction of the chromium from the core residues. The leaching process of chromium was controlled by the diffusion of the solid phase product layer, and the activation energy of the extraction reaction was 56.67 kJ/mol.

Electric arc furnace (EAF) slag is a by-product of the stainless steel-making process, and contains a certain amount of chromium (−4 wt.%).1) Statistics suggest that the output of stainless steel is nearly 13.64 million tons, leading to approximately 4.56 million tons of stainless steel slag in China in 2018.2) Most of the stainless steel slag is stockpiled, and only a small amount is treated for use in cement mixtures and roadbed materials.3–6) Because of the high content of chromium in the stainless steel slag, which may pose an environmental problem as a result of rainwater leaching, the utilization of stainless steel slag is limited.7,8) Chromium is a critical raw material. As reported by Johnson et al.,9) nearly 46,000 tons of chromium were lost because it was entrapped in stainless steel slag. Therefore, selectively extracting chromium from EAF slag is a good approach for eliminating its leaching toxicity and providing a supply of chromium.
Several studies focused on the extraction of chromium have been reported. Guo et al. demonstrated a novel process to extract chromium and aluminum from limonitic laterite ores by Na2CO3 roasting. They found that under the optimal particle size from 44–74 µm, Na2CO3-to-ore mass ratio of 0.6:1 and temperature of 1000°C, the extraction rates of Cr and Al could reach 99% and 82%, respectively.10) Wang et al. introduced an electrochemical field to extract chromium and vanadium from vanadium slag in a concentrated NaOH solution. When the alkali concentration was 40%, the reaction temperature was 120°C, alkali-to-ore mass ratio was 4:1, stirring speed was 1000 rpm and slot current density was 750 A/m2, the extraction rates of Cr and V reached approximately 90% and 95%, respectively.11) Kim et al. investigated the extraction of chromium from stainless steel slag by NaOCl-assisted alkaline leaching and consecutive precipitation of BaCrO4.12) They indicated that the chromium leaching rate from stainless steel slag was 68% at the optimum condition. Chen et al. studied the chromium extraction rate from Philippine chromite ore at a high oxygen pressure in a KOH submolten salt solution.13) They found that the maximum extraction rate reached 98% at the optimal conditions. Liu et al. investigated the chromium leaching rate from chromium ore in concentrated KOH by catalytic oxidation using CuO as the catalyst.14) With the optimal reaction conditions, the leaching rate reached 98%. Thus far, investigations on the selective extraction of chromium from EAF slag by pressurized oxidation in NaOH solution have rarely been reported.
The experimental parameters (e.g., temperature, leaching time, and oxygen pressure) have a significant effect on the extraction rate. Zhang and his colleagues studied the dependence of the chromium leaching efficiency on the ore particle size, NaOH concentration, O2 partial pressure and reaction temperature by pressure oxidative leaching of Indian chromite in a concentrated NaOH solution.15) They found that the NaOH concentration played an important factor in the leaching efficiency. The leaching efficiency increased with NaOH concentrations of 50 wt.% to 60 wt.%, but when the NaOH concentration was 70 wt.%, the leaching efficiency decreased. The effect of the O2 partial pressure and the reaction temperature was positive on the leaching efficiency. Sun et al. investigated the chromium conversion ratio from chromite ore in the KOH–KNO3–H2O binary submolten salt system.16) They discussed the effects of the reaction temperature, mass of KOH-to-chromite ore ratio, oxygen partial pressure and gas flow. They found that the amount of KOH and the oxygen partial pressure played an important role in the reaction. As the amount of KOH and the oxygen partial pressure increased, the chromium conversion ratio increased. Moreover, the chromium conversion rate was positively proportional to the reaction temperature and gas flow.
Although the method of extracting chromium from chromite ore by pressurized oxidation has been widely studied, the kinetic characteristics and the mechanism of the chromium leaching process from stainless steel slag have rarely been reported. In this work, the influence of the temperature, NaOH concentration, oxygen pressure and reaction time on the leaching rate of chromium from stainless steel slag was investigated. An L9(34) orthogonal experiment was used to explore the important parameters for chromium extraction. Single-factor experiments combined with orthogonal experiments were performed to investigate the optimal extraction conditions. X-ray diffraction (XRD) and scanning electron microscopy with energy dispersive spectrometry (SEM-EDS) were performed to study the mechanism of chromium leaching. Additionally, the kinetics of the chromium leaching process were demonstrated. This study can provide a relevant theoretical and methodological basis for the ecological risk of stainless steel slag resource utilization to promote the comprehensive utilization of stainless steel slag and other hazardous solid wastes, which has important strategic significance.
The EAF slag used for this work was collected from a Chinese stainless steel plant. The obtained EAF slag was first crushed by a crusher, and the Fe–Cr alloy metal drop was extracted by magnet. Then sieved using a 200-mesh sieve. The particle size has an important influence on the extraction ratio of chromium from stainless steel slag. The smaller the particle size is, the larger the specific surface area of the slag is, which promotes the chromium extraction ratio.17,18) To maximize the extraction of chromium from the stainless steel slag, an undersized EAF slag (<75 µm) was chosen for the extraction experiments and physical analysis after being dried for 6 h at 105°C to remove the free moisture.
2.2 Experimental apparatus and proceduresThe extraction experiments were performed in a cylindrical autoclave with a volume of 500 ml. An illustration of the apparatuses is shown in Fig. 1.

Illustration of the apparatuses used for the extraction experiment. 1. Stirrer, 2. Agitator cooling water inlet, 3. Air inlet, 4. Material cooling water inlet, 5. Material cooling water pipe, 6. Stirring blade, 7. Oil pipeline, 8. Gas cylinder, 9. Reactor controller, 10. High temperature circulator, 11. Oil pipe, 12. Material cooling water outlet, 13. Air outlet, 14. Thermocouple, and 15. Agitator cooling water outlet.
The high-pressure reactor consisted of three parts: the oil bath, the high-pressure reactor, and the oxygen cylinder. The temperature of the reactor was limited 180°C, and the pressure was limited 20 MPa. The system was heated through an oil bath, and then the heated oil was introduced into the reactor across the pipeline. Afterwards, it went back to the bath past the discharge pipe to circulate and ensure the temperature in the reactor. The oxygen was introduced into the reactor from the cylinder with a gas value within a gas pipeline. The deionized water, NaOH, and EAF slag were first loaded into the reactor at the calculation ratio. When the temperature reached the preset value, the O2 was fed into the reactor and stirring started.
When the reaction was over, the cooling water decreased the temperature to below the boiling point of the mixture. The slurry was filtered to obtain the leaching solution and the residue. Subsequently, the residue was washed with deionized water repeatedly and dried for further analysis.
2.3 Analytical methodsThe chemical composition of the original EAF slag was analyzed by X-ray fluorescence (XRF, DE 2000), quantified with the appropriate software and exported as oxide form. This analysis was performed twice.
The mineralogical compositions of the original EAF slag and the leached EAF slag were detected by XRD. The XRD patterns were collected by an X-ray diffractometer (D/MAX2500PC) with Cu-Kα radiation at 40 mA and 45 kV, a scanning rate of 5° 2θ min−1, and a 2θ range of 15° to 75°. The content of the obtained phases was calculated using the adiabatic method.19) The microstructure of the original EAF slag and the leached EAF slag was examined using SEM (Hitachi S-4800) on an instrument equipped with energy dispersive spectrometry (EDS, Bruker). The original EAF slag and the leached EAF slag were embedded in phenolic resin. The sample surface was polished to a smooth and flat finish and then coated with a conductive film to enhance the electrical conductivity.
Using the diphenylcarbazide spectrophotometric method, the total chromium concentrations of the leachate were analyzed by UV-visible spectrophotometry.20,21) Based on the obtained value of total chromium concentration, the chromium extraction ratio was calculated using eq. (1):
| \begin{equation} \eta = \frac{C_{\text{s}}\times V_{\text{s}}}{1000m_{\text{t}}}\times 100\% \end{equation} | (1) |
The chemical composition of the original EAF slag obtained with XRF is listed in Table 1. The test results are presented in the form of oxides. As shown in Table 1, the major components in the EAF slag were SiO2 (30.72 wt.%) and CaO (39.07 wt.%). In addition, there was a certain amount (2–6 wt.%) of MgO, MnO, Al2O3, TiO2 and Fe2O3 in the original EAF slag. The Cr2O3 weight content was 6.40 wt.%. Vanadium was a trace element, that occurred as V2O5. The V2O5 weight content was 0.68 wt.%. The EAF slag was an alkaline slag with a ternary basicity ((CaO+MgO)/SiO2) of 1.40. Similar results were reported by G. Adegoloye.22) They found that the contents of CaO and SiO2 were 34.70% and 41.70%, respectively, and the content of Cr2O3 was 3.5% in the original EAF slag through XRF analysis. Zhang et al. found that the EAF slag mainly consisted of Ca, Mg, Al, Si, Fe, O and Cr by XRF analysis.23)

Figure 2 shows the XRD patterns of the original EAF slag. The results of the XRD analysis indicate that the original EAF slag was mainly composed of wollastonite (CaSiO3), diopside (CaMg(SiO3)2), augite ((Ca,Mg,Fe)Si2O6), magnetite (Fe3O4), Fe–Cr spinel (FeO·Cr2O3) and chromium oxide (Cr2O3). The contents of the mineralogical compositions were quantitatively analyzed and are shown in Table 2. As shown in Table 2, the weight contents of the wollastonite and the diopside were 43.3 wt.% and 20.4 wt.%, respectively, and were the main phases in the original EAF slag. The Fe–Cr spinel and chromium oxide were the main chromium-bearing phases with weight contents of 6.6 wt.% and 13.4 wt.%, respectively, in the original EAF slag. The results are similar to those of other studies in which the EAF slag was composed of silicates and chromium oxide or chromium bearing phases. For instance, Shi et al. found that stainless steel slag mainly consisted of merwinite(Ca3MgSi2O8), larnite(2CaO·SiO2) and chromium-bearing minerals.24) Zhang et al. determined that the mineralogical composition of an original EAF slag was mainly composed of dicalcium silicate(Ca2SiO4), merwinite(Ca3MgSi2O8) and metal oxide through XRD.23) G. Adegology et al. investigated the mineralogical composition of an EAF slag through XRD analysis of five parallel samples and found that the EAF slag was composed of akermanite(Ca2MgSi2O7), rankinite(Ca3Si2O7), cuspidine(3CaO·2SiO2·CaF2), perovskite(CaTiO3) and chromium spinels.25)

XRD patterns of the original EAF slag.

The results of SEM-EDS are show in Fig. 3 and Table 3. It could be known that chromium in the EAF slag was present in the Cr oxide, Fe–Cr alloy metal drop and the Fe–Cr spinel (Fig. 3(a), (c), and (e), respectively). They were enclosed in the silicate matrix phases (Fig. 3(b), (d), (f)). Shen et al. found that the minerals in the EAF slag and AOD slag were mainly Fe–Cr–Ni alloy drops, Fe–Cr oxides, Ca–Mg–Al silicates and Ca–Mg oxides (f-CaO and MgO); they also found that Fe, Cr and Ni mostly existed as free-form alloy particles, bonded particles and complex particles by SEM-EDS analysis.26) Wang et al. demonstrated that chromium was largely contained in iron–chromium alloys, chromite and silicates by qualitative and quantitative analysis of various elements in the slag.27)
SEM images of the original EAF slag.

The influence of the temperature on the chromium extraction ratio was investigated under the conditions of NaOH concentration = 20 wt.%, oxygen pressure = 0.8 MPa, stirring rate = 800 r min−1, liquid-solid ratio (L/S) = 5 L kg−1, T = 80–180°C and leaching time (t) = 1–6 h. The variation of the chromium extraction ratio as a function of temperature is shown in Fig. 4.

Variation of the chromium extraction ratio as the function of the temperature.
As shown in Fig. 4, the chromium extraction ratio increased with increasing temperature. The maximum chromium extraction rate was 19.04% at a temperature of 180°C after 360 min. In section 3.1, the chromium was mainly present in the form of Cr2O3 and Fe–Cr spinel in the original EAF slag. The changes in the Gibbs energy (ΔG298K) for the oxidation reaction of Cr2O3 and FeCr2O4 with pure oxygen in the presence of NaOH were calculated using the reaction module of Factsage 7.0 at 0.8 MPa. The oxidation reaction equations are listed under the conditions. The results showed that the oxidation reactions occurred spontaneously in the presence of NaOH. And the results are similar to those by E. Kim using HSC Chemistry 5.0.17) Because the ΔG of the reaction is negative, the chemical equilibrium constant of the oxidation reaction changed with an increase in the temperature, which accelerated the chemical reaction rate.28) Moreover, with an increase in the temperature, the solubility of the product around the EAF slag also increased and promoted the oxidation reaction.29) Furthermore, the increase in the temperature also lowered the viscosity of the reaction system to accelerate the mass transfer rate of various substances in the solution. Therefore, the oxidation reaction was quickened.30)
| \begin{equation} \text{2Cr$_{2}$O$_{3}$} + \text{3O$_{2}$} = \text{4CrO$_{3}$}\quad \Delta \text{G}_{\text{298K}} = 36.989\,\text{kJ/mol} \end{equation} | (2) |
| \begin{align} &\text{Cr$_{2}$O$_{3}$} + \text{4NaOH} + \text{1.5O$_{2}$} = \text{2Na$_{2}$CrO$_{4}$} + \text{2H$_{2}$O} \\ &\quad \Delta \text{G}_{\text{298K}} = -386.139\,\text{kJ/mol} \end{align} | (3) |
| \begin{align} &\text{FeCr$_{2}$O$_{4}$} + \text{1.5O$_{2}$} + \text{4NaOH} = \text{FeO} + \text{2Na$_{2}$CrO$_{4}$} + \text{2H$_{2}$O}\\ &\quad \Delta \text{G}_{\text{298K}} = -321.654\,\text{kJ/mol} \end{align} | (4) |
Since no significant benefit was obtained when the temperature was higher than 160°C, T = 160°C was chosen as the optimum temperature to reduce energy consumption and maintain the equipment.
3.4 Effect of NaOH concentration on the chromium extraction rateThe chromium extraction rate in a NaOH concentration that ranged from 20 wt.% to 50 wt.% was performed at 160°C, an oxygen pressure of 0.8 MPa, a liquid-solid ratio (L/S) = 5 L kg−1, with particle size less than 75 µm, and a stirring rate of 800 r min−1.
Figure 5 indicates that 40 wt.% seemed to be the optimal NaOH concentration; moreover, the chromium extraction rate reached 42.96% after 360 min, compared with only 30.10% and 38.15% when the NaOH concentration was 30 wt.% and 50 wt.%, respectively. It is obvious that the chromium extraction rate increased with increasing NaOH concentration when the NaOH concentration ranged from 20 wt.%–40 wt.%. When the NaOH concentration increased, the reaction activity of the dissolved oxygen and OH− increased, further promoting the oxidation reaction thermodynamically.31)

Variation of the chromium extraction rate as a function of the temperature and time.
However, when the concentration of the NaOH was 50 wt.%, the extraction rate was lower than when the NaOH concentration was 40 wt.%. This is because when the NaOH concentration was 20 wt.%, 30 wt.%, 40 wt.% and 50 wt.% at 160°C, the viscosity of the reaction system was 8.97 mPa·s, 12.61 mPa·s, 16.02 mPa·s and 20.98 mPa·s, respectively. When the NaOH concentration increased, the viscosity of the reaction system increased simultaneously. This greatly reduced the mass transfer rate of the various substances in the system.32–34) Also, the oxygen dissolved in the solution mainly acted as the oxidant instead of the gaseous form. Therefore, the oxygen solubility was greatly reduced, which decreased the oxygen mass transfer rate and hindered the oxidation reaction.15)
Thus, a concentration of 40 wt.% NaOH was selected to be the optimal NaOH concentration.
3.5 Effect of oxygen pressure on chromium extraction rateThe influence of the oxygen pressure was conducted at 160°C, with a NaOH concentration of 40 wt.%, liquid-solid ratio (L/S) = 5 L kg−1, particle size less than 75 µm, and stirring rate of 800 r min−1. A series of oxygen pressures ranging from 0.8 MPa to 1.4 MPa was investigated. The results are shown in Fig. 6.

Variation of the chromium extraction rate as a function of the oxygen pressure and time.
As shown in Fig. 6, the chromium extraction rate increased with increasing oxygen pressure. This data also demonstrates that 1.4 MPa appeared to be the suitable oxygen pressure after 360 min; at this time, the chromium extraction rate was 47.16%. However, the influence of the oxygen pressure was small. The relationship between the oxygen pressure and dissolved oxygen proposed by Tromans is shown as eq. (5).35,36)
| \begin{align} C_{O_{2}} &= 7.18\times 10^{-4} \times P_{O_{2}} \\ &\quad \times \left( \frac{1}{1 + 0.102078\times \text{C}_{\text{KOH}}^{1.00044}}\right)^{4.3089} \end{align} | (5) |
In eq. (5), the concentration of the dissolved oxygen in the reaction system is proportional to the oxygen pressure in the reactor. With increasing oxygen pressure, the concentration of dissolved oxygen increases, which promotes the oxidation reaction.
Above all, from the single-factor variable experiment, the optimal experimental conditions were as follows: temperature of 160°C, NaOH concentration of 40 wt.%, oxygen pressure of 1.4 MPa, and a reaction time of 6 h. In the selected experimental range, the extraction ratio of chromium in the EAF slag reached a maximum of 47.16%.
3.6 Orthogonal experimentOrthogonal experiments were performed to further optimize the experimental parameters. The scheme of the orthogonal experiment is shown in Table 4. The results of the orthogonal experiment are shown in Fig. 7.


The obtained chromium extraction rate from the orthogonal experiments.
In Fig. 7, the chromium extraction rate reached the maximum value under the conditions in experiment 8 and was 55.37%. The range analysis results of the orthogonal experiments are shown in Table 5.

According to Table 5, we can conclude that the degree of the influence of each factor on the chromium extraction ratio was: temperature > time > NaOH concentration > oxygen pressure. The optimum leaching parameters for chromium extraction were a temperature of 170°C, a NaOH concentration of 40 wt.%, an oxygen pressure of 1.6 MPa, and a reaction time of 4 h. Under the optimal leaching conditions, the maximal extraction ratio was above 60.04%.
The content of chromium in the residues obtained under the optimal conditions was examined by XRF. The results are shown in Table 6. The chromium extraction rate was 61.34%. The result is similar to the extraction rate of the leachate.

In section 3.2 to 3.6, under the optimal conditions, the extraction ratio only reached 60.04%. To investigate the mechanism of the chromium leaching process, an extension of the reaction time was carried out. The results are shown in Fig. 8.

The results under the optimal experimental conditions with an extended time.
As shown in Fig. 8, the extraction ratio of chromium obviously increased from 1–4 h, but hardly increased after 4 h. The maximum extraction rate of 63.71% was obtained after 12 h. Therefore, the leaching process nearly finished at 4 h, and the extraction ratio was 60.89%. Then, XRD and SEM-EDS analyses of the leached EAF slag were performed.
The XRD pattern of the original slag and residue from the optimal extraction conditions is shown in Fig. 9. The intensity of the silicate phases, such as wollastonite, augite and diopside, gradually decreased with increasing chromium extraction ratio because these silicate phases could undergo hydration reactions. Moreover, compared with the original EAF slag, the intensity of the chromium oxides and Fe–Cr spinel declined. The SEM results of the original slag and residues at each reaction time are shown in Fig. 10. The EDS analysis of the micro-scale with different gray levels is shown in Table 7.

XRD patterns of the original slag residue from the optimal extraction conditions.

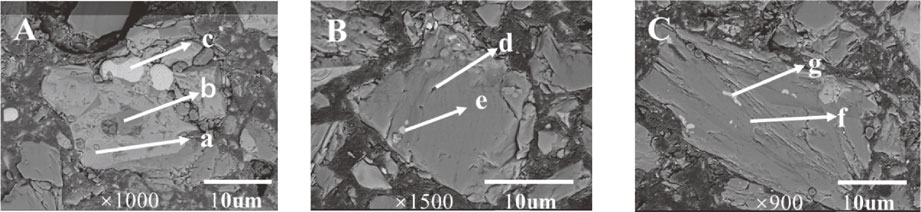
SEM-EDS images of representative residues at different times. (A) 0.5 h, (B) 1 h, (C) 2 h, (D) 4 h, (E) 6 h, (F) 8 h, and (G) 12 h.

Figure 3 shows that the chromium mainly existed in the form of chromium oxide and Fe–Cr spinel, which were enclosed in the silicate phases. The slag particles had regular shapes. However, upon focusing on the gray level areas (Fig. 10(A), (B), and (C)), it can be seen that the surface of the slag particles had a progressive increase in roughness. The silicates were mostly dissolved, and the Cr oxides were also oxidized after 2 h. With increasing reaction time, the Fe–Cr spinel enclosed in the silicates became oxidized. However, in Fig. 10(E), (F), and (G), the slag particles were enclosed by a secondary phase product. The EDS results show that the secondary phase product was mainly rich in Fe and O, and the thickness increased with time. Using the HSC Chemical, the E-pH diagram of the Fe–Cr–H2O system was drawn. The result is shown in Fig. 11, which demonstrates that when the pH was very large, Fe3O4 was found in the system. Therefore, according to Table 7, the secondary phase product may be Fe3O4.

E-pH diagram of the Fe–Cr–H2O system at 25°C and 1 atm.
Other studies also found this phenomenon.37,38) Zhang et al. added KNO3 to intensify the decomposition of chromite ore by submolten KOH.37) After decomposition for 90 min, the secondary product phase was also formed, which mainly consisted of O, Fe, Si, Al, Mg and K, and did not contained a substantial amount of Cr according to SEM-EDS. Moreover, the secondary phase product gradually thickened after 240 min. During the later stage of the reaction, the unreacted Fe–Cr spinel was enclosed by the secondary phase product, which hindered the oxidative reaction. Therefore, the chromium leaching process may be controlled by the diffusion in the reaction product layer.
3.8 Microkinetical analysisThe apparent activation energy and chemical reaction rate constant can be calculated through the influence of the temperature on the chromium extraction ratio to analyze the chromium leaching mechanism.
During the reaction, the EAF slag was gradually corroded by the NaOH. As shown in Fig. 3 and Fig. 10, the surface of the EAF slag changed from a regular compact appearance to an irregular and compact unreacted core. The leaching process could be described as oxygen and OH− passing through the porous silicates such that oxidation occurred on the surface of the Fe–Cr spinel. Then, Cr6+ migrated to the solution. This process is illustrated in Fig. 12. As demonstrated by other researchers, the chromium leaching process conformed to the unreacted shrinking core model.39,40)
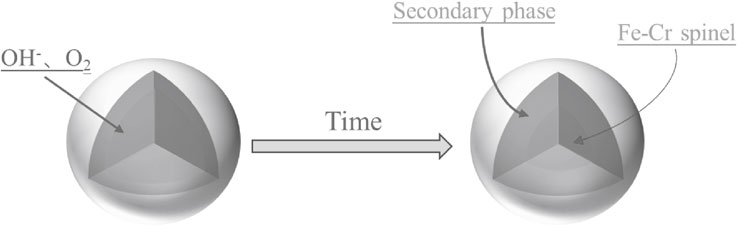
Leaching process of the chromium.
The leaching process is generally controlled by the following three steps: diffusion of the reagent through the product layer (liquid phase boundary layer diffusion), surface chemical reaction and diffusion of the solid product layer.13)
Assuming that the EAF slag particles were spherical structures and that the leaching process was controlled by liquid phase boundary layer diffusion, the shrinkage core model can be described by eq. (6):
| \begin{equation} X = \text{k}_{\text{i}}t \end{equation} | (6) |
When the leaching process is controlled by surface chemical reactions, the shrinking core model is described by eq. (7):
| \begin{equation} 1 - (1 - X)^{1/3} = \text{k}_{\text{i}}t \end{equation} | (7) |
When the leaching process is controlled by diffusion of the solid phase product layer, the shrinking core model of the process can be described by eq. (8):
| \begin{equation} 1 - 2X/3 - (1 - X)^{2/3} = \text{k}_{\text{i}}t \end{equation} | (8) |
To determine the steps that control the leaching process, the experimental data at 120°C from the single-factor variable experiment were substituted into eqs. (6), (7) and (8), and the resulting fatting data map is shown in Fig. 13.
As shown in Fig. 13, the correlation coefficients R2 of the three equations were 0.897, 0.8996 and 0.9394, respectively. It can be concluded that eq. (8) fit the experimental data well. Other reports demonstrated similar results through this method. For instance, Liu et al. extracted Cr from vanadium slag using molten NaOH–NaNO3 binary melts. They fit the chromium conversion at 325°C in three reaction formulas and found that 1 + 2(1 − X) − 3(1 − X)2/3 = kt fit the experimental data well, so they concluded the decomposition process was controlled by the mass transfer in the product layer.41) Zhang et al. extracted chromium from Indian chromite ore in a concentrated NaOH solution. They fit the experimental data at 215°C to the three different reaction mechanisms and found that 1 − 2/3X − (1 − X)2/3 = DsCAOt/2ρr02 fit the data well, so the mass diffusion in the solid product layer was the rate-determining step.15)
A statistical analysis was conducted. According to the experimental results, it could be found that when the temperature was higher than 160°C, the reaction tended to end, at this time the chromium extraction ratio almost reached its maximum value. So it is not appropriate to use the data with a longer reaction time during the fitting at this situation. The same situation existed in the study of Zhang, they used the data before reaching the maximum value of each reaction temperature when fitting the Cr extraction ratio and the reaction time.15) The data of 1 h, 2 h, 3 h and 4 h at 160°C and 180°C was used to fit. And the result are shown in Fig. 14. It illustrates that the slopes of these plots are the apparent rate constants. The slopes were 0.02 × 10⁻³, 0.14 × 10⁻³, 1.11 × 10⁻³ and 1.07 × 10⁻³.

Kinetics of chromium leaching in the reaction temperature range.
According to the Arrhenius equation integral in eq. (9), the logarithm of the rate constant at each temperature can be obtained as shown in Fig. 15:
| \begin{equation} \ln k_{i} = \ln \text{A} - \frac{\text{E}_{\text{a}}}{\text{R}T_{i}} \end{equation} | (9) |

Natural logarithm of the reaction rate constant versus the reciprocal of the experimental temperature.
From the results in Fig. 15, the activation energy of the reaction was calculated to be 56.67 kJ/mol, and the control step of the leaching process was solid phase product diffusion control.
A hydrometallurgical method was investigated to extract chromium from EAF stainless steel slag. The leaching rate of chromium reached 60.04% at a reaction temperature of 170°C, NaOH concentration of 40 wt.%, oxygen pressure of 1.6 MPa, a reaction time of 4 h, a particle size below 75 µm and a stirring rate of 800 r min−1.
According to the XRD and SEM-EDS analysis of the raw slag and the residues, the microscopic morphology of the slag particles was destroyed, and the regular polygonal and plate-like structures became irregular and rough. Most of the silicate mineral phases, such as wollastonite, diopside and augite, dissolved, causing the encapsulated chromium oxide and Fe–Cr spinel to be exposed and oxidized. With increasing time, the surface of the residues produced a secondary phase, which was mainly composed of Fe and O, preventing further leaching of the chromium.
The kinetics study shows that the leaching process conforms to the shrinkage core model and was mainly controlled by the diffusion of the solid phase product layer. The activation energy of the reaction was 56.67 kJ/mol.
The authors gratefully acknowledge the support of the National Nature Science Fund Project (No: 51704119, No: 51574108), the HeBei Natural Science Fund Project (E2017209243), and the School Funds for Distinguished Young Scientists (JQ201714).
