Abstract
To study on erosion-corrosion behavior and mechanism of Ni–P coating (Ni–P) and Ni–P coating after heat treatment at 400°C (h-Ni–P) in liquid flow and solid-liquid flow, the numerical simulation, microstructure, and electrochemical methods were applied. It could be seen that the spherical structure of the coating surface was no longer dense, and the coating changed from amorphous to crystalline after heat treatment at 400°C. Numerical simulation showed that the coating possessed a higher velocity and a small static pressure at the edge in the straight pipe. The electrochemical analysis showed that the icorr of Ni–P and h-Ni–P became larger and the Rp became smaller as the solution speed increased, the icorr of h-Ni–P was larger than that of Ni–P, the Rp of Ni–P was larger than that of h-Ni–P. In addition, the both coating had a higher icorr in the solid-liquid flow than that of the liquid flow at the same speed. The results indicated that the corrosion resistance of Ni–P coating was reduced because it had become the crystal after heat treatment at 400°C. The numerical simulation was helpful to reveal the local stress information of Ni–P coating under flow.

1. Introduction
The carbon steel has a large proportion of economic losses due to widespread used and corroded in shipbuilding, bridge engineering and pipeline construction.1) Therefore, it is urgent to improve the performance of carbon steel in order to reduce economic losses. One of the way to improve corrosion resistance of carbon steel is to prepare an electroless Ni–P on its surface.2,3) Electroless Ni–P coating is an amorphous coating with high corrosion resistance, uniformity, high strength, and high hardness.4,5) It has been widely used in automobiles, aviation, computers, electronics, machinery, chemicals, light industry, petroleum industry, etc.6,7) Since developed in the 1940s by A. Brenner and G. Riddell,8) the method of electroless Ni–P coating had been a relatively mature technology by overcoming many difficulties such as bath regeneration, bath stability, coating performance test.9,10) The advantage of electroless Ni–P coating is that it can obtain a uniform thickness of alloy film on any complex shape of the substrate, and it has the characteristics of economy, low energy consumption and convenient operation.11,12)
In recent years, electroless Ni–P coating, Ni–P based composite coating as well as their properties were extensively studied.13,14) P. Shoghi, et al.15) introduced that the corrosion resistance of the magnesium alloy was strongly improved after coating Ni–P. B. K. Choi, et al.16) investigated the performance of electroless Ni–P coating/carbon fibers heated at different temperature. They found that 400°C was a critical temperature for the performance of Ni–P coating. Z. Jiang, et al.17) reported that the corrosion resistance of electroless Ni–P–Sn coating was greatly affected by heating at 400°C. In addition, the researches on the corrosion resistance of Ni–P coating were generally carried out in static condition, while the performance and mechanism of Ni–P coating during serving in complex flow like flow and that with solid particles need further investigation especially.18,19)
The present work is to study the erosion-corrosion behavior and mechanism of Ni–P coating (Ni–P) and that heated at 400°C (h-Ni–P) in the flow and that with solid particles by numerical simulation, electrochemical and microstructure method. The results of the study will provide a novel insight into the erosion-corrosion behavior and mechanism of Ni–P coating.
2. Materials, Experiment, and Numerical Simulation
2.1 Electroless Ni–P coating
Q235 carbon steel with a thickness of 4 mm and a surface area of 10 mm × 10 mm as the substrate was used to electroless Ni–P coating. First, the bath of electroless Ni–P coating consisted of NiSO4·6H2O (25 g/L), CH3COONa (11 g/L), NaH2PO2·H2O (16 g/L), C6H8O7 (4 g/L), C12H25SO4Na (0.4 g/L), CH4N2S (0.5 mg/L). Second, the substrate was placed in the bath of electroless Ni–P coating with rpm of 200 for 3 h and temperature was kept at 85°C. The way for processing substrate can be found in the published literature.20) Third, the achieved Ni–P coating was placed in a furnace, the rate of temperature increased in the furnace was 10°C/min. The coating was kept the temperature at 400°C for 1 hour and cooled in the furnace for 20 minutes, then taken it out, the Ni–P coating (Ni–P) and the heat-treated Ni–P coating (h-Ni–P) as a comparison.
2.2 Experimental setup and method
The schematic experimental setup of erosion-corrosion was shown in Fig. 1. Three different speeds (0.4 m/s, 0.8 m/s, 1 m/s) were studied, which were the calculated average speeds, depending on the flow through the section per unit time. The 0.6 mol/L NaCl solution was used as test solution. In addition, 5 mass% SiO2 particles were added to the solution at different speeds in order to study the effect of the solid-liquid flow on the corrosion resistance of Ni–P coating and h-Ni–P coating. Figure 2 showed the microscopic morphology and diameter of particles. It could be seen that the particles have a random polyhedral structure with sharp edges, and the average diameter of it about 4 µm by SEM.

The morphologies were investigated by a scanning electron microscope (SEM, EVO MA15 Zeiss, Carl Zeiss Co, Oberkochen, Germany), which equipped with an energy-dispersive X-ray spectrometer (EDS, Oxford). The micromorphology of nanoscopic resolution was observed by a transmission electron microscope (TEM, FEI Tecnai G2 F20). The composition of the coating was measured by an X-ray diffractometer (XRD, DX-2700). The diameter of the particles was tested by Masetersizer 2000. The hardness of Ni–P and h-Ni–P were tested by a micro hardness tester (HVS-1000).
Electrochemical tests were carried out by the electrochemical workstation CS310, which were manufactured by China Wuhan Corrtest Instruments Corp., Ltd. All electrochemical tests were performed in 0.6 mol/L NaCl solution in room-temperature. A three-electrode electrochemical cell with sample (Ni–P or h-Ni–P) as working electrode, a saturated calomel electrode as the reference electrode and a platinum electrode as the auxiliary electrode were used. All samples were initially immersed in the solution for 2 h. The voltage of electrochemical impedance spectra (EIS) tests was 10 mV, the frequency ranges were 10 mHz–100 kHz. As well, the scanning speed of potentiodynamic polarization tests was 1 mV/s. The range of voltage was −500 mV to +1500 mV relative to open circuit potential. To achieve an acceptable level of accuracy, each test was repeated three times.
2.3 Numerical simulation of flow
The experimental process was simulated by finite element method. As shown in the Fig. 3, the corresponding two-dimensional physical model was established based on the experimental process. The total number of nodes and units was 2394 and 1897, respectively. Meanwhile, the speed entrance and exit were AB and CD respectively, and the solid wall boundaries were AD and BC. The inlet speed is 1 m/s based on the maximum average speed. The following assumptions were made: the liquid flow was assumed to be isothermal, and the fluid was assumed to be incompressible steady-state flow. The standard k-ε model was selected.21) The simple algorithm was used to iterate in 2000 steps to simulate the speed field and stress field.
3. Results and Discussion
3.1 Morphological and elemental analysis
Figure 4(a) showed the morphology of Ni–P possessed spherical characteristic. The spheres (Ni–P nucleus) were organized alongside each other without cracks, holes and other defects, which were consistent with the research of J. Naderi et al.22) It also could be seen in Fig. 4(b) that the morphology of h-Ni–P possessed spherical characteristic, but the size of the spherical tissue was uneven, as shown in the circle. Moreover, the hardness of Ni–P and h-Ni–P were HV0.1 = 366 and HV0.1 = 527 respectively, which were lower than that of normal electroless Ni–P coating because the change of P contents in the coating.23) Figure 4(c), (d) showed that the coating was tightly bonded to the substrate and the thickness of both coatings were 16∼18 µm. Figure 4(e) was the result of TEM morphology. It indicated that the Ni–P coating possessed the structure of nanocrystalline or the mixed structure composed of amorphous and nanocrystalline. Table 1 gave the results of the elemental compositions of Ni–P and h-Ni–P by EDS analysis. It could be seen that the content of P in Ni–P and h-Ni–P were 5.73 mass% and 5.83 mass% respectively, which was beneficial to improve the corrosion resistance of the achieved coatings.24) Meanwhile, it also indicated that the elemental composition of Ni–P coating was not changed after heat treatment at 400°C.


Table 1 The amount of different elements (EDS results) in Ni–P and h-Ni–P.
The XRD pattern of Ni–P and h-Ni–P were shown in Fig. 5. It could be observed that Ni–P have an amorphous structure with few crystalline phases, while the diffraction peaks of h-Ni–P showed that crystalline phases, Ni and Ni3P were formed after heat treatment at 400°C. Meanwhile, the crystalline structure of h-Ni–P changed from amorphous structure induced higher hardness.
3.2 Numerical simulation analysis
The flow field at 1 m/s was simulated to further investigate the environmental conditions of the local area of the coating during erosion-corrosion. The speed vector under the flow speed of 1 m/s was shown in Fig. 6(a), it could be seen that the speed vectors went along the normal direction of the coating surface first and then they became the diffusion flow around the sample surface when it collided with the coating surface, and finally a swirling reflow was generated on the back side of the sample. Meanwhile, the flow speed was around 0.27 m/s at the center of the coating surface. Then the speed was gradually increased from the center to the edge of the coating, as shown in Fig. 6(b). As indicated by the arrows, the fluid speed reached to around 1.08 m/s at the edge of the coating due to the influence of the straight pipe wall. Finally, the flow field had a minimum speed of 0.1 m/s on the back side of the sample due to the effect of reflow. In addition, Fig. 6(c) showed a maximum pressure of 713.5 Pa at the center of the coating surface, followed by a gradual decrease from the center to the edge of the coating. The maximum negative pressure was −0.06 Pa by the arrows in the figure. The reason was that positive static pressure along the flow direction of the corrosive solution. The positive pressure appeared when the flow contacted the surface of Ni–P coating. The vortex formed on the back of Ni–P coating after the flow collides with the sample, which causing negative pressure appeared.

Nyquist plots acquired from EIS test of Ni–P (a) and h-Ni–P (b) in 0.6 mol/L NaCl solution without (liquid flow) and with SiO2 particles (solid-liquid flow) at different speeds were depicted in Fig. 7. The reaction of electrode mainly due to the surface charge transfer process. The large diameter of capacitance arc indicates that the charge transfer resistance was large. The size of the capacitance arc in the EIS spectrum reflected the size of the charge transfer resistance.25) The radius of the capacitance arc decreased as the speed increased, and the arc radius of Ni–P and h-Ni–P in solid-liquid flow was smaller than that in the liquid flow at the same speed. Meanwhile, the capacitance arc radius of Ni–P (a) was larger than that of h-Ni–P (b) at the same speed of flow or the same corrosive medium. Furthermore, the typical Nyquist plots of Ni–P and h-Ni–P in Fig. 7 could be fitted by widely used equivalent circuits in Fig. 8.26) In the equivalent circuits, the electrolyte resistance and the pore resistance at the surface are Rs and Rf, respectively. The CPEf was not an ideal capacitor as a constant phase element.27) The metal/electrolyte interface was represented by Rct and CPEdl. The metal/electrolyte interface was exposed to the electrolyte through defects in the Ni–P and h-Ni–P and was therefore in series with Rf. The relevant polarization resistance (Rp) was evaluated by the mathematical sum of Rct and Rf.28) Meanwhile, the material had higher corrosion resistance when the Rp was larger. The Rps of Ni–P (a) and h-Ni–P (b) in 0.6 mol/L NaCl solution without (liquid flow) and with SiO2 particles (solid-liquid flow) at different speeds were summarized in Fig. 9. As evident from Fig. 7 and Fig. 9, the corrosion resistance decreased with the increased of speed and the coating had lower corrosion resistance with the addition of solid particles. The Ni–P possessed higher resistance against corrosion with respect to h-Ni–P. The reason was that the interaction of Ni–P or h-Ni–P with Cl− was accelerated with the increased of speed and the erosion-corrosion process of Ni–P and h-Ni–P was romoted by mechanical impact and chemical reaction.


The polarization curves of Ni–P (a) and h-Ni–P (b) in 0.6 mol/L NaCl solution without (liquid flow) and with SiO2 particles (solid-liquid flow) at different speeds were shown in Fig. 10. Corrosion characteristics (Ecorr and icorr) of Ni–P and h-Ni–P were provided in Table 2. It could be seen that the changes in the Ecorr of Ni–P and h-Ni–P were complicated at different speed conditions, but the Ecorr decreased with the addition of the solid particles. The icorr was not stable, while the trend of changing was reliable after many experiments. Meanwhile, it showed that the icorr do not linearly depend on the flow rate, but it could be observed that the higher icorr (3.219 µA/cm2) occured at the higher speed (1 m/s) of flow and the icorr of Ni–P and h-Ni–P increased with the addition of the solid particles. In addition, the icorr of h-Ni–P was higher than that of Ni–P at the same speed of flow. For example, the icorr of h-Ni–P in liquid flow was 4.231 µA/cm2, which was higher than that of Ni–P at the speed of 1 m/s. However, the icorr of h-Ni–P in solid-liquid flow was less different from that in liquid flow at the speed of 0.4 m/s. The reason was that the hardness of the coating was increased 161 HV0.1 by the appearance of Ni and Ni3–P in h-Ni–P, which reduced the damage of solid particles to the coating surface. Therefore, the collision of the particles had little effect on the corrosion resistance of the coating when the speed of solid particles was low. Overall, the corrosion resistance of Ni–P and h-Ni–P decreased with the increased of the speed and the corrosion rate of Ni–P and h-Ni–P in solid-liquid flow was higher than liquid flow. Meanwhile, the corrosion resistance of Ni–P was higher than h-Ni–P, because crystalline Ni3–P precipitated from amorphous Ni–P of h-Ni–P after the heat treatment at 400°C had various active sites at the grain boundary, which easily induced corrosion and decreased corrosion resistance.

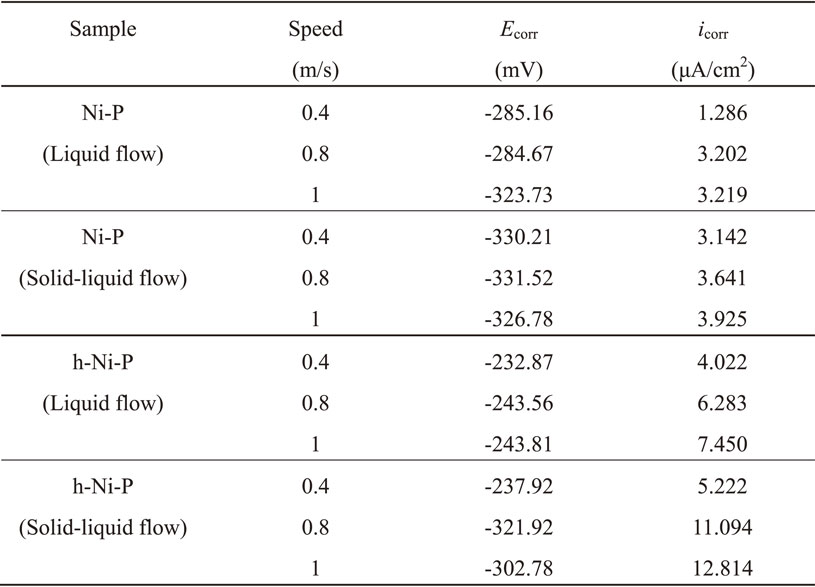
Table 2 Ecorr and icorr of Ni–P and h-Ni–P in 0.6 mol/L NaCl solution without (liquid flow) and with SiO2 particles (solid-liquid flow) at different speeds.
The corrosion mechanism of Ni–P coating and h-Ni–P coating in 0.6 mol/L NaCl solution without (liquid flow) and with SiO2 particles (solid-liquid flow) at different speeds were analysed, as shown in in Fig. 11. Ni–P coating possessed satisfied corrosion resistance because it had an amorphous structure and lacked sensitive locations such as grain boundaries, dislocations, and second-phase precipitation.29) However, uneven distribution of Ni and P elements may exist on the surface of the Ni–P coating during the electroless process, which induced the generation of corrosive galvanic cells. Therefore, the dynamic equilibrium Ni → Ni2+ + 2e− was destroyed, and the soluble NiCl2 was formed by the reaction of Ni2+ + 2Cl− → NiCl2.30) Then the corrosion pits developed by the reaction of autocatalysis.31) The speed of flow at the center of the surface of Ni–P and h-Ni–P was the smallest, then the speed of flow gradually decreased from the center area. In liquid flow, the interaction between Cl− and the coating surface was strengthened when the speed of the corrosive solution was increased, and thus the corrosion rate became higher as shown in Fig. 11(a). In solid-liquid flow as presented in Fig. 11(b), both mechanical impact and chemical reaction were involved in the erosion-corrosion process of the coating. Meanwhile, the chemical reaction had the greatest impact on the erosion-corrosion of Ni–P coating under the speed of 1 m/s, but the presence of mechanical impact could promote erosion-corrosion.32) Besides, as displayed in Fig. 11(c) (d), h-Ni–P coating was preferentially corroded at active sites such as grain boundary, the interaction between these active sites and Cl− were intensified with the increased of speed, the mechanical impact of particles also accelerated the corrosion process. Therefore, it had lower corrosion resistance.

Figure 12 showed the micro-morphology of Ni–P and h-Ni–P after 3 h immersion time in the solution at the speed of 1 m/s. It was observed in Fig. 12(a) that the corrosion pits were found in local areas of Ni–P coating and there were fewer products of corrosion observed in other areas, the reason was that the corrosion occurred preferentially at defects between the tissues of cellular in the liquid flow. However, there were more products of corrosion formed and the corrosion pits were not found on the surface of Ni–P coating in solid-liquid flow in Fig. 12(b). It was because that the main impacts on the surface of Ni–P were physical impact and chemical reaction after the SiO2 particles were added, and the uniform corrosion tend to be appeared. The constituent elements in the circle of Fig. 12(c) were mainly composed of O, Fe, Ni and P. The constituent elements in the circle of Fig. 12(b) and Fig. 12(d) were mainly composed of O, Fe, Ni, P and Si through EDS analysis, it indicated that the corrosion products were mainly oxides and the tiny SiO2 particles were adsorbed in local areas of Ni–P and h-Ni–P. In addition, as for h-Ni–P, a large number of sparse white particles appeared on the surface of h-Ni–P in liquid flow in Fig. 12(c). Whereas, the larger piece of flaky corrosion products were formed on the surface of h-Ni–P and the edge of the corrosion pit was not smooth due to the collision of particles in solid-liquid flow in Fig. 12(d). Moreover, it showed that the morphology of h-Ni–P possessed spherical characteristic, but the size of the spherical tissue was uneven from the SEM observation of h-Ni–P. The flaky corrosion products could be generated in the areas with large volume differences. The unique pits and cracks through physically colliding of h-Ni–P were formed due to the increased hardness. The results indicated that the corrosion of both coatings became more seriously in solid-liquid flow and the substrate was even influenced. The corrosion resistance of Ni–P was higher than that of h-Ni–P.

4. Conclusions
In this study, the erosion-corrosion behavior and mechanism of Ni–P coating (Ni–P) and Ni–P coating after heat treatment at 400°C (h-Ni–P) in the flow of liquid flow and solid-liquid flow were investigated.
-
(1)
The results of numerical simulation exhibited the coating had a high velocity and a small pressure at the edge when it was scoured in a straight pipe, which was instructive for studying the local corrosion behavior of the coating.
-
(2)
The thickness of the coating did not change significantly after heat treatment at 400°C, but the surface of h-Ni–P had been crystallized.
-
(3)
Electrochemical results showed that the icorr of Ni–P and h-Ni–P under different speed of flow could be in this order: 0.4 m/s < 0.8 m/s < 1 m/s. It indicated that the corrosion rates of Ni–P and h-Ni–P became larger as the solution speed became larger, and the corrosion rate of h-Ni–P was higher than that of Ni–P. The corrosion resistance of crystallized Ni–P coating was lower Ni–P coating.
-
(4)
A larger sheet of corrosion product was formed during the flow of solid-liquid flow, and the edge of the corrosion pit was not round enough. It also indicated that h-Ni–P was more susceptible to corrosion than Ni–P, which further verified the results of the electrochemical test.
Acknowledgement
This research was financially supported by National Natural Science Foundation (No. 51801167; No. 51774242), Project of Sichuan Department of Science and Technology (No. 2020YFSY0035), and Open fund (PLN201822) of State Key Laboratory of Oil and Gas Reservoir Geology and Exploitation (Southwest Petroleum University).
REFERENCES
- 1) Q.Y. Wang, Y.C. Xi, J. Xu, S. Liu, Y.H. Lin, Y.H. Zhao and S.L. Bai: J. Alloy. Compd. 729 (2017) 787–795.
- 2) A. Mukhopadhyay, T.K. Barman and P. Sahoo: Mater. Today 5 (2018) 3306–3315.
- 3) Y. Xue and Z.G. Wang: Surf. Technol. 46 (2017) 79–83.
- 4) Z. Rajabalizadeh and D. Seifzadeh: Appl. Surf. Sci. 422 (2017) 696–709.
- 5) K. Sanjib, K.D. Suman and S. Prasanta: Mater. Today 4 (2017) 379–387.
- 6) Y.R. Zhou, S. Zhang and L.L. Nie: T. Nonferr. Metal. Soc. 26 (2016) 2976–2987.
- 7) B. Ma and R. Wang: Metals 8 (2018) 328.
- 8) S.H. Mousavi Anijdana, M. Sabzib, M. Roghani Zadehb and M. Farzamc: Tribol. Int. 127 (2018) 108–121.
- 9) A. Toda, P. Chivavibul and M. Enoki: Mater. Trans. 54 (2013) 337–343.
- 10) Y.R. Zhou: T. Nonferr. Metal. Soc. 26 (2016) 2976–2987.
- 11) J. Hajdu and S. Zabrocky: Met. Finish. 98 (2000) 42–46.
- 12) J. Yuan: Thin Solid Films 632 (2017) 1–9.
- 13) A. Farzaneh, M. Ehteshamzadeh and A.J. Cobley: Surf. Eng. 34 (2018) 454–461.
- 14) Z.H. Xie and S. Shan: J. Mater. Sci. 53 (2018) 3744–3755.
- 15) P. Shoghi, D. Seifzadeh, M. Gholizadeh-Gheshlaghi and A. Habibi-Yangjeh: T. Nonferr. Metal. Soc. 28 (2018) 2478–2488.
- 16) B. Choi, W. Choi, K.Y. Rhee, S. Park and M. Seo: Compos., Part B 167 (2019) 676–682.
- 17) Z. Jiang, X.J. Xu, H. Cheng, Q.J. Liu, X. Zhang, K.X. Zhou and J. Huang: Mater. Res. Express 770 (2019) 48–57.
- 18) Y. Yang and Y.F. Cheng: Surf. Coat. Technol. 205 (2011) 3198–3204.
- 19) S.R. Allahkaram, S. Mamaghani and T. Rabizadeh: Int. J. Mod. Phys. Conf. Ser. 5 (2012) 825–832.
- 20) Y.R. Tang, Q.Y. Wang, R. Pei, Y.C. Xi, L.J. Dong, S.L. Bai and S.H. Wan: RSC Adv. 9 (2019) 34214–34226.
- 21) P. Li, Y. Zhao, B. Liu, G.X. Zeng, T. Zhang, D. Xu, H. Gu, T.Y. Gu and F.H. Wang: Eng. Fail. Anal. 80 (2017) 112–122.
- 22) J. Naderi and A.A.D. Sarhan: Measurement 139 (2019) 490–497.
- 23) C. Hsu, S. Chiu and Y. Shih: Mater. Trans. 45 (2004) 3201–3208.
- 24) J.Q. Gao and W.B. Hu: Electroplat. Pollut. Control. 22 (2002).
- 25) S.C. Chung, S.L. Sung, C.C. Hsien and H.C. Shih: J. Appl. Electrochem. 30 (2000) 607–615.
- 26) R.S. Raman, P.C. Banerjee, D.E. Lobo, H. Gullapalli, M. Sumandasa, A. Kumar and M. Majumder: Carbon. 50 (2012) 4040–4045.
- 27) W. Trabelsi, E. Triki, L. Dhouibi, M.G.S. Ferreira, M.L. Zheludkevich and M.F. Montemor: Surf. Coat. Technol. 200 (2006) 4240–4250.
- 28) Q.Y. Wang, Y.R. Tang, R. Pei, Y.C. Xi and S. Wan: Mater. & Corros. (2019) 1–9.
- 29) C.A.C. Souza, D.V. Ribeiro and C.S. Kiminami: J. Non-Cryst. Solids 442 (2016) 56–66.
- 30) Y.W. Song, D.Y. Shan and E.H. Han: Electrochim. Acta 53 (2007) 2009–2015.
- 31) R.Z. Zhu: Metal Corrosion Science, (Metallurgy Industry Press, Beijing China, 1993) pp. 122–131.
- 32) J.M. Perry, A. Neville, V.A. Wilson and T. Hodgkiessa: Surf. Coat. Technol. 137 (2001) 43–51.


