Abstract
To investigate the reason why low-carbon steels with carbon-clusters shows the maximum strength during low-temperature aging, interactions between an edge dislocation and carbon clusters are performed through molecular dynamics (MD) simulations. Carbon clusters are modeled based on atom probe tomography (APT) observations. To express a transition process of carbon configurations from solid solution state to carbon cluster state to precipitation state during aging process, we reduce a carbon presence area with a fixed number of carbon atoms, i.e., the carbon concentration can be continuously increased. The MD simulations can represent the age hardening/softening tendency observed in the experiment and the carbon cluster state shows the maximum strength where the dislocation passes through the carbon cluster not by the Orowan but by the cutting mechanism. The MD analysis found that partial clusters in the carbon cluster act as the main resistance to dislocation passage; the biased distribution of carbon atoms is also confirmed in the actual observed carbon clusters by APT. A new interaction mechanism between dislocation and carbon clusters is developed based on the phenomena in the MD simulations and the availability is discussed.
This Paper was Originally Published in Japanese in J. Japan Inst. Met. Mater. 84 (2020) 19–27. The title is partly corrected.
1. Introduction
Fe–0.045C (0.21 at%), after solution heat treatment, has been reported to exhibit peak aging when subjected to an isothermal aging treatment at 50°C for approximately 28 h.1) The hardnesses of the aged material are 140 Hv for the as-solution-treated material, 200 Hv for the specimen aged approximately 28 h, and 180 Hv for the specimen aged approximately 128 days. Observations by atom probe tomography (APT)2,3) have revealed that carbon atoms at peak aging exist as carbon clusters in the solid-solution state enriched at 1∼2 at% in the region approximately 10∼20 nm in diameter. Such observations have also revealed that the carbon clusters are distributed at intervals of approximately 20 nm in the two-dimensional view of APT data and at intervals of approximately 30 nm if a square lattice distribution is assumed using the number density and cluster diameter.1) Given the observations reported thus far,1,4–6) this steel material is understood to exhibit peak aging by transitioning from the homogenous solid-solution state of the solution-treated material to carbon clusters during aging; it subsequently exhibits age-softening by changing its morphology to ε-carbides, etc. However, why carbon clusters exhibit maximum hardness remains unclear.
Carbon clusters are highly concentrated solid-solution regions heterogeneously distributed in a material. This behavior of carbon clusters is one of the reasons why their strengthening mechanism cannot be explained based on the conventional solid-solution strengthening and precipitation strengthening mechanisms. Here we simplify the interaction between a carbon-cluster group and a dislocation. Some segments of the dislocation encounter strong resistance in the highly concentrated solid-solution region. The other segments will then move between the carbon clusters, i.e., in a region with a very low-carbon concentration, and will bow out between the carbon clusters depending on their resistance, which is expected to increase with increasing carbon concentration in the carbon cluster. However, as the distance between the carbon clusters increases, the length of the dislocation segment bowing out also increases; thus, a large driving force can be obtained with a small external force when the dislocations overcome the carbon clusters. It should be noted that, because the number of carbon atoms in the material is essentially unchanged during aging treatment, the concentration of carbon clusters, which closely related to the resistance to dislocation motion, and the bow-out distance between the carbon clusters are not independent. Hence, understanding the influence of carbon concentration on the resistance of carbon clusters and on the distance between carbon clusters is necessary to understand the strengthening mechanism of carbon clusters.
To investigate the relationship between the carbon concentration of carbon clusters and their resistance to dislocation motion, an atomic resolution to the phenomenon is needed. Atomic-scale computer simulations are one tool that can provide this resolution. First-principles calculations based on quantum mechanics provide quantitative information about the interactions between different elements; therefore, with recently advances in computational capabilities, the ability to directly compute the interaction between dislocation cores and solute atoms in iron is playing an important role in materials science.7–10) However, molecular dynamics (MD) calculations, which can accommodate large-scale atomic systems by simplifying the atomic interactions with approximate functions, can directly compute the interactions between dislocations and various obstacles (e.g., solid-solution atoms,11–13) precipitates,14–18) and grain boundaries19–23)), and track the atomic-level lattice defect dynamics that are difficult to observe experimentally. Because the interaction between carbon clusters and dislocations is an evolving phenomenon of lattice defects in heterogeneous systems, we propose that an MD calculation approach is effective to understand the strengthening mechanism of carbon clusters.
The purpose of this paper is to investigate the strengthening mechanism of carbon clusters through an MD simulation. For this purpose, we first model various carbon states of the homogeneous solid-solution state, the carbon-cluster state, and the precipitate state, which continuously transform during the aging process. We then investigate the interaction mechanism and the critical shear stresses for the dislocation to pass through each carbon state and propose a mechanism to express the interaction between carbon clusters and a dislocation. This paper is structured as follows. Section 2 describes the analysis model and conditions, especially the modeling of the transition to a solid solution, carbon clusters, and precipitation states. Section 3 describes the results of the simulation of the interaction between a dislocation and carbon clusters and their correspondence with experiments. Section 4 discusses the strengthening mechanism of carbon clusters, and Section 5 contains concluding remarks.
2. Analysis Model and Conditions
2.1 Modeling of a carbon cluster
The carbon clusters characterized by APT have a carbon concentration of 1∼2 at% and a diameter of approximately 10 nm, and the distance between the centers of the clusters is approximately 20∼30 nm.1) In the present paper, analysis models are constructed on the basis of actual APT measurements and the shape of the carbon cluster is assumed to be a sphere with diameter D. The carbon cluster is modeled by randomly arranging N carbon atoms at stable interstitial sites of the carbons in a spherical range of D diameters in α-Fe. The number N of carbon atoms is set to 630∼640, referring to the value (700) calculated from the measured carbon concentration of APT. Because APT observations can provide information about the spatial coordinates of carbon atoms, the spatial coordinates can be used for the carbon-cluster model; however, the detection rate of APT is approximately 0.38, which makes information about the spatial coordinates of all carbon atoms difficult to obtain. Therefore, in the present study, a random arrangement of carbon atoms is used.
By fixing the number of carbon atoms N that make up the carbon cluster and changing the diameter D, the carbon concentration of carbon clusters can be changed. In the present study, we construct six carbon-cluster models of D = 20, 15, 12.5, 10 (the observed diameter in APT), 7.5, and 5 nm. Figure 1 shows the carbon atomic arrangements and concentrations of representative carbon-cluster models. As shown in Fig. 1(b), the carbon concentration is 1.37 at% in the D = 10 nm model, which is consistent with the experimental range 1∼2 at%. We confirm that the carbon concentration decreases with increasing diameter D. Notably, in the present study, the density of the number of carbon clusters is fixed and the number of atoms constituting the carbon clusters is kept constant even though the number density of actual carbon assemblies decreases with aging time, indicating Ostwald ripening.1)

Here, we discuss the reproducibility of the carbon-cluster model used in the present paper by comparing the carbon concentration distributions of the two carbon clusters measured by APT and the carbon-cluster model produced by random arrangement. Figure 2 shows the distribution of carbon concentrations in each direction of the measured carbon clusters and the carbon-cluster model (Fig. 1(b)). The measurement region is 5 nm × 5 nm × 20 nm, including the center of the carbon cluster. The square and triangular plots are the results of carbon clusters measured by APT, and the round plots are the results of carbon-cluster models with randomly placed carbons. The shape of the two measured clusters is confirmed to be spherical, with a diameter of approximately 10 nm. In addition, the carbon concentration near the center of the carbon cluster is approximately 1.5 at% for both the measured cluster and the cluster model, confirming that the randomly arranged cluster model well reproduces the carbon concentration distribution. A short-range-ordered structure may exist in the actual carbon clusters; however, this issue has not yet been clarified. Therefore, we do not model the existence of short-range-ordered structures in carbon clusters in the present study.

Figure 3 shows a schematic of the analysis model used to investigate the interaction between dislocations and carbon clusters. The motion of a screw dislocation in a body-centered cubic lattice is important for understanding the mechanical properties of the material. However, the Peierls potential is very high because of the dislocation core structure; representing the dynamics of screw dislocations that reflect the thermal activation process on a time scale that MD simulations can handle is therefore difficult. Consequently, in the present study, we attempt to investigate the strengthening mechanism of carbon clusters by modeling the interaction between an edge dislocation and carbon clusters. Periodic boundary conditions are applied in all directions to remove the influence of the free surface. One edge dislocation dipole is introduced in the analysis model to satisfy the periodic boundary conditions. One carbon cluster is then introduced at the center of the dipole. The carbon cluster interacts with the left edge dislocation under an applied shear strain γzy. However, in this case, the right edge dislocation also moves in the −y direction and will interact with the carbon cluster. To avoid this scenario, a region with a high carbon concentration (13.3 at%) is introduced to prevent the interaction between the right dislocation and the carbon cluster.

The crystal orientations are $[\bar{1}11]$, $[1\bar{1}2]$, and [110] in the x, y, and z directions, respectively. Because the measured center-to-center distance of the carbon cluster by APT is 20∼30 nm, let the analytical model size Lx in the x direction be 20 nm, which enables allows us to represent the process of one edge dislocation overcoming a group of carbon clusters of diameter D aligned at intervals of 20 nm. When carbon clusters with D = 20 nm are arranged, the adjacent carbon clusters are in contact through the periodic boundary condition; hence, when the dislocation enters the carbon-cluster region, the situation is close to a solid-solution state. As D is reduced from this state, it becomes the measured carbon-cluster situation with D = 10 nm, and as it is further reduced toward D = 5 nm, the carbon concentration becomes very high, suggesting a situation similar to the interaction between precipitates and dislocations. That is, decreasing D to less than 20 nm simulates the process of the carbon concentrating keeping a 20 nm interval from the solid-solution state. It should be noted that, in the actual aging process, the spacing of the carbon regions changes with Ostwald ripening as the transition from solid solution to carbon clusters to precipitates occurs. The other dimensions of the analytical model, Ly and Lz, are 160 nm and 20 nm, respectively. The total number of atoms is approximately 5.5 million.
After the initial atomic configuration is determined, each shear stress component of the analysis model is relaxed via a stress control procedure at 1 K for 25 ps. Shear strain is then added to the relaxed analysis model at a rate of $\dot{\gamma }_{zy} = 5 \times 10^{7}$ 1/s at 1 K to simulate the interaction between one edge dislocation and carbon clusters.
The EAM potential of the Fe–C system by Hepburn et al.24) is adopted for the interatomic potential. The MD analysis is performed using the Large-scale Atomic/Molecular Massively Parallel Simulator25) for parallel calculations; analyses of atomic information are carried out using the visualization structure analysis tool OVITO.26)
3. Results
3.1 Critical shear stress to pass through carbon clusters
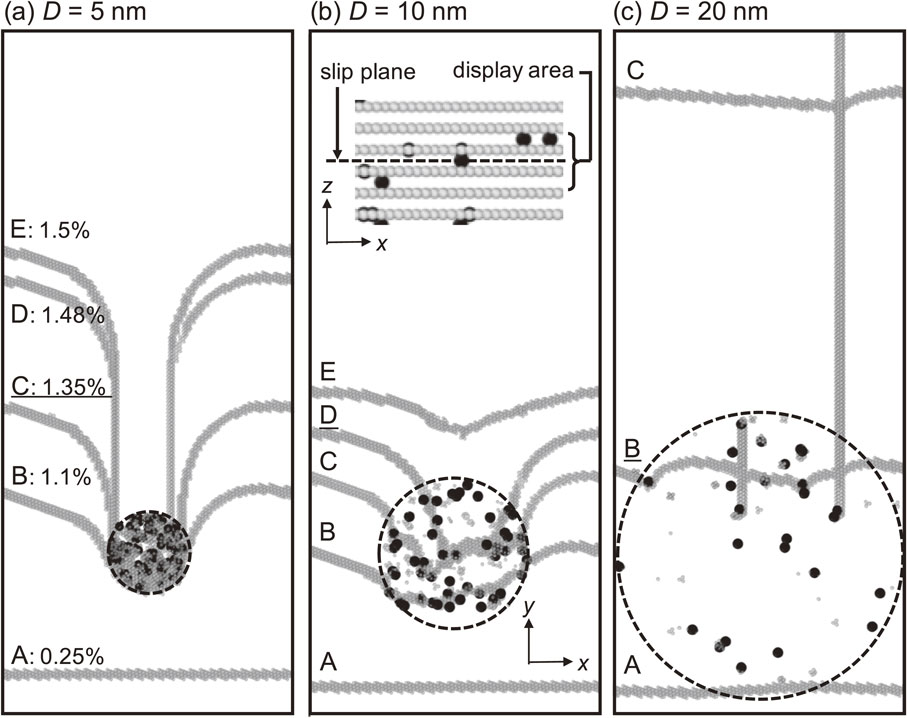
Figure 4 shows the stress–strain curves for each cluster diameter D as solid lines. The dotted line shows the slope of the stress–strain curve in the elastic range. Figure 5 shows the interaction between the dislocation and the carbon clusters of A to D points described in the stress–strain curves at D = 5, 10, and 20 nm. The light-colored atoms are iron atoms of the defect structure, and the black atoms are carbon atoms. The inner regions surrounded by dotted lines correspond to carbon clusters; the carbon atoms shown in the regions are only those that exist adjacent to the slip plane of the dislocation. The shear strains γzy for A, B, C, D, and E are 0.25, 1.1, 1.35, 1.48, and 1.5%, respectively. As shown in Fig. 4, the slope of the stress–strain curve decreases for all models when the shear stress τzy reaches approximately 100 MPa. This behavior is attributed to the plastic strain being obtained as the dislocation pairs introduced into the analytical model begin to move. After the dislocation passes through the A state and begins to interact with the carbon cluster, the slope of the stress–strain curve approaches the slope of the elastic region again in the model with small D and τzy increases while maintaining its slope. This behavior indicates that the motion of the dislocation is constrained by the carbon cluster in this interval. However, as D increases, the slope of the stress–strain curve alternates between small and large values (the large slope is the same as the elastic range); hence, the dislocation repeatedly progresses and stops during the interval. By comparing the states of B with different cluster diameters shown in Fig. 5, we confirmed that the dislocation is more advanced in the case of D = 20 nm than in the case of a small D.

Thereafter, the slope of the stress–strain curve decreases dramatically for all models because the dislocation is freed from the constraint from the carbon cluster and acquires a large plastic strain due to the motion of the dislocation. The shear stress τc required for the dislocation to pass through the carbon cluster is represented as circle plots in Fig. 4. As the size of the carbon cluster decreases from D = 20 nm to the measured D = 10 nm (i.e., as the carbon concentration increases), τc increases; then, as it decreases from D = 7.5 nm to D = 5 nm, τc decreases. Consequently, the carbon-cluster diameter that corresponds to the maximum strength measured by APT and the carbon-cluster diameter that corresponds to the maximum strength in the MD simulation show good agreement.
As mentioned in the Introduction, the hardness H due to isothermal aging in actual experiments is 140 Hv for the as-solution-treated material, 200 Hv for the material aged 28 h, and 180 Hv for the material aged approximately 128 days. We assume the solid-solution state for the as-solution-treated steel, the cluster state for the steel aged 28 h, and the precipitated state for the steel aged 128 days and correlate these states to those of D = 20 nm, 10 nm, and 5 nm in this analytical model, respectively. The ratios of τc/H obtained in the atomic simulations and those obtained experimentally are calculated to be 5.1, 4.8, and 4.8 MPa/Hv, showing a good correlation. Interestingly, we obtain a good correlation despite focusing on edge dislocations and fixing the distance between carbon clusters.
3.2 Mechanism of dislocation passing through carbon clusters
In the previous section, we confirmed that the maximum strength was observed for the measured carbon clusters (D = 10 nm). In this section, we investigate the mechanism of a dislocation passing through carbon clusters. Figure 5 shows the interaction between the dislocation and the carbon clusters; the underlined symbol states correspond to the critical state (τc). As shown in Fig. 5(b), (c), for D = 10 and 20 nm, the dislocations move in the carbon clusters. We therefore consider this mechanism of dislocation passing through carbon clusters to be the cutting mechanism. By contrast, as shown in Fig. 5(a), for D = 5 nm, the dislocations cannot penetrate into the carbon clusters because of the higher carbon concentration, indicating that the dislocation bows out greatly between the carbon clusters. The dislocation then continues to move beyond the critical state of C, and a linear screw dislocation dipole is formed in the direction parallel to the direction of the edge dislocation motion. If these screw dislocations are close to each other and annihilation occurs, an Orowan loop27) can be formed around the carbon cluster; however, no annihilation occurs in this analysis because of the very high Peierls potential of the screw dislocations. This trend has been confirmed in previous MD analyses.14) In the present study, we consider this mechanism of dislocation passing through carbon clusters leaving a screw dislocation dipole to be the Orowan mechanism. We also confirm that the mechanism of D = 7.5 nm is the Orowan mechanism. That is, the maximum strength is observed when the carbon-cluster diameter transitions from the Orowan mechanism to the cutting mechanism, and the mechanism of dislocation passing through the carbon clusters corresponding to the measured D = 10 nm is found to be the cutting mechanism.
To examine the cutting mechanism in greater detail, we show a snapshot of D = 10 nm at γzy = 1.35% in Fig. 6. This figure indicates that the dislocation is pinned to the circled group of carbon atoms. That is, the carbons in the carbon clusters form partial clusters, which can function as an obstacle to dislocations. As a result, in the interaction between a dislocation and carbon clusters, large dislocation bow out between carbon clusters and small dislocation bow out within carbon clusters coexist; we can therefore consider the mixing of the two different dislocation bow-out phenomena as a characteristic mechanism of a dislocation passing through the carbon clusters.
4. Discussion
4.1 Strengthening mechanism of carbon clusters
In Section 3, by simulating the interaction between dislocations and carbon clusters, we revealed that 1) the cutting mechanism transitions to the Orowan mechanism with decreasing carbon-cluster diameter, 2) the maximum strength due to the cutting mechanism in an actual measured carbon-cluster model (D = 10 nm), 3) the pinning of dislocations by partial clusters within the carbon cluster, and 4) two-scale dislocation bow-out phenomena between and within the carbon cluster. In this section, on the basis of the aforementioned findings, we attempt to model the strengthening mechanism of carbon clusters.
4.1.1 Three types of carbon-cluster strengthening mechanisms
To express the interaction between a dislocation and carbon clusters as simply as possible, we use the general dislocation–obstacle interaction model shown in Fig. 7(a). Let the resistance of the obstacle be Fc, the bow-out length be L, the Burgers vector be b, the line tension of the dislocation be T, and the angle at which the dislocation overcomes the obstacle be θc (0 ≤ θc ≤ π). Let the critical shear stress be τc, which can be obtained as follows:27)
| \begin{equation}
\tau_{\text{c}} = \frac{F_{\text{c}}}{bL} = \frac{2T\cos(\theta_{\text{c}}/2)}{bL}
\end{equation}
| (1) |
That is, if we determine the resistance force
Fc of the obstacle and the bow-out length
L, we obtain the critical shear stress τ
c.

Based on the results of the atomic simulations obtained in Section 3, we consider three strengthening mechanism models: the first is the Orowan mechanism observed when D is small, as shown in Fig. 7(b). In this case, the entire carbon cluster acts as an obstacle to the dislocation, and its resistance is greater than 2T. The second and third mechanisms are the cutting mechanisms confirmed in the region where D is large, as shown in Fig. 7(c), (d). The partial clusters within the carbon clusters function as obstacles, and two types of dislocation bow-out distances can be considered: between clusters (Fig. 7(c)) and between partial clusters within clusters (Fig. 7(d)). We represent these three strengthening mechanisms as a function of D and consider that the strengthening mechanism with the smallest τc among these mechanisms in each D is activated when the dislocation passes through the carbon clusters. Therefore, modeling these strengthening mechanisms requires a partial cluster classification of carbon clusters, a determination of the distance between partial clusters, and the resistance of partial clusters. We will discuss each of these items in the following subsections.
4.1.2 Partial cluster classification of carbon clusters
As shown in Fig. 6, the carbon atoms constituting the carbon cluster are enriched in the sub-regions, which indicate that they form partial clusters. Therefore, a carbon cluster is considered to be composed of multiple partial clusters and the carbon atoms constituting the carbon cluster are classified into partial clusters according to the following procedure. First, we focus on a carbon atom in a carbon cluster and register the neighboring carbon atoms within rc distance from the atom of focus. Next, for the registered carbon atoms, we search for and register their neighboring carbon atoms within rc in the same manner. We then run this process repeatedly until no more carbon atoms are located within rc in the vicinity of all the registered carbon atoms and finally group the registered carbon atoms into a single partial cluster.
Figure 8(a) is the result of classification of carbon clusters with D = 10 nm into partial clusters. Atoms of the same color belong to the same partial cluster, and the color represents the number of atoms Np that make up the partial cluster. In this paper, we set rc = 0.7 nm. Here, rc ≈ 2.5b; thus, the size of rc corresponds to the size of the dislocation core.27) The relationship between the diameter of the carbon cluster D and the number of carbon atoms Np is shown in Fig. 9(a). White circles denote Np for each partial cluster, and black circles are their average values. As D becomes smaller, in other words, as the carbon concentration increases, the maximum Np of the partial cluster becomes larger, and we can confirm that the average value of Np also increases. Np of a single partial cluster exceeds 500 for D = 7.5 nm, which means that the carbon cluster consists almost entirely of a single partial cluster. With reference to the information on Np and its average value obtained by the atomic model, the relationship between D and Np is expressed by Np = 6(10/D)5 + 1 and the relation is shown by solid lines in Fig. 9(a). We reproduce the tendency for Np to approach 1 asymptotically when D is larger than 20 nm and Np to become larger as D becomes smaller. Notice that the estimated Np is larger than the averaged Np obtained by the MD analysis. The reason for this is explained in Section 4.1.5.

As shown in Fig. 6, the dislocation bow out occurs between partial clusters when the dislocation enters carbon clusters. To evaluate the resistance of the partial clusters, we calculate the distance L between the partial clusters; L can be obtained as the average distance between partial clusters on the slip plane as $L = \sqrt{2\pi /3f} (d/2)$, where d is the diameter of the partial cluster and f is the volume fraction of the partial cluster in the carbon cluster. Diameter d can be calculated as $d = 0.247N_{\text{c}}^{1/3}$ by taking the carbon concentration of the partial cluster to be approximately 60 at%. At the carbon concentration assumed here, the average carbon interatomic distance is approximately 0.2 nm. After d is determined, we can find f geometrically. The obtained relationship between the partial cluster distance L and D is shown in Fig. 9(b). For reference, the distance between the carbon clusters is also shown. This relationship indicates that the distance between partial clusters takes a minimum value at D ≈ 10 nm and that the distance between partial clusters decreases with decreasing D until D ≈ 10 nm.
To examine the validity of the estimation, we measured the distances between partial clusters within the carbon cluster of the atomic model. In the partial clusters in the carbon cluster shown in Fig. 8(a), Fig. 8(b) shows only the partial clusters whose constituent carbon atoms are adjacent to the slip plane. The region adjacent to the slip plane is the same as the region shown in Fig. 5(b). Next, as shown in Fig. 8(c), in each partial cluster, the carbon atom most adjacent to other carbon atoms is the representative point of the partial cluster; Delaunay triangulation28) is then performed on the representative points. The average value of the length of each side of these triangle elements is set as the distance between the partial clusters. Figure 9(b) shows the distances between the partial clusters obtained by the atomic model with black circles. The geometrically obtained solid line and the atomic model results correspond well, confirming the validity of the partial cluster distances L and D constructed here.
4.1.4 Resistance of carbon clusters
Since we have thus far modeled the partial cluster classification within a carbon cluster and the distance between partial clusters, we here model the last remaining parameter: the resistance of partial clusters. That is, we construct a relationship between cos(θc/2), which represents the resistance of the partial cluster in eq. (1), and the number of carbon atoms Np constituting the partial cluster.
To obtain this relationship, we perform an interaction simulation of a single dislocation loop and eight partial clusters, as shown in Fig. 10. The dislocation loop with a diameter of 30 nm is introduced using the displacement field around the dislocation loop obtained from elastic theory.29) The partial cluster comprises Np carbon atoms randomly placed at the O-site so that the carbon concentration is approximately 55 at%. The center of each cluster is positioned on the slip plane of the dislocation loop. This carbon concentration is approximately the same as that obtained in Section 4.1.3. It should be noted, changing the size of the region of the partial cluster will also change Np. The analysis temperature is set at 1 K, the self-force of the dislocation loop is used to interact with the partial clusters, and the critical dislocation bow-out angle θc when passing through each partial cluster is measured. Between partial clusters 3 and 4, 7 and 8, the dislocation has a complete edge component; between partial clusters 1 and 2, 5 and 6, the dislocation has a complete screw component. However, because of the high Peierls potential of the screw dislocation, the dislocation may not be able to bow out between partial clusters 5 and 6 shown in Fig. 10. Therefore, we consider θc for partial clusters 3, 4, 7, and 8 in the present study.
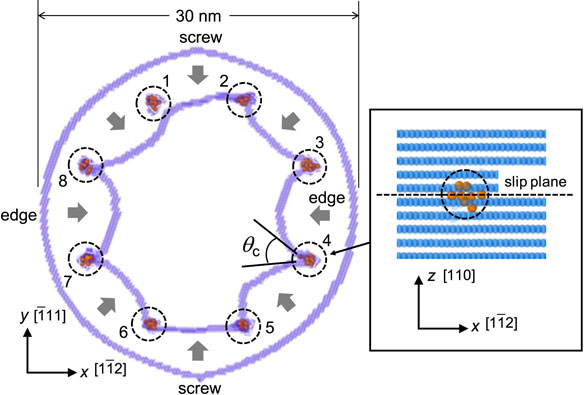
Figure 9(c) shows the relationship between cos(θc/2) and Np measured by atomic simulation with black circles. The resistance of the partial cluster increases with increasing Np, and the critical dislocation bow-out angle θc becomes 0 when Np is approximately 12. The fitting curve of the results is shown as the solid line. The obtained relational expression is cos(θc/2) = (Np/11)0.55, which confirms that the results of the atomic simulation are well reproduced.
4.1.5 Applicability of the strengthening mechanism
Based on the results of the previous sections, we can obtain the critical shear stresses of the three carbon cluster and dislocation strengthening mechanisms shown in Fig. 7. We here investigate whether these three types of strengthening mechanisms can reproduce the results obtained in atomic simulations. Figure 11 shows the relationship between the critical shear stress τc and the carbon-cluster diameter D. The black plots represent the critical shear stresses obtained by the atomic simulations shown in Fig. 4. The dashed line shows the Orowan mechanism (resistance: whole carbon cluster, distance between obstacles: between carbon clusters), the solid line shows cutting mechanism 1 (resistance: partial cluster, distance between obstacles: between carbon clusters), and the single dotted line shows cutting mechanism 2 (resistance: partial cluster, distance between obstacles: between partial clusters). As evident from the derivation process, cutting mechanism 2 is the same as the conventional solid-solution strengthening theory.27) The values required to determine the line tension T of the dislocation are α = 0.278, μ = 80 GPa, and b = 0.247 nm.

First, we focus on clusters with a small range of D that enables them to pass via the Orowan mechanism in the atomic simulation. The dashed line corresponding to the Orowan mechanism well reproduces the τc of D = 5 and 7 nm obtained by atomic simulations. Moreover, an additional calculation for a carbon cluster with smaller D (white circles) shows that the Orowan mechanism occurs and that τc well reproduces the theoretical value.
Next, we focus on a larger region of D = 20 nm. In this region, there is no distance between carbon clusters because the neighboring carbon clusters are adjacent to each other; in addition, the number of carbon atoms Np constituting the partial clusters is almost one. Thus, the clusters are in a solid-solution state. Therefore, cutting mechanism 2 represents solid-solution strengthening represented by the single dotted line. To confirm the validity of cutting mechanism 2, we performed additional calculations with D = 20 nm and with the carbon concentration lowered to 0.06 at%. Here, the number of carbon atoms constituting the carbon cluster is reduced, which precludes a comparison of the results with those obtained using models with a constant number of carbon atoms. Therefore, we estimate the carbon-cluster diameter D required to reduce the carbon concentration to 0.06 at% while keeping the number of carbon atoms constant, as in the other models. The obtained D is plotted in the white square in Fig. 11, demonstrating that carbon clusters with a thin carbon concentration can be well reproduced by cutting mechanism 2 and explained by the solid-solution strengthening mechanism.
Finally, we focus on regions D = 10, 12.5, and 15 nm. The τc obtained by atomic simulations in this region cannot be explained by the Orowan mechanism or the solid-solution strengthening mechanism. The best representation of this region is cutting mechanism 1 (solid line). That is, the partial clusters act as obstacles to dislocations and dislocation bow out occurs between the carbon clusters. In the present study, we reproduce the state of carbon clusters in the atomic model with a diameter of D = 10 nm by using information from APT analysis of the carbon cluster showing peak aging; hence, the strengthening mechanism of the carbon clusters that exhibited peak aging can be explained by the partial clusters caused by the deviation of the carbon atoms in the carbon clusters.
As mentioned in Section 4.1.1, the fitting result for Np and D shown in Fig. 9(a) is larger than the average of the results obtained in the atomic simulations. This curve fits the measured and predicted strength of the carbon clusters shown in Fig. 11, which means that the partial clusters actually responsible for the strength are partial clusters with Np greater than the average value of Np. In addition, another peak of strength that does not appear in the simulated values is observed between cutting mechanism 1 and cutting mechanism 2 shown in Fig. 11. This additional peak appears because the critical stress in cutting mechanism 1 diverges when the carbon-cluster diameter D approaches 20 nm because the distance of dislocation bow out approaches 0. In fact, because the partial clusters in the carbon cluster do not necessarily exist at the edge of the carbon-cluster region, the bow-out distance exhibits a finite length. Moreover, because the self-interaction30,31) (the bow-out stress of the dislocation decreases because of the elastic interaction between the dislocations facing each other during the dislocation bow out) occurs during the dislocation bow out, we speculated that we could reproduce the measured values more accurately if we took these factors into account in our modeling.
4.2 Partial clustering
In this study, atomic simulations of the interaction between carbon clusters and one dislocation are performed and partial clustering of carbon clusters is shown to act as strong obstacles to dislocation motion, which can explain the transition from age-hardening to age-softening observed in the experiment. Specifically, the heterogeneous distribution of carbon atoms in carbon clusters is important. In our analysis models, the carbon atoms are randomly arranged; the structural relaxation is then carried out for 25 ps relaxation calculations at 1 K. However, the diffusion of the carbon atoms is a difficult condition to occur practically; hence, the heterogeneity of the carbon atoms is due to the random initial arrangement. That is, the clustering of our analysis models has a strong stochastic aspect, with little contribution from physical driving forces.
To verify whether partial clustering occurs in the actual carbon clusters, we perform the partial cluster classification described in Section 4.1.2 on the carbon atomic data measured by APT and compare it with the results of the atomic simulation. The average number of carbon atoms constituting the partial cluster at each carbon concentration is shown in Fig. 12. The large black circles are the results of the atomic simulation, and the large white circles are the APT results. For reference, small black circles indicate Np of partial clusters, where carbon atoms have randomly been positioned in space to various carbon concentrations and have not performed any relaxation calculations. First, the results of the atomic simulations of the large black circles and the random arrangement of the small black circles show that Np increases with increasing carbon concentration. Therefore, the random arrangement of carbons is confirmed to cause a spatial deviation in the arrangement of carbon atoms, resulting in partial clustering. Next, we focus on the results of the two clusters characterized by APT (white circles). The analysis region of the clusters is a spherical region with a diameter of 5 nm, centered on the region of carbon enrichment. The Np of APT shows a trend similar to that of atomic simulations and random configurations; that is, if the detection rate of APT, which is 0.38, is considered to be constant in the analysis region, carbon atoms in the actual carbon cluster also deviated in space and partially clustered. Notably, the carbon atoms transition from a solid-solution state to a carbon cluster and then to a carbide with increasing aging time in the experiment; thus, a short-range-ordered structure is likely formed by direct interactions between carbon atoms or by indirect interactions through elastic fields. Although the mechanism of partial clustering in carbon clusters should be clarified with the aforementioned effects taken into account32) in the future, we can understand through the present analysis that the heterogeneous distribution of carbon atoms occurs in actual carbon clusters and that partial clustering is the dominant factor strongly influencing the strength of carbon clusters.

In the present study, we analyzed the interaction between an edge dislocation and carbon clusters and gained extensive knowledge about the strengthening mechanism of carbon clusters. Finally, the following items are to be considered for further consideration of the strengthening mechanism.
4.3.1 Mechanism of partial clustering
We found that partial clustering in carbon clusters is the dominant factor in the strengthening mechanism of carbon clusters by atomic simulations and confirmed the possibility that carbon clusters measured by APT are also partially clustered; however, the formation mechanism of partial clusters remains to be investigated in the future.
4.3.2 Mechanisms for the development of resistance in partial carbon clusters
Atomic simulations reveal that the resistance of partial clusters increases with an increase in the number of carbon atoms constituting the partial cluster; however, the origin of the mechanism needs to be investigated in detail.
4.3.3 Influence of high Peierls potential of screw dislocations
In the present work, the interaction between an edge dislocation and a carbon cluster was investigated; however, the motion of screw dislocations is considered to be closely related to strength in steel materials. Therefore, the interaction between the screw dislocations and the carbon clusters needs to be investigated.
4.3.4 Influence of finite temperatures
The interaction between edge dislocations and carbon clusters was modeled at the analysis temperature of 1 K; thus, the effect of finite temperature on the interaction was not taken into account. Therefore, studying the temperature dependence of the solid solution, carbon cluster, and precipitation states to understand the strength of steel materials under actual finite temperatures is important.
5. Conclusion
In this study, MD simulations of the interaction between a dislocation and carbon clusters were performed based on the information obtained by APT to investigate the mechanism of the peak strength of carbon clusters in steel materials during aging. To represent the transition process of the state of existence of carbon atoms with aging, we modeled the solid-solution state, carbon-cluster state, and precipitation state by changing the size of the region of existence with a constant number of carbons. The results are summarized as follows:
-
(1)
The age-hardening curve of the experiment can be reproduced by MD simulation, and the carbon clusters showed peak strength.
-
(2)
The deviation of the carbon atoms constituting the carbon clusters leads to the formation of partial clusters within the carbon clusters, and these partial clusters effectively resist dislocation motion.
-
(3)
The dislocation passes through carbon clusters that exhibit peak strength by cutting.
-
(4)
The reinforcement mechanism changes with the size of the region where carbon is present.
-
(5)
The carbon atoms are also deviated in the carbon clusters characterized by APT, indicating that the actual carbon clusters may be partially clustered.
REFERENCES
- 1) K. Ushioda, K. Takada, J. Takahashi, K. Kinoshita and H. Sawada: Mater. Trans. 61 (2020) 668–677.
- 2) M.K. Miller and R.G. Forbes: Mater. Charact. 60 (2009) 461–469.
- 3) J. Takahashi, K. Kawakami and Y. Kobayashi: Surf. Interface Anal. 51 (2019) 12–16.
- 4) R. Vyhnal and S. Radcliffe: Acta Metall. 20 (1972) 435–445.
- 5) M. Cohen and G.B. Olson: Metall. Trans. A 14 (1983) 1057–1065.
- 6) C. Zhu, A. Cerezo and G.D. Smith: Ultramicroscopy 109 (2009) 545–552.
- 7) M. Itakura, H. Kaburaki and M. Yamaguchi: Acta Mater. 60 (2012) 3698–3710.
- 8) T. Tsuru and D.C. Chrzan: Sci. Rep. 5 (2015) 8793.
- 9) L. Dezerald, D. Rodney, E. Clouet, L. Ventelon and F. Willaime: Nat. Commun. 7 (2016) 11695.
- 10) M. Wakeda, T. Tsuru, M. Kohyama, T. Ozaki, H. Sawada, M. Itakura and S. Ogata: Acta Mater. 131 (2017) 445–456.
- 11) E. Rodary, D. Rodney, L. Proville, Y. Bréchet and G. Martin: Phys. Rev. B 70 (2004) 054111.
- 12) D.L. Olmsted, L.G. Hector and W.A. Curtin: J. Mech. Phys. Solids 54 (2006) 1763–1788.
- 13) P. Yi, R.C. Cammarata and M.L. Falk: Acta Mater. 105 (2016) 378–389.
- 14) Y.N. Osetsky, D.J. Bacon and V. Mohles: Philos. Mag. 83 (2003) 3623–3641.
- 15) Y.N. Osetsky, D.J. Bacon, Z. Rong and B.N. Singh: Philos. Mag. Lett. 84 (2004) 745–754.
- 16) Y.N. Osetsky, Y. Matsukawa, R.E. Stoller and S.J. Zinkle: Philos. Mag. Lett. 86 (2006) 511–519.
- 17) T. Hatano: Phys. Rev. B 74 (2006) 020102.
- 18) D. Terentyev, G. Bonny, C. Domain and R.C. Pasianot: Phys. Rev. B 81 (2010) 214106.
- 19) M.D. Koning, R. Miller, V.V. Bulatov and F.F. Abraham: Philos. Mag. A 82 (2002) 2511–2527.
- 20) T. Shimokawa, T. Kinari and S. Shintaku: Phys. Rev. B 75 (2007) 144108.
- 21) T. Shimokawa and M. Tsuboi: Acta Mater. 87 (2015) 233–247.
- 22) T. Niiyama and T. Shimokawa: Phys. Rev. B 94 (2016) 140102(R).
- 23) T. Shimokawa, T. Niiyama, M. Okabe and J. Sawakoshi: Acta Mater. 164 (2019) 602–617.
- 24) D.J. Hepburn and G.J. Ackland: Phys. Rev. B 78 (2008) 165115.
- 25) S. Plimpton: J. Comput. Phys. 117 (1995) 1–19.
- 26) A. Stukowski: Modelling Simul. Mater. Sci. Eng. 18 (2010) 015012.
- 27) D. Hull and D.J. Bacon: Introduction to Dislocations, fourth ed., (Butterworth Heinemann, Oxford, 2001).
- 28) D.T. Lee and B.J. Schachter: Int. J. Comput. Inf. Sci. 9 (1980) 219–242.
- 29) T.A. Khraishi, J.P. Hirth, H.M. Zbib and M.A. Khaleel: Int. J. Eng. Sci. 38 (2000) 251–266.
- 30) A.J.E. Foreman: Philos. Mag. 15 (1967) 1011–1021.
- 31) T. Shimokawa and S. Kitada: Mater. Trans. 55 (2014) 58–63.
- 32) O. Waseda, J. Morthomas, F. Ribeiro, P. Chantrenne, C.W. Sinclair and M. Perez: Modelling Simul. Mater. Sci. Eng. 27 (2019) 015005.


