Abstract
A simulation system for the phase transformations and microstructure changes in welded area of steels was built with Materials Integration (MI) concepts. We aimed to build an simulation environment suitable not only for conducting research on microstructure developments and performing high-quality simulations but also for integrating practical and academic viewpoints and insights from materials science and engineering. In particular, the methods discussed in this article, such as the coordination of CCT diagrams and phase field (PF) simulations, and combination between PF methods and cellular automaton method, are typical examples of the MI concept. The detail of framework on the simulation system is explained, comprehensively.
This Paper was Originally Published in Japanese in Materia Japan 58 (2019) 494–497.
1. Introduction
This article discusses a simulation system for the phase transformations and microstructure changes in welded area in steels; the system was built as part of the Cross-ministerial Strategic Innovation Promotion Program (SIP) project on materials integration (MI).1) In particular, the simulation system developed in this study was designed based on the concept of MI. Because of space limitations, the reader is referred to the documents (simulation manual) and related papers (discussed afterwards) for details on the calculation system and underlying theory.
This system calculates the microstructure developments in the welded part of steels using a set of microstructure simulation methods based on the phase field (PF) approaches.2) As is well known, research on simulating and understanding the microscopic mechanism of the microstructure changes in steels is actively ongoing in many countries, and new insights are constantly being obtained.3) This is because the phase transformations and microstructure changes in the field of steel science and engineering are exceptionally complicated and diverse compared to those of other metallic materials. Therefore, the basic concept of the microstructure simulation system, constructed in SIP with the philosophy of MI, is not to consider the precise mechanism beyond what is necessary but instead to aim at designing a robust and concentrated system that can easily incorporate insights arising from future research advances. The guiding principles are elaborated as follows:
-
(I)
The system has a framework that can reflect recent insights from computational thermodynamics.4) The progress of the CALPHAD method5) and thermodynamic Gibbs energy databases is remarkable; coordination between these fields and the current system is indispensable. However, the simple coordination between PF simulations and the CALPHAD method suddenly consumes the amount of computational resources, thereby making calculation practically impossible. Although we had already found some ways to overcome this issue,6) the search for a better solution of this problem has been continued.
-
(II)
The PF method is used as the fundamental calculation method for the microstructure evolutions. However, this project does not limit itself to the PF method only, but also considers other microstructure simulation methods as necessary.
-
(III)
The objective of MI is to build an excellent integrated system, and not an excellent microstructure simulation system. Therefore, the system is designed so that the insights on all aspects of welding phenomena and their future growth can be integrated into a microstructure simulation system.
The remarkable characteristic of the project is principle (III). Many conventional projects often aim to improve the simulation system itself, and therefore, the system performance is evaluated by the precision for calculating real-world phenomena. This criterion is usually very hard to satisfy in microstructure simulation researches. Note that it is only recently the calculation of equilibrium phase diagrams become practical, after 50 years of global cooperation in performing experiments and collecting thermodynamic data. Therefore, a system that can ubiquitously and freely calculate microstructure formations can’t be built in a short period. Although the number of fields in materials science and engineering where the PF simulations are becoming possible is currently increasing one by one, the material, the phase transformation and the processing condition are often fixed and some assumptions are also imposed.7) From an engineering viewpoint, it might be better not to focus on the accuracy or sophistication of individual part of simulations, but to establish a versatile integrated system that incorporates whatever is usable, and the insufficient parts of the system are supplemented with insights obtained from the fundamental knowledge in materials science. On the other hand, solving inverse problems using machine learning8) has been becoming commonplace in the field of materials informatics in recent years. Therefore, the worth of an integrated system that includes uncertain material parameters and process conditions is being enhanced. This is because uncertain parameters and process conditions can be determined using the inverse problem approaches. The following sections give an outline how the microstructure simulations have been established under the MI philosophy.
2. Microstructures to Consider in the System
The following microstructures that appear during welding process of steels9–11) were targeted in this study: (1) dendrite microstructures formed during solidification; (2) austenite (γ-phase) polycrystalline microstructures; (3) ferrite (α-phase) precipitation microstructures (allotriomorph ferrite and ferrite side plate); and (4) “hard-phase microstructures”, which means the microstructures produced by pearlite or bainite transformation. The formation process of martensite was not considered in this system because the γ-phase that remained in the end was assumed to be transformed into martensite.
The calculation modules for above items (1) to (4) were developed as independent microstructure calculation models and designed to make independent calculations possible. Moreover, from (2) to (4), the system was designed to analyze the continuous sequence of microstructure changes in the same region under the same thermal history during welding. On the other hand, (1) is a module that directly applies the fundamental model of dendrite growth based on the conventional quantitative PF method.12) Since the computational methodology and analytical procedure of quantitative PF method have been already known,12) the following explanation places emphasis on (2) to (4) of the microstructure simulation system.
3. Coordination between Continuous Cooling Transformation (CCT) Diagram and Phase Field Microstructure Simulations
The most important feature in this calculation system is coordination between CCT diagram and phase field microstructure simulations. In general, the bottleneck of microstructure calculations in welding area of steels is setting the start of the transformations (its temperature, time and location). Estimating the start of the transformations from theory and simulation is difficult even with the most advanced methods currently available. On the other hand, an environment where CCT diagrams can be systematically obtained using machine learning technique was established in this SIP-MI project.13) Fortunately, large amount of CCT diagram data were accumulated by combining experimental data measured in the SIP-MI project, the CCT Diagram Database by the National Institute for Materials Science,14–16) and the CCT diagrams of structural steels for welding by the Iron and Steel Institute of Japan.17) A CCT diagram prediction module13) developed in SIP-MI project outputs the transformation-start curve of each phase or microstructure (as well as the volume fraction and hardness of each phase or microstructure after cooling) when the average composition of steel is provided as input data. It was built by machine learning of CCT diagrams, and the developed CCT diagram prediction module also outputs the yield point, tensile strength, and stress-strain curve at the same time. Therefore, this system adopted an approach where individual microstructure simulation modules are connected assuming that the CCT diagram is known in advance. In other words, the thermal history at each position in the welded part can be obtained from the welding conditions, and the starting points (temperature and time) of various transformations are determined by tracking the thermal history on the known CCT diagram. The sequence of microstructure evolutions can be systematically analyzed after applying the microstructure simulation modules from (2) to (4) according to the thermal history on CCT diagram. This system design resolves the problem of where to set the start and end of each transformation, which is quite difficult in conventional calculations. Coordination of CCT diagrams and machine learning, which enables us to develop CCT-diagram-based microstructure simulations, is expected to have a large impact on a wide variety of fields in materials science and engineering.
4. Phase Field Microstructure Simulations on Welding
The calculation sequence is explained below with examples. The temperature field is calculated in three dimensions (3D) while microstructure calculation is in 2D. (Note that a 3D calculation module for γ-phase polycrystalline microstructure formation is also available in the MI integrated system.) For detailed settings, the reader is referred to various documentations with respect to each module in the MI integrated system.
4.1 Simulation of γ-phase polycrystalline microstructure formation
Rosenthal’s equation9–11) is employed for calculating the 3D temperature field. The thermal history for each position in the entire welded part can be obtained after providing material constants and process conditions, which includes melting point, Ac3 temperature, thermal conductivity, thermal diffusivity, initial temperature, velocity of heat source movement, and amount of heat input. Figure 1 shows an example of a γ-phase polycrystalline microstructure calculated based on the provided thermal history.18) The top left corner is the point heat source location. The γ-phase has formed columnar shape in the region that was a melt pool. In the heat affected zone (HAZ) of the welded part, there is dependence on the local temperature field, and the γ-phase grain size is larger near the melt pool edge. After calculating this polycrystalline microstructure changes, users of this system choose the position where precipitation and transformation are to be calculated in the subsequent cooling process. (Because of the constraints of spatial resolution for representing the microstructure morphology and simulation time, one local region in the γ polycrystalline microstructure of Fig. 1 is cut out for ferrite precipitation, pearlite transformation, and bainite transformation). As an example, we focus on the square region marked X1 in Fig. 1. The top side of the Fig. 1 is the surface of the welded part; thus, this location is 2 mm from the surface. (This region will be indicated as the “cut-out region” henceforth). When the cut-out region is fixed, the temperature of this position can be obtained as a function of time using Rosenthal’s equation. Superimposing this information on a CCT diagram gives the temperature and time of the start and end of each precipitation and transformation. (Needless to say, the temperature of the cut-out region is known.) Figure 2 shows the thermal history (calculated from Rosenthal’s equation and shown as the solid curve in the figure) drawn on the experimentally determined CCT diagram of Fe–0.15C–1.5Mn steel. This figure provides information about the start and end times and temperatures of all precipitations and transformations.

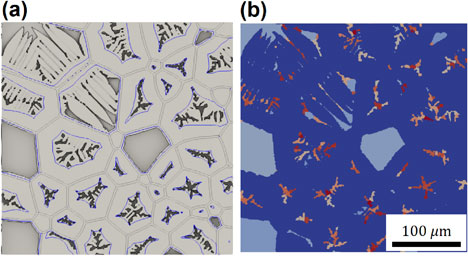
The γ-phase polycrystalline microstructure morphology in the cut-out region is directly used as the boundary conditions for calculating α-phase precipitation. The temperature change of the cut-out region is calculated from Rosenthal’s equation, and the start and end time and temperature of α-phase precipitation are obtained from the CCT diagram. Figure 3 shows an example where α-phase precipitation from a γ-phase polycrystalline microstructure was calculated. Figure 3(a) is an example of the initial microstructure cut out from Fig. 1, and Fig. 3(b) shows the calculated α-phase precipitation.19) In the initial stage, the temperature is high and the α-phase precipitates as a grain boundary allotriomorph (to the blue line in Fig. 3(b)). The allotriomorph α-phase transitions to a side plate morphology with the subsequent decrease in temperature. (A PF method was applied to calculate the allotriomorph, and a cellular automaton method was employed for side plate formation.20)) Note that the transition temperature and time, which the allotriomorph morphology changes to side plate, were also obtained from the CCT diagram in Fig. 2. There has been various models and assumptions proposed by many researchers for determining such a microstructure transition condition, which has been a large barrier in building a comprehensive calculation system. Understanding the mechanism of individual microstructure changes is undoubtedly a very important academic issue, but our approach of freely combining various insights such as CCT diagrams and simulation models, and integrating insights in the field of steels to figure out various phenomena from a systematic viewpoint, have a practical advantage in the development of complicated and diverse materials such as steels.

Figures 4 and 5 are examples of pearlite and bainite transformations, respectively. The initial microstructure in (a) is the α-phase precipitate microstructure discussed in section 4.2, and (b) is the pearlite or bainite transformation from the γ-phase that remained after α-phase precipitation. (The reddish color part corresponds to pearlite or bainite). Since Fig. 4 shows the case when the cooling rate is slow, the growth of the α-phase is significant, and pearlite transformation happens in the γ-phase where the carbon concentration is especially high (black regions in Fig. 4(a)). By contrast, the cooling rate is fast in Fig. 5, then the α-phase precipitation is finished in a short time, and all the remaining γ-phase region is transformed into bainite.


Pearlite and bainite microstructures consist of ferrite and cementite phases, however our calculations consider pearlite and bainite as a single phase (the multiphase field method2) was employed as the base method). Advanced new models for PF simulations targeting pearlite and bainite transformations are still being proposed.21,22) Therefore, we didn’t focus on the detailed calculation of pearlite and bainite microstructure, but the modeling was focused on the dynamics of the formation of pearlite colonies and single domains of bainite variants. Since the simulation of α-phase precipitation in Section 4.2 gives the solute concentration distribution in the microstructure, the subsequent pearlite and bainite transformations are modeled in such a way that the local chemical driving force induced from the solute concentration distribution can be considered. This simulation model may look like as a quite simple one, but information obtained from individual advanced microstructure simulation models21,22) can be easily implemented to this model by incorporating them in the driving force of phase transformations and the relaxation coefficients of domain boundary migration of the multi-phase field model. We emphasize that such specifications employed in this MI system allow continuous improvement of the model to future developments in the field.
5. Conclusions
The microstructure simulation system was built with MI concepts. We aimed to build an simulation environment suitable not only for conducting research on microstructure developments and performing high-quality simulations but also for integrating practical and academic viewpoints and insights from materials science and engineering. Moreover, the system can continue to grow while being able to accommodate further development. Methods discussed in this article, such as the coordination of CCT diagram and PF simulations, and combination between PF method and cellular automaton method, are typical examples of the integration concept. The output of the simulation is the morphological information of microstructure including the solute concentration field, crystal orientation field, and PF. Therefore, there is a big advantage that these field data can be obtained as image data, and directly provided to machine learning systems23) (called “Data-Driven System”) in this project, which integrates various image processing technologies.
Acknowledgments
This research was conducted by the Cabinet Office’s Strategic Innovation Promotion Program (SIP) “Structural Materials for Innovation” (managed by the Japan Science and Technology Agency (JST)) by the Council for Science, Technology and Innovation of the Cabinet Office. We would like to express our gratitude.
REFERENCES
- 1) SIP-MI project website. http://www.jst.go.jp/sip/k03/sm4i/project/project-d1.html, (accessed 2020-04-29).
- 2) T. Koyama and T. Takaki: Introduction to Phase Field Method, (Maruzen, Tokyo, 2013).
- 3) T. Koyama: Bull. Iron Steel Inst. Jpn. 19 (2014) 635–639.
- 4) T. Abe: Computational Materials Design - Computational Thermodynamics, (Uchida Roukakuho, Tokyo, 2011).
- 5) T. Abe: Calculation of Phase Diagrams Using Calphad Method, (Uchida Roukakuho, Tokyo, 2015).
- 6) S. Nomoto, H. Wakameda, M. Segawa, A. Yamanaka, T. Koyama and T. Takaki: The Proceedings of the 31st Computational Mechanics Conference, (The Japan Society of Mechanical Engineers, 2018) 066.
- 7) X. Dong, H. Xing, K. Weng and H. Zhao: J. Iron Steel Res. Int. 24 (2017) 865–878.
- 8) T. Koyama: Bull. Iron Steel Inst. Jpn. 23 (2018) 680–686.
- 9) F. Matsuda: Welding Metallurgy, (Nikkan Kogyo Shimbun, Ltd., Tokyo, 1972).
- 10) N. Yurioka and S. Okita: Welding of Steel Materials, (Sanpo Publications, Tokyo, 1999).
- 11) The Japan Welding Society, and the Japan Welding Engineering Society: Overview of Welding and Joining Technologies, (Sanpo Publications, Tokyo, 2015).
- 12) M. Ohno, T. Takaki and Y. Shibuta: Phys. Rev. E 96 (2017) 033311.
- 13) M. Watanabe, T. Kadohira, S. Minamoto, S. Tsukamoto, T. Kasuya, M. Okada and J. Inoue: “Prediction of Continuous Cooling Transformation Curves for Steels from Database”, 4th World Congress on Integrated Computational Materials Engineering, (2017).
- 14) CCT Diagram Database: Mat Navi (NIMS Materials Database website), https://mits.nims.go.jp/, (accessed 2020-04-29).
- 15) T. Kasugai and M. Fujita, (Eds.): Atlas of CCT Diagrams for Welding. (I), NRIM-special report, No. 99-02, (1999).
- 16) T. Ishikawa, N. Yurioka, M. Yamazaki and M. Fujita (Eds.): Atlas of CCT Diagrams for Welding. (II), NIMS-MITS-special report, (2008).
- 17) The Iron and Steel Institute of Japan: CCT Diagrams of Structural Steels for Welding, (Iron and Steel Institute of Japan, 1997).
- 18) M. Ohno, Y. Shibuta and T. Takaki: Mater. Trans. 60 (2019) 170–179.
- 19) T. Kohtake, A. Yamanaka and Y. Suwa: Metall. Mater. Trans. A 49 (2018) 5023–5034.
- 20) Y. Natsume: Tetsu-to-Hagané 103 (2017) 730–737.
- 21) M. Mouri, Y. Tsukada and T. Koyama: Tetsu-to-Hagané 105 (2019) 305–313.
- 22) M. Toloui and M. Militzer: Acta Mater. 144 (2018) 786–800.
- 23) Y. Adachi, Y. Matsushita, K.I. Kamimura and J. Inoue: Syst. Control Inf. 61 (2017) 188–193.