Abstract
In our recent projects the development of performance prediction system for welded structures was planned to contribute the research and development of materials, where forward calculation modules for prediction of macroscopic performances such as fatigue strength, creep strength, hydrogen embrittlement, brittle fracture and so on have been developed using theoretical considerations and empirical rules.
This Paper was Originally Published in Japanese in Materia Japan 58 (2019) 498–502.
1. Introduction
Structures frequently have long life-times and directly affect people’s security and safety. Therefore, much time and effort are spent in evaluating the properties and performance of materials and structures. For example, structural materials that are used for a long time under repetitive loads are carefully evaluated using a variety of testing methods. Fatigue properties are evaluated over a time period corresponding to the actual period of use, and assessments are conducted on a scale close to that of the actual structure. Such testing is necessary to ensure the reliability of the structure but is a factor that increases the time and cost of materials development. Fully utilizing computational methods to predict performance efficiently and accurately is important for continued competitiveness in structural materials development.
The Cross-ministerial Strategic Innovation Promotion Program (SIP) “Structural Materials for Innovation”, or Materials Integration (MI), by the Council for Science, Technology, and Innovation of the Cabinet Office aimed to develop a performance prediction system that would be useful in the actual development of structural materials.1) Modules were developed to calculate performance on, for example, fatigue strength, creep strength, hydrogen embrittlement, and brittle fracture through forward analysis using a comprehensive set of theoretical and empirical formulae, as well as database modules developed by analyzing vast quantities of data on performance. Another objective was to build an MI system that would allow prediction of textural and temporal changes in performance in structural materials for parts and structures manufactured from diverse raw materials and processes;2,3) this would be done by integrating theory, empirical rules, numerical modeling, databases, and data-driven prediction.4–6) Some of the work done to achieve these goals is introduced below.
2. Summary of the Performance Prediction System
The system that was developed can predict temporal changes in structural materials, for example in fatigue strength, creep strength, hydrogen embrittlement, and brittle fracture, using texture information obtained with a texture prediction system. The performance prediction system consists of calculation modules, which conduct forward analysis using theoretical physics models, and database modules, which use accumulated performance data. Verifications to evaluate the soundness of predicted performance were also conducted to confirm the validity of the performance prediction system. An additional module was developed that predicts temporal changes in performance under specific usage conditions from information on materials, welding conditions, and welding texture.
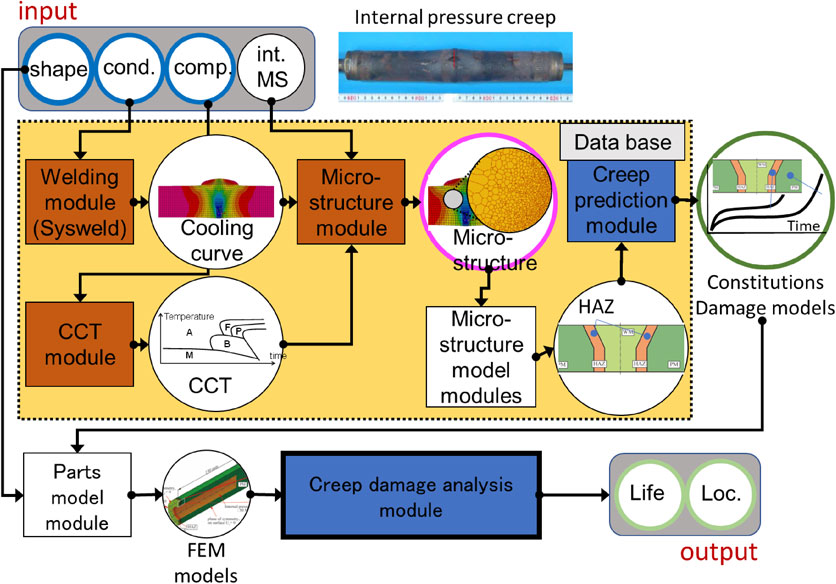
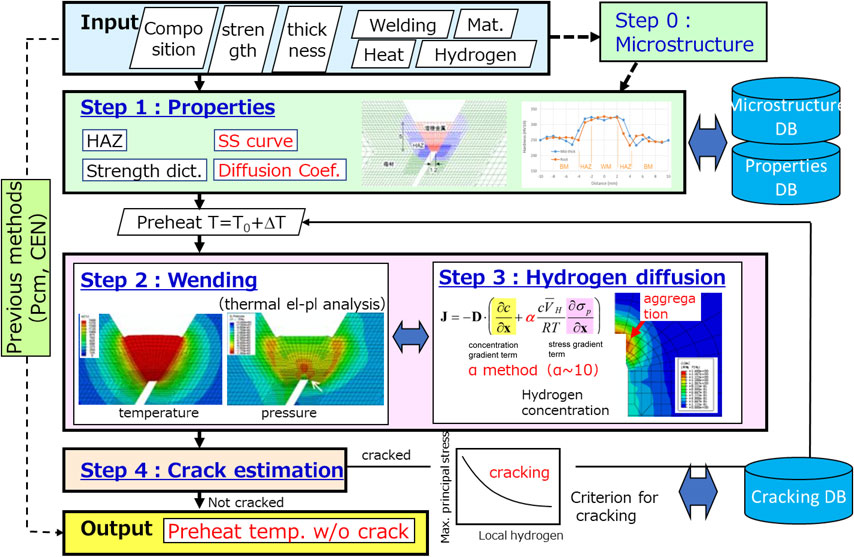
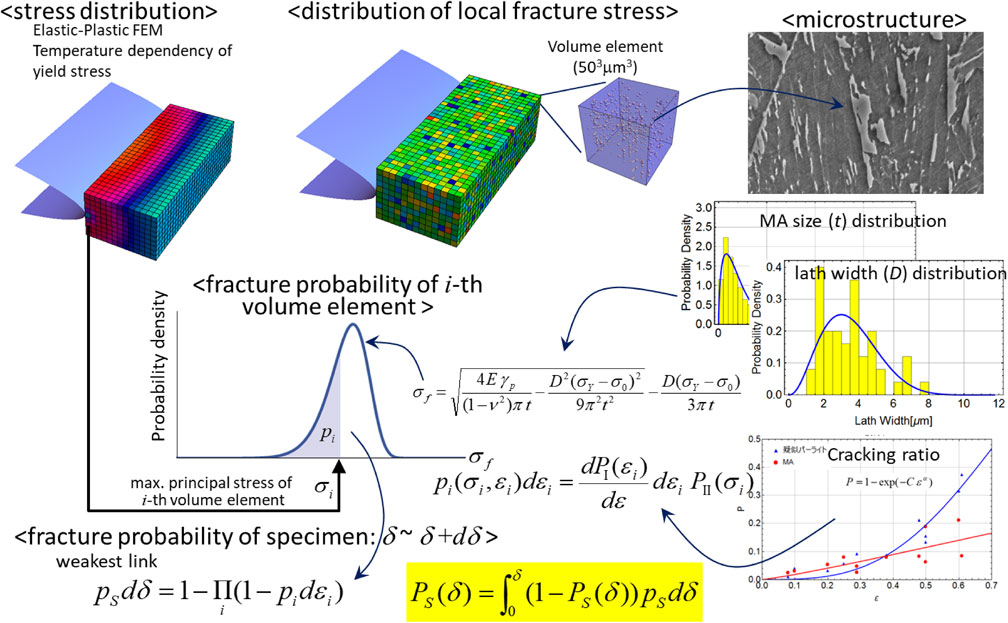
The fatigue performance prediction module allows prediction of the fatigue performance, including scattering, of weld zones in steel materials, by continuously conducting calculations as shown in Fig. 1.7) The fatigue performance prediction module consists of two submodules; one uses three-dimensional texture information as input to make high precision predictions using, for instance, fracture formation models, while the other makes predictions at high speed using a relatively simple structure model based on extracted texture parameters. Optimization of each module is attempted by comparing prediction results of the developed modules.8–10) The creep performance prediction module in Fig. 2 computationally analyzes creep damage and fracture using creep deformation analysis; it employs various creep constitutive equations, damage mechanics, fracture mechanics, and diffusion equations. As the effects of a multi-axial stress field are important in creep lifetime prediction of thick structural parts and welded joints, we are developing a calculation code that considers them.11,12) The hydrogen embrittlement prediction module illustrated in Fig. 3 analyzes the constitutive equations that govern stress-induced hydrogen diffusion to calculate hydrogen diffusion and transport in structures. The result is coupled with the three-dimensional stress field at the weld zone to predict cracking from hydrogen embrittlement. Diffusion phenomena depend on the texture because of differences in the hydrogen trapping effect in the non-uniform texture of the weld zone. This effect is considered by referring to information obtained from the texture prediction system.13) The embrittlement fracture prediction module in Fig. 4 aims to predict the toughness in the weld zone by estimating it from the microstructure, which differs with position in the melt pool or heat affected zone (HAZ) in the weld zone; in addition, the module can be used to predict toughness in the weld zone by organically combining experimentally obtained microstructural data with previously obtained data, such as Charpy impact test results.14)
3. Prediction of Fatigue Performance
3.1 Overview
Fracture performance prediction7) is discussed as an example below. Much time and cost is often necessary to evaluate performance when developing new materials and structures. A large number of fatigue tests must be conducted to verify the statistical behavior of fatigue fracture in welded structures. Therefore, reducing the time for evaluation of fatigue properties is very important. Conventional fatigue evaluation employs a design curve based on the S-N curve (i.e., the inverse power law relating the range of stress to the number of fractures). This approach mainly considers the shape of the junction, and effects of residual strain and microstructure are ignored in most cases. On the other hand, several new materials are developed with improved fatigue properties. For instance, low transformation-temperature welding materials reduce residual strain, while two-phase steel controls the microstructure to improve fatigue properties. Therefore, evaluation of effects from residual stress and the microstructure are becoming more and more important.
This background led us to propose of the use of numerical simulation technologies to study the fatigue of welded joints. The phase field model is a promising method for predicting complex microstructures, while crystal plasticity models that consider physical deformation mechanisms, such as crystal slip and twinning, have begun to attract attention.15) Prediction of the time until fatigue crack initiation based on microstructure and crystal plasticity is being actively pursued.16) The extended finite element method (X-FEM) is a powerful and widely used tool for predicting crack propagation, and further improvements are being made.
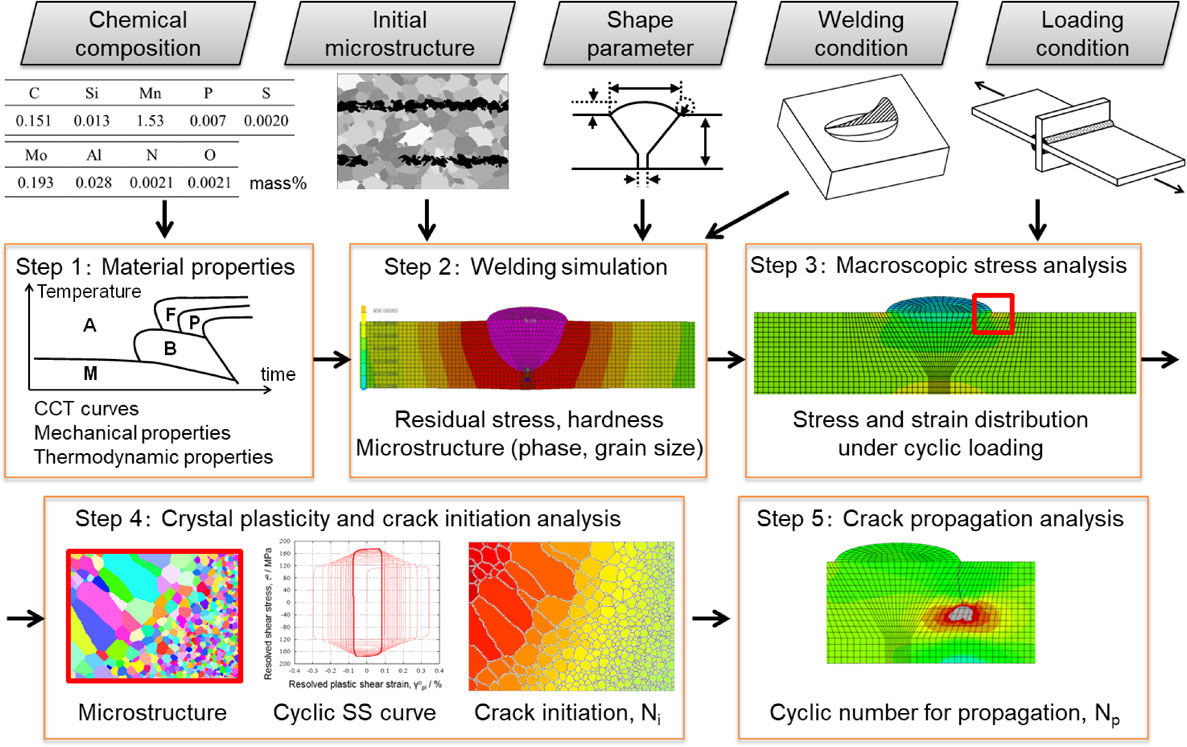
The objective of this study is to develop a comprehensive framework to predict the fatigue performance of welded joints by integrating the modern computational technologies discussed above. Figure 1 shows a summary of welding-joint fatigue lifetime prediction. This method uses commercial software and databases and consists of the following procedure: (1) estimation of materials properties, including the continuous cooling transformation (CCT) diagram, and mechanical and thermal properties of steels; (2) calculation of the temperature field and residual stress and strain during the welding process using a macroscopic model based on thermal stress FEM; (3) calculation of the macroscopic stress field under repeated strain using FEM based on a hardening constitutive model; (4) location of stress concentration zones in a macroscopic model, creation of a micro-polycrystalline structure model, and analysis of the fatigue crack initiation lifetime using the Tanaka-Mura model (Ni); and (5) analysis of the fatigue crack propagation lifetime (Np) from initial crack formation using X-FEM and estimation of the ultimate fracture lifetime by adding Ni and Np. A framework that automatically executes these steps was built. As an example, fatigue lifetimes of widely-used low-carbon steel (0.15% C) butt joints were evaluated using the proposed method.
3.2 Method of analysis
The first step in the proposed method calculated various materials’ properties from their chemical composition using the commercial software JMatPro v9.0. The CCT diagram, density, specific heat, thermal conductivity, Young’s modulus, Poisson’s ratio, thermal expansion, yield stress, and hardening gradient were obtained from the chemical composition. Calculations were conducted for a maximum heating temperature of 1350°C and a prior austenite grain size of 500 µm. The CALPHAD method (phase diagram calculations) and related empirical formulae were used in the calculations. The stress-strain curve was determined using mixture rules and the commercial FEM code SYSWELD. The yield stress was calculated as the average of the yield stresses of the individual phases.
The second step of the proposed method is a welding simulation that analyzes the residual stress and microstructure distribution. Two-dimensional finite element models were created based on shape parameters, such as plate thickness and weld toe radius, using Abaqus CAE. The geometrical shape was selected to correspond to the average of the measured toe radius and angle. Four-node plane strain elements (CPE4) with minimum size of 0.005 mm were used in the finite element model, and the materials properties calculation described in the previous section was applied. The initial texture of the matrix consisted of 75% ferrite and 25% pearlite. The materials properties of the weld zone were assumed for simplicity to be the same as those of the matrix.
Heat input distribution was assumed to be Goldak’s double-ellipsoidal heat source, represented by a three-dimensional double-ellipsoidal Gaussian heat-distribution function widely used in heat-transfer analysis of arc welding processes. The front ellipsoid length, rear ellipsoid length, heat source depth, and heat source width were set to 10, 20, 10, and 7.5 mm, respectively. The width and depth values were set such that all elements in the weld metal would melt. The heat source was moved at a speed of 1 mm/s along the center line of the plate, and the total heat input was 1.5 kJ/mm. The butt joint was cooled to room temperature after a single-run welding was conducted.
In general, heat transfer, phase transformation, and stress analyses are necessary to obtain the microstructure and stress-strain state in a welding process. This simulation used a strong coupling method to solve heat transfer and phase transformation problems. The heat transfer problem was solved using Fourier’s equation and taking into account latent heat. Diffusion and martensite phase transformations were predicted in phase transformation analysis. Vickers hardness (Vr) distribution was also derived from chemical composition measured at 700°C and cooling rate calculated using an empirical formula. The austenite granularity was also calculated using the increment equation proposed by Leblond et al. After analysis of phase transition-induced heat transfer, thermal elastoplasticity analysis was conducted. This was based on the temperature distribution and phase transfer history calculated by heat transfer analysis and was used to derive the residual stress. Elastic, plastic, thermal, and deformation strains were considered in the analysis. The SYSWELD code was used here.
The third step is macroscopic stress analysis. The input data in this step were the hardness distribution, the residual stress distribution from the previous step, and load conditions. The finite element model in the previous step was split into 10 regions based on the hardness distribution, and stress-strain curves were given to each region using the mixture rules. All components of the residual stress were introduced into the model before loading. The model was repeatedly loaded ten times with stress ratio R = −1 and one of seven different loading amplitudes (100, 150, 200, 300, 400, 500, and 600 MPa) was used. The position of the element with the largest maximum principal stress was recorded after macroscopic stress analysis, and was used in the next step.
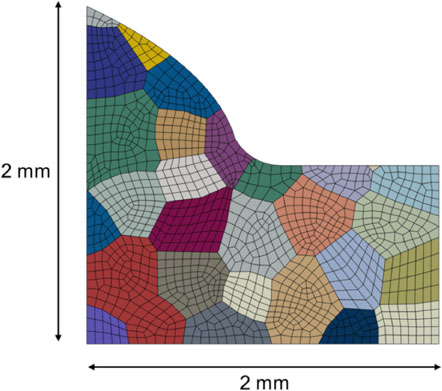
The fourth step is analysis of the mesoscopic stress using crystal plasticity (CP-) FEM and crack initiation. The results from the second and third steps were used as inputs in this step. The shape of the microstructure model and meshes are shown in Fig. 5. The shape of the model was cut out from the region near the highest stress location in the macroscopic model. The volume fraction of this region, having been predicted to be nearly 100% martensite in the second step, was presumed to be single-phase martensite. The average grain size of prior austenite was obtained using the granularity distribution calculated in the second step as a reference. The shape of the reconstructed grains was obtained using the tessellation method explained in our previous study.9) The microstructure model was chosen to contain approximately 40 grains. The model had a CPE4 mesh with average size 50 µm, and the crystal orientation was randomly assigned.
The advanced materials simulation kit (DAMASK)17) incorporating phenomenological constitutive laws proposed by Hutchinson et al. was used to calculate the elastic-plastic deformation behavior in the microscopic structure model. Nonlinear hardening was modeled by the Armstrong-Frederick hardening method. Some of the crystal plasticity parameters used in the simulation, such as plastic shear strain rate, resolved shear stress, critical resolved shear stress (CRSS), and the back stress of slip systems were obtained from the literature. Simulation boundary conditions were defined by the displacement field of the macroscopic model.
Crack initiation analysis was based on the Tanaka-Mura model,18) which emphasizes the irreversible energy accumulated in the slip band. The value of Ni was evaluated by averaging potential crack paths parallel to the slip line. Only the first crack was considered to save computation time. Seven different microstructure models were randomly generated using the same procedure and average grain size to evaluate the scattering in the crack initiation lifetime.
The final step is fatigue crack propagation analysis using X-FEM. This method expresses cracks using a jump function, and the finite element mesh does not have to follow crack paths. The position and length of the initial crack obtained in the previous step were introduced into the macroscopic model. The crack growth rate was calculated using the Paris law, and the stress intensity factor was calculated using the virtual crack closure technique in the Abaqus software. The constants used were consistent with those in the fatigue design guidelines for welded steel structures.19) A Python script was developed that automatically ran the sequence of calculations from the first to fifth steps.
3.3 Results
The thermal conductivity, yield stress, and CCT diagram were calculated using JMatPro. The thermal conductivity and yield stress were determined as a function of temperature in each phase. The CCT diagram qualitatively agreed with that obtained experimentally for the low carbon steel used in welding (0.1–0.2% C). The density, heat capacity, Young’s modulus, Poisson’s ratio, heat expansion coefficient, and hardening gradient were obtained from the chemical composition. Welding simulations were carried out using these properties. The volume fractions of ferrite, pearlite, and bainite were calculated. The matrix far from the heat source was the same as the initial microstructure (75% ferrite and 25% pearlite). The prior austenite grain size in the HAZ was estimated at about 1 mm. The Vickers hardness was distributed between 143 and 377. The materials properties assigned to the welding metal were the same as those of the matrix, so the distribution was continuous at the interface between the two. Lowering of hardness in the HAZ is often found in actual welding, but the simulated hardness monotonically decreased from the melt zone. To obtain an accurate residual stress and microstructure distribution, parameters and boundary conditions in the heat source model must be calibrated using experimental data. The automated calculation system built for this research is effective in performing such a calibration.
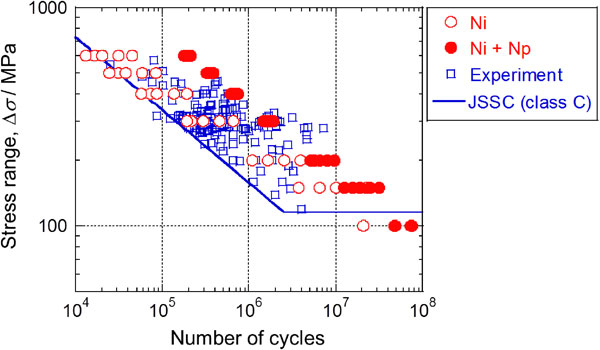
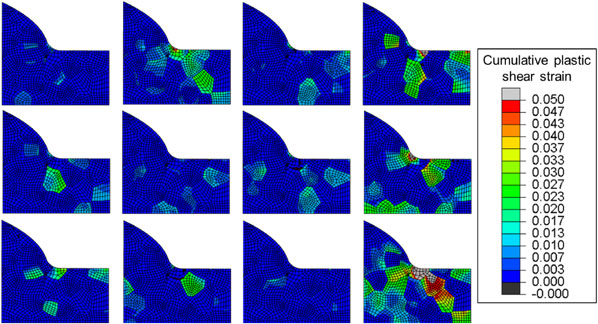
Figure 6 shows the cumulative plastic shear strain of a slip system, which showed a high value near the weld toe, but was very heterogeneous and depended on the crystal orientation. Some of the heterogeneous shear strain distributions in steel have been experimentally observed with digital image correlation (DIC). Ni was evaluated for all slip planes and slip directions from the von Mises stress distribution obtained from crystal plasticity analysis, assuming that cracks initiate in the slip plane with smallest Ni. In addition, the crack propagation path was calculated using X-FEM. Cracks propagated parallel to the initial crack and then grew almost perpendicular to the load direction. The number of crack propagations, Np, was defined when the crack length reached 1/3 of the plate thickness. The total number of cycles before fracture was defined as the sum of Ni and Np. This sequence of simulations was conducted 49 times, combining seven stress levels and seven different microstructure models. All the results are shown in Fig. 7. Empty circles indicate initiation of a crack and filled circles show the total repetitions until fracture. A butt joint is classified as class C if the geometrical shape is improved by grinding the weld toe or if nondestructive tests confirm that there are no critical defects in the weld zone. Empty squares represent experimental results obtained for class C according to recommendations of the Japanese Society of Steel Construction (JSSC).19) The calculated results matched well with trends in the experimental results.
4. Conclusions
We used physical models to introduce the role of performance prediction in the MI project. Although not discussed, analysis using Bayes’-theorem-based data-driven approaches effectively addressed nonlinearity in each link. By applying inverse problem analysis that combines texture analysis, crystal plasticity analysis, and fatigue test results to investigate the texture-property link, which is vital for performance prediction, will become important in the future. Building such an MI system is expected to shorten the development time for structural materials, reduce cost, optimize processing conditions for materials manufacturing and utilization, and improve optimization and reliability when choosing materials for structural design.
Acknowledgments
This research was conducted by Cross-ministerial Strategic Innovation Promotion Program (SIP) “Structural Materials for Innovation” (managed by the Japan Science and Technology Agency (JST)) by the Council for Science, Technology and Innovation of the Cabinet Office. We would like to express our gratitude here.
REFERENCES
- 1) M. Demura and T. Koseki: Materia Japan 58 (2019) 489–493.
- 2) M. Ohno, Y. Shibuta and T. Takaki: Mater. Trans. 60 (2019) 170–179.
- 3) Y. Shibuta: Mater. Trans. 60 (2019) 180–188.
- 4) T. Shiraiwa, Y. Miyazawa and M. Enoki: Mater. Trans. 60 (2019) 189–198.
- 5) F. Briffod, T. Shiraiwa and M. Enoki: Mater. Trans. 60 (2019) 199–206.
- 6) H. Nishikawa and Y. Furuya: Mater. Trans. 60 (2019) 207–212.
- 7) T. Shiraiwa, F. Briffod and M. Enoki: Eng. Fract. Mech. 198 (2018) 158–170.
- 8) F. Briffod, T. Shiraiwa and M. Enoki: Mater. Sci. Eng. A 695 (2017) 165–177.
- 9) F. Briffod, T. Shiraiwa and M. Enoki: Int. J. Fatigue 107 (2018) 72–82.
- 10) K. Shibanuma, K. Ueda, H. Ito, Y. Nemoto, M. Kinefuchi, K. Suzuki and M. Enoki: Mater. Des. 139 (2018) 269–282.
- 11) M. Tabuchi, H. Hongo and T. Matsunaga: Mater. High Temp. 34 (2017) 466–472.
- 12) K. Koiwa, M. Tabuchi, M. Demura, M. Yamazaki and M. Watanabe: Mater. Trans. 60 (2019) 213–221.
- 13) A.T. Yokobori, Jr., G. Ozeki, T. Ohmi, T. Kasuya, N. Ishikawa, S. Minamoto and M. Enoki: Mater. Trans. 60 (2019) 222–229.
- 14) M. Inomoto, Y. Okazaki, M. Kunikida, S. Aihara, T. Kawabata and T. Kasuya: CAMP-ISJ 177th Spring Meeting, 32, (2019) 353.
- 15) F. Roters, P. Eisenlohr, L. Hantcherli, D.D. Tjahjanto, T.R. Bieler and D. Raabe: Acta Mater. 58 (2010) 1152–1211.
- 16) D.L. McDowell and F.P.E. Dunne: Int. J. Fatigue 32 (2010) 1521–1542.
- 17) F. Roters, P. Eisenlohr, C. Kords, D.D. Tjahjanto, M. Diehl and D. Raabe: Procedia IUTAM 3 (2012) 3–10.
- 18) K. Tanaka and T. Mura: J. Appl. Mech. 48 (1981) 97–103.
- 19) JSSC: Fatigue Design Recommendations for Steel Structures, (Giho-do, Tokyo, Japan, 2010).