Abstract
Galvanic type atmospheric corrosion monitoring (ACM) sensors can distinguish wet and dry conditions of a surface by reporting spiked charge when there is an electrolyte film on the sensor. In this study, Fe–Ag type ACM sensor was exposed to monitor time of wetness (TOWACM) on carbon steel and weathering steel coupons at seven test stations in Thailand. Climate parameters were monitored by weather stations. Chloride and sulfur dioxide deposition rates were obtained by dry gauze and lead dioxide cylinder methods, respectively. The objective was to investigate the effects of TOWACM, climate, and aerosols on corrosion rate in Thailand tropical climate under high temperature, high relative humidity, and frequent monsoon-induced rainfalls. Multivariable linear regression model applied on the first-year corrosion rate yielded predictive equations for (1) inland areas-as a function of temperature (T) and relative humidity (RH) and (2) coastal areas-as a function of rainfall (RF) with TOWACM or chloride (Cl−) deposition rate. The first corrosion map of Thailand was proposed based on the predictive equations for corrosion rates of carbon steel and weathering steel.

1. Introduction
Atmospheric corrosion causes metal loss for steel structures during exposure to service environment due to electrochemical reactions under a thin electrolyte film formed by rain, dew, fog, or other forms of precipitates. The corrosivity of the environment can be evaluated from corrosion rate data according to ISO – 9223 standard.1) The maintenance cost of steel infrastructures, for example, can be significantly minimized if a proper material together with efficient corrosion protection are employed correctly based on corrosivity classification. The scenario of atmospheric corrosion studies in the 21st century will include newly derived dose-response function and prediction of atmospheric parameters in the future for materials selection and policy development, especially in the currently less developed countries.2)
Thailand is located in a tropical wet and dry climate zone for the upper half of the country and with the influence of tropical monsoon climate in the southern peninsula. The southwest (May–October) and northeast (November–January) monsoons bring about high total amount of rainfall (RF) in the southern region. The south wind (March–April) is a summer transition in the Gulf of Thailand region. High temperature (T) and high relative humidity (RH) in the tropical zone also contribute to the change in time of wetness (TOW). In addition, chloride (Cl−) from the sea aerosol and sulfur dioxide (SO2) from vehicle exhaust emission and industrial activities also play important roles in accelerating atmospheric corrosion reaction of steels exposed outdoor. These factors are different depending on geographic locations.
Tropical climates are found near the equator line within 25 north and south latitude. Tropical cities include, for example, southern Florida (United States), Cancun (Mexico), Rio de Janeiro (Brazil), Conakry (Guinea), Mumbai (India), Hainan (China), Jakarta (Indonesia), and Northern Territory (Australia). Atmospheric corrosion tests have been studied in tropical regions, for example, in Vietnam,3–5) Thailand,6) Mexico,7) Cuba,8,9) and Oman.10) Different multivariable linear regression models have been proposed in these studies to predict corrosion rates based on environmental factors. Vietnam’s prediction model for carbon steel is based on available parameters from the meteorological stations, such as T, RH, TOW calculated from T and RH, along with the most important factor, Cl−.4) Mexico’s prediction model for carbon steel is related to all environmental parameters: T, RH, TOW, RF, Cl−, and SO2.7) Cuba’s prediction model is emphasized on the effect of T, RH, TOW, Cl−, and SO2 along with the interaction terms.8,9,11) Oman’s regression model is focused on location and exposure time.10) A previous model for Thailand has been fitted to T, RH, and total time of rainfalls (Train), but has not included the effects of RF, TOW, Cl− and SO2.6) Recently, an integration report on regression models proposed by various studies worldwide has been published.12) The regression equations can be chosen according to the effect of Cl− deposition rate, which is significant when Cl− > 3 mg/m2/day (mmd) measured by wet candle method.12)
Atmospheric corrosion monitoring sensor, referred to as ACM sensor, is a galvanic type sensor that has been applied in atmospheric corrosion assessment.13) It has been employed in monitoring corrosion reactions in several applications besides atmospheric corrosion6,14) from pipeline15,16) to high-voltage power transmission tower.17) When the surface of the sensor is covered with thin electrolyte, galvanic current is generated and monitored. It is well known that MgCl2 is hydrated at relative humidity as low as 33%,18) which can be detected by ACM sensor. This marine salt hydration plays a major role in atmospheric corrosion near the coast.19,20) The output of ACM sensor varies with ion concentration under the electrolyte film.21) The charge produced by corrosion reaction can be correlated with the corrosion rate.6,14,22) Thus, ACM sensor is an effective tool for monitoring the deposited sea salt and time of wetness on steel surface in the corrosion study.16)
This research work reports on application of ACM sensor and its performance in predicting outdoor corrosion rates of carbon and weathering steels under various environments around Thailand and relates the results to environmental factors (T, RH, RF, TOW, Cl− and SO2). TOW data in this study are evaluated based on two approaches: ISO-92231) and ACM sensor.13) The corrosivity category and preliminary corrosion map of Thailand are estimated by multivariable linear regression models as a function of relevant parameters. The predicted corrosion rate methodology can be applied for outdoor applications in those countries with similar tropical climate characteristic as Thailand.
2. Experimental Procedure
2.1 Exposure test
Atmospheric exposure tests were conducted at 7 different test stations in Thailand. The detail and geographic illustration of each test station are listed in Fig. 1(a). These test stations are ranked from north to south in an order of decreasing distance from the sea. Chiang Rai (Station 1), in the northern part, is located farthest away from the sea and surrounded by mountains. The weather is wet and cool with minimal pollution. Khon Kaen (Station 2), in the northeastern part, is hot and dry. Pathum Thani (Station 3), in the central part, is surrounded by a few industrial parks. Bangkok (Station 4), Thailand capital city, has the highest pollutants from the heavy traffic. Rayong (Station 5), in the eastern part, has heavy industrial estates and is located close to the Gulf of Thailand. A photograph of Rayong test site is shown in Fig. 1(b). Chon Buri (Station 6), in the eastern part, is facing the Gulf of Thailand. Phangnga (Station 7), in the southern part, is facing the Andaman Sea.

Carbon steel (CS) and weathering steel (WS) plates were cut into rectangular coupons with a dimension of 150 mm × 70 mm × 3 mm and ground with 600 grit size SiC paper to remove blue scales. The chemical compositions of CS and WS are shown in Table 1. Prior to the exposure test, specimens were degreased with acetone and the initial weights were recorded. Then, specimens were electrically isolated and mounted on aluminum alloy test racks inclined at 45° angle from the ground facing the sea at marine test sites and the south at other test sites, in accordance with JIS Z 2381.23)

Table 1 Chemical compositions (mass%) of carbon steel and weathering steel.
Three sets of samples exposed during July 2013 to June 2014, June 2014 to May 2015, and December 2014 to November 2015 were collected and analyzed by weight loss method. After the exposure test, corrosion products were removed following the procedures of ASTM G 01.24) Two replicates of each grade were analyzed. The average weight loss per unit area was determined. Predictive equation as a function of environmental factors were performed based on multivariable linear regression.
2.2 Environmental factors analysis
During the exposure test, relevant environmental factors were monitored and recorded. A weather station was installed at each test site to record temperature, relative humidity, rainfall, wind speed, and wind direction every 10 minutes. In case of unexpected sensor failure, the weather data were obtained from the nearby Meteorological Department data. Chloride (Cl−) deposition was collected by dry gauze method according to JIS Z 2382.25) Sulfur dioxide (SO2) deposition was collected by PbO2 cylinder method following JIS Z 2382.25) TOW can be estimated from the total time when RH > 80% at T > 0°C according to ISO-9223, from here on referred to as TOWISO.1)
2.3 ACM data assessment
Atmospheric corrosion monitoring (ACM) sensor was used to estimate the time of rainfall, dryness, and dew period, following the conventional criteria for rain-dew-dry period proposed by Motoda et al.22) Galvanic-type ACM sensor is made of carbon steel substrate coupled with silver paste (Fe–Ag type sensor). As water film is formed by rain drops or condensation, galvanic reaction occurs and the current is recorded by a data logger connected to the sensor. Rainfall time is defined as when the output current is greater than 1 µA. During dry time, current is below 0.01 µA. Current value between 0.01 µA and 1 µA is defined as dew time.22) Therefore, by using ACM sensor, TOWACM can be calculated from the summation of rain and dew time, which contributes to corrosion reaction.
3. Results and Discussions
3.1 Environmental factors
Average value of temperature, relative humidity, total rainfall, TOW, Cl− deposition rate, and SO2 deposition rate from 2013 to 2015 are plotted in Fig. 2. In terms of average temperature (Fig. 2(a)), Chiang Rai was the coolest (25°C) test site and Bangkok was the hottest (30°C) one. Regarding to the average relative humidity on the secondary y-axis of Fig. 2(a), the RH value was the lowest (68%) at Bangkok and the highest (81%) at Phangnga.

The total rainfall was minimum at Chon Buri (600–800 mm/y) and maximum at Phangnga (2,500–3,000 mm/y) as shown in Fig. 2(b). TOW data in this study were evaluated based on two approaches: ISO-92231) and ACM sensor. However, the raw data were missing at some test sites (Khon Kaen and Pathum Thani) due to technical error of the RH and ACM sensors. The national meteorological data were recorded every three hours, which was not reliable for TOW calculation. From the results of TOW by ISO definition (TOWISO), Bangkok exhibited the shortest TOWISO (<2,500 h/y), whereas Chiang Rai and Phangnga exhibited the longest TOWISO (>4,000 h/y). From the results of TOWACM, TOWACM at Chiang Rai was the shortest (4,600 h/y) and TOWACM at Phangnga was the longest (7,500 h/y).
In Fig. 2(c), average Cl− deposition rates are plotted as a function of distance from the sea. Cl− deposition rate increased with decreasing distance from the sea. It was the lowest in Chiang Rai (1 mmd) and the highest in Phangnga (82 mmd). Figure 2(d) shows the average SO2 deposition rate at each test site. The lowest SO2 deposition rate was observed in Chiang Rai (<0.5 mmd), whereas the highest SO2 deposition rate was detected in Bangkok (22.8 mmd).
At low Cl− and SO2 deposition rate area such as Chiang Rai, TOWISO was equivalent to TOWACM because condensation only occurs at RH > 80%. At the test site with high Cl, TOWACM was almost doubled that of TOWISO standard because it considered the low relative humidity range. TOWACM includes the total time that the water film is formed on the sensor even when the relative humidity is below 80% due to sea salt moisture absorption (i.e., CaCl2 and MgCl2).18,26) From the published data, the constituents of wet deposition in Thailand are consisted of both Ca2+ and Mg2+.27) From dry gauze sample, the amount of Ca2+ and Mg2+ from sea salt can be determined by comparing their fraction with Na+ which is known to be primarily from marine source. Cation analysis from dry gauze of Chon Buri test site revealed that Ca2+ and Mg2+ ions were 32% and 98% from sea salt, respectively. Moreover, the drying process of electrolyte on metal surface is considered aggressive and may occur at RH < 80% as shown in controlled laboratory studies.28,29) The TOWACM value can better represent the actual time of wetness for seashore area.
To obtain TOWACM parameter for corrosion rate prediction, a linear regression was applied to estimate TOWACM from meteorological data. It is revealed that TOWACM can be expressed as:
| \begin{equation}
\mathrm{TOW}_{\text{ACM}} = -19{,}921.50 + 242.17^{*}\text{T} + 252.34^{*}\mathrm{RH}
\end{equation}
| (1) |
with P-value < 0.05 for both variables and R
2 = 0.81.
Figure 3 shows the comparison between calculated and measured values.

In comparison among those marine environments, it is noticed that Cl− deposition rate in Phangnga was much higher than that in Chon Buri. The upper Gulf of Thailand receives river water from three rivers causing the salinity to be from 31.4 to 32.7%, which is lower than the salinity of the Andaman Sea (32.9–33.4%).30) The shallow depth of the Gulf of Thailand is also responsible for low exchange rate of seawater. Referring to holistic study of marine salt production at the shore, marine aerosol comes from two main sources: (1) surf and (2) ocean.31) In that study, it is stated that both wide and narrow bays with deep or shallow features have substantial reduction in ocean produced salt.31) Chon Buri coastal line has combinations of bay geography that causes limited aerosol production.31) While the coast at Phangnga test station is straight without particular bay feature; thus, aerosol sea salt is caused by both surf and ocean waves. Another contributing factor related to surf produced aerosol is the wave height.31) The satellite data showed that average wave height in the Andaman Sea was 3.7 times higher than that in the Gulf of Thailand,32) increasing surf aerosol at Phangnga test site.
Total amount of annual rainfall may also attribute to different Cl− deposition rates. The annual rainfall in Phangnga was around 3,000 mm/y, whereas that in Chon Buri was less than 1,000 mm/y. Aerosol sea salt can be dissolved in rainwater.33) Therefore, higher amount of wet deposition brings more sea salt near the shore causing higher Cl− deposition rate. Finally, sea salt deposition rate can be influenced by the distance that coastal wind travels per day or Run of Wind parameter (ROW) and wind force energy (αD,C).34) ROW and αD,C at Chon Buri were 34 km/day and 316 km2/h/day, respectively. While at Phangnga, ROW and αD,C were 47 km/day and 501 km2/h/day.
Thus, ocean salinity, open ocean bay landscape, wave height, amount of rainfall, ROW, and αD,C enhanced salt deposition rate at Phangnga. Further investigations will be necessary to completely understand the difference between these coastlines.
3.2 Environmental and corrosion classifications
According to ISO 9223,1) corrosivity category (C1–C5), Cl− level (S0–S3), SO2 level (P0–P3), and TOWISO (τ1–τ5) for seven test sites in Thailand were determined from the one – year corrosion rate and the relevant environmental data, as summarized in Table 2. The corrosion rates at all test sites were classified as low corrosivity: C2, except Phangnga test site on the west coast which was classified as high corrosivity: C4. At Chiang Rai and Khon Kaen, low pollutants (S0 and P0) were detected, but the TOWISO were relatively high: τ4. At Pathum Thani and Bangkok, the concentration of Cl− and SO2 were classified as S1 and P1, with TOWISO equivalent to τ4 and τ3, respectively. Pathum Thani test site is located approximately 4 km away from Navanakorn industrial zone, which contributes to the same SO2 classification as Bangkok. At Rayong test site, the concentration of Cl− and SO2 were classified as S1 and P1, with TOWISO equivalent to τ4. Even though Rayong is situated in Maptaput industrial zone, the SO2 classification is equivalent to urban atmosphere. Moreover, the Cl− deposition rate at Rayong was double compared to those at Pathum Thani and Bangkok, but still classified as S1. At Chon Buri, the deposition rate of Cl− and TOWISO were similar to Rayong with lower deposition rate of SO2. However, these differences in atmospheric parameters at Stations 1 to 6 had minimal effect on corrosivity category as they are classified equivalently to C2. Phangnga test site with S2, P0, and τ4 led to extensively higher corrosivity level of C4. The geography of southern Thailand features a narrow peninsula, separating the Andaman Sea and the Gulf of Thailand. This area is situated in tropical monsoon climate with high amount of rain and thunderstorms. Higher Cl− deposition rate in combination with long time of wetness makes the atmosphere in Phangnga and the southern region of Thailand more corrosive. Corrosion products formed on carbon and weathering steels exposed in Thailand also reflect different characteristics and kinetics, which have been reported elsewhere.35,36)

The average corrosion rates of one-year exposed specimens are also reported in Table 2. Corrosion rates of carbon and weathering steels tended to increase with decreasing distance from the sea. A conventional method to predict the corrosion rate is by finding an empirical relationship with the significant environmental parameters. The simplest model is a multivariable linear regression of corrosion rate as a function of T, RH, TOWACM, RF, Cl− deposition rate, and SO2 deposition rate:
| \begin{align}
\text{CR (g/m$^{2}$/y)} & = \text{a} + \text{b$_{1}$ T (${}^{\circ}\text{C}$)} + \text{b$_{2}$ RH (%)} \\
&\quad+ \text{b$_{3}$ TOW$_{\text{ACM}}$ (h/y)}\\
&\quad+ \text{b$_{4}$ RF (mm/y)} + \text{b$_{5}$Cl$^{-}$ (mg/m$^{2}$/d)}\\
&\quad+ \text{b$_{6}$ SO$_{2}$ (mg/m$^{2}$/d)}
\end{align}
| (2) |
where a, b
1, b
2, b
3, … are correlation coefficient. Generally, one-year exposure tests are conducted and repeated to obtain reliable sampling data. In this study, three sets of one-year exposure tests were carried out at each test station. All possible variable combinations were considered in the regression model based on full factorial algorithm. From sampling data, Chiang Rai exhibited the lowest temperature and Phangnga exhibited the highest Cl
− deposition rate. These two stations are separated into two sampling groups. The best fit was determined by P-value < 0.05.
For carbon steel, multivariable linear regression yielded the expressions shown in Table 3. Equation (3) was obtained by fitting the data of Stations 1 to 6. Equations (4) and (5) were obtained by fitting the data of Stations 2 to 7. Generally, increasing temperature is likely to accelerate corrosion by increasing the rate of electrochemical reaction in diffusion processes or by causing temperature lag on the metal surface which acts as a condenser.37) If the coefficient for parameter T is negative, evaporation of electrolyte on the steel surface leads to a decrease in relative humidity and the time of wetness, which decelerates the corrosion rate.38) The influence of relative humidity on atmospheric corrosion contributes to the formation of the thin electrolyte film, which increases corrosion rate. Rainfall normally has two competing effects on atmospheric corrosion: increasing corrosive media contact on the metal surface due to acid rain as well as thunderstorm and washing away contaminants from the metal surface.37) TOWACM indicates the time that corrosion may occur under the electrolyte film and increases the corrosion rate. The corrosion rate also increases with increasing Cl− and SO2 deposition rate. The best fitting is obtained as summarized by eqs. (3) to (5). In this case, all parameters accelerate the corrosion rate as indicated by positive signs of the correlation coefficients. However, the data for Cl− deposition rate are not readily available in Thailand. Equations (3) and (5) are simplified prediction equations for corrosion mapping. SO2 deposition rate data is not widely available. There is an evidence in the study by Cole et al.39) that SO2 is not a significant factor for steel corrosion in the tropical region due to the neutralizing effect with the NH3 adsorption. An indicator of such neutralizing effect is that the ratio of SO42−:NH4+ would be about 1.0.39) Reported values of SO42−:NH4+ in rainwater at Bangkok were 1.45 in 199839) and 0.85 in 2014.27) Pathum Thani had SO42−:NH4+ ratio of 1.23 in 2014.27) Rayong had SO42−:NH4+ ratio of 1.0 in 1998.39) Therefore, SO2 parameter is not considered in this model.

Table 3 Multivariable linear regression functions for carbon steel.
For weathering steel, multivariable linear regression yielded the expressions listed in Table 4. Predictive equations were derived in a similar manner as those of carbon steel. Other studies have shown that SO2 is a major factor in accelerating atmospheric corrosion rate.40–42) Knotková et al.42) reported that the corrosion rate of weathering steel was less than 46.2 g/m2/y (6 µm/y) when SO2 deposition rate was below 20 mmd. SO2 deposition rate in this study were below 20 mmd; however, only Chiang Rai exhibited weathering steel corrosion rate below 46.2 g/m2/y criterion. For other test sites, the corrosion rates of weathering steel were above 46.2 g/m2/y. Therefore, additional factors such as high temperature, high relative humidity, rainfall, TOW, and Cl− deposition rate are assumed to be dominant. The best fitting was obtained as shown in eqs. (6) to (8), which were similar to carbon steel equations with all positive coefficients. It is noticed that the effect of Cl− deposition rate on weathering steel was considerably lower than that on carbon steel, which also agreed with the weight loss result. Equation (6) is applied in the case that Cl− deposition rate is negligible. Equations (7) and (8) can be applied in the area where Cl− deposition rate is significant. Generally, weathering steel requires wet-dry cyclic pattern and exposure duration of 3 to 5 years to form protective patina.43) This one-year result cannot determine the usable zone for weathering steel. Long-term results are required in order to see the effect of alloying elements in weathering steel on corrosion protection.36)

Table 4 Multivariable linear regression function for weathering steel.
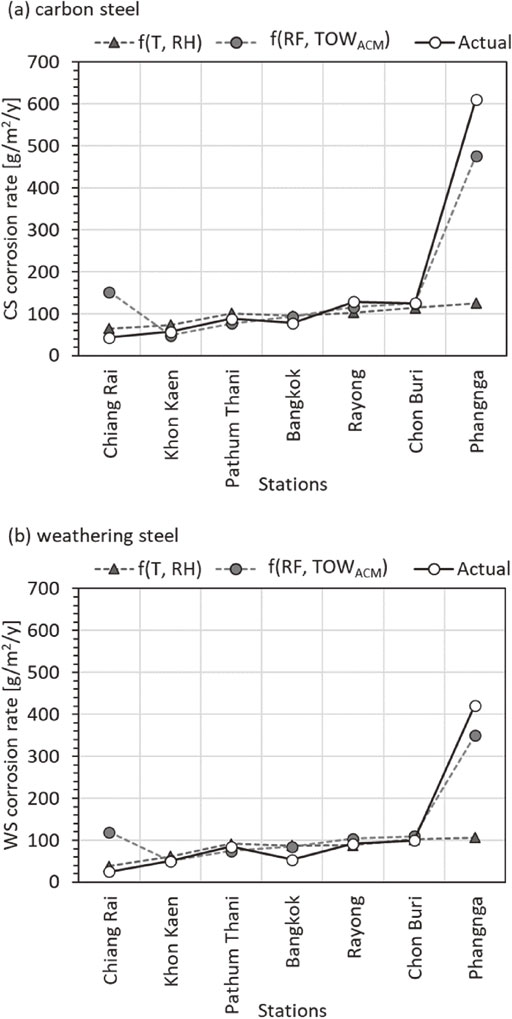
In order to determine the appropriate prediction equation, the actual and the calculated corrosion rate are plotted, as shown in Fig. 4. Equations (3) to (8) were applied to the environmental data at each test site and plotted with the actual corrosion rate. In the low Cl− environments, the corrosion rate followed T and RH function. In the high Cl− environments, the corrosion rates followed RF and Cl− function. However, the Cl− deposition rate from this study was localized to the test area. Systematic salt aerosol transport study is required to derive the airborne salinity as a function of distance from the sea for Thailand. The only available chloride deposition rate as a function of distance from the sea is the Cole et al.44) model that represents the South East Asia region. Alternatively, corrosion rates of carbon steel and weathering steel can be predicted from TOWACM in the coastal area as shown in Fig. 4(a) and 4(b), respectively. It is suggested that the corrosion rate can be predicted by RF and TOWACM function (expressed by eqs. (5) and (8)).
To construct a corrosion map of Thailand, an empirical equation of carbon steel corrosion rate as a function of T-RH (eq. (3)) and RF-TOWACM (eq. (5)) are applied to the inland region and the coastal region, respectively. Thai Meteorological Department provided 30-year average T, RH, and RF data of 122 stations.45) The National Hydro Informatics and Climate Data Center provided 10 year average data from 207 stations.46) The climate spatial data were interpolated based on inverse distance weighing method. TOWACM data was calculated from raster layer of T and RH by applying eq. (1). Finally, the corrosion rate was calculated from respective raster layers following eqs. (3) (inland) and (5) (coastal) as described in Section 3.3. Corrosion maps created by geographic information system (GIS) from the data of this study are presented in Fig. 5 for carbon steel and Fig. 6 for weathering steel. These corrosion maps are the first approximated indicator for corrosion rate or corrosivity level in Thailand. It is shown that corrosion in the inland region of Thailand is classified as C2. The coastal region can be divided into 3 zones as shown in Table 5.


Table 5 Corrosion classifications for coastal zones.
For the Bay of Bangkok to Sattahip Bay, the average depth of the Gulf of Thailand is 58 m, receiving river water from three main rivers in Thailand. The salinity is low due to inflow of river and low water exchange. The aggressiveness of corrosion is only categorized as C2 for both carbon and weathering steels. Compared with another low water exchanged area in Cuba (C3),11) the Bay of Bangkok corrosivity is considered milder. C3-C4 for carbon steel and C3 for weathering steel regions are situated between Prachuap Bay and Bandon Bay. The highest corrosivity zone includes all high rainfall coastal area. Chantaburi-Trat is classified as C4-C5 for carbon steel and C3-C4 for weathering steel. Below Bandon Bay, it is closer and linked to the South China sea; thus, water exchange is higher as well as the salinity. This zone is classified as C4-C5 for carbon steel and C3-C4 for weathering steel. For Andaman Sea, it is also categorized as C4-C5 for carbon steel and C3-C4 for weathering steel. The amount of chloride at Phangnga is comparable to Puntarenas, Costa Rica;12) however, the first-year corrosion rate at Phangnga is 25% faster due to higher amount of rainfall that accelerates corrosion as implied by our regression model.
To validate these corrosion maps, the interpolated results and actual results for 7 test sites are plotted as shown in Fig. 7. It is illustrated that the difference between the actual and the GIS results for carbon steel (Fig. 7(a)) were within 28%, except Chiang Rai and Bangkok. For weathering steel (Fig. 7(b)), the difference between the actual and the GIS results were within 13%, except Chiang Rai and Bangkok as well. The current T and RH equations overestimated the corrosion loss for these two test sites. Other parameters not yet accounted for might play a role in lowering the corrosion rate at these two sites. More data collection of nearby area in the northern region and Bangkok will lead to more suitable prediction expression. More exposure tests are being conducted at various test sites in Thailand for model update and validation. On-going study on Cl− deposition rate map and detailed data monitoring are expected to provide a more accurate corrosion map, especially for both coastal sides of southern peninsula regions.

4. Conclusions
Outdoor corrosion rate predictions for carbon and weathering steels based on environmental factors and ACM sensor were derived from empirical models. ACM sensor data can be applied as corrosion prediction parameters in form of time of wetness (TOW). The atmospheric corrosion experiment and corrosion maps illustrate corrosivity at different geographical locations as follows:
-
(1)
The corrosion rate for inland area depended mainly on temperature and relative humidity.
-
(2)
The corrosion rate for coastal area depended on rainfall and Cl− deposition rate or rainfall and TOWACM.
-
(3)
All test stations at Pathum Thani, Bangkok, and Rayong exhibited SO2 deposition rate equivalent to urban atmosphere. However, SO2 deposition rate was considered insignificant in the 2-variable regression model due to neutralizing effect with NH3.
-
(4)
Corrosivity in Thailand was mild in the northern, northeastern, and central part of Thailand due to diminishing Cl− level in the inland region (C2) (Stations 1–6).
-
(5)
Corrosivity was high in the southern part of Thailand (Station 7) due to high Cl− deposition rate from the influence of monsoon and its peninsula landscape (C4).
-
(6)
According to the corrosion map of carbon steel, corrosivity at Bangkok-Sattahip Bay was C2, Prachuap Bay was moderate (C3) due to the shallow Gulf of Thailand. Corrosivity was the highest (C4-C5) at Chantaburi-Trat coast, below Bandon Bay and Andaman coast due to high salinity, TOWACM, and rainfall.
-
(7)
For weathering steel, corrosivity at Bangkok-Sattahip Bay was C2, Prachuap Bay was moderate (C3) due to the shallow Gulf of Thailand. Corrosivity was the highest (C3-C4) at Chantaburi-Trat coast, below Bandon Bay and Andaman coast due to high salinity, TOWACM, and rainfall.
Acknowledgments
This work was supported by the National Metal and Materials Technology Center, Thailand (P1201530) under e-ASIA Joint Research Program conducted in parallel with Dr. Tadashi Shinohara’s team (Japan) and Dr. Le Thi Hong Lien’s team (Vietnam). Extended work on GIS study was supported by the National Metal and Materials Technology Center, Thailand (P1850634). Authors are also grateful for invaluable comments from Prof. Supapan Seraphin (NSTDA Professional Authorship Center).
REFERENCES
- 1) ISO 9223:2012(en), Corrosion of metals and alloys — Corrosivity of atmospheres — Classification, determination and estimation, (2017). https://www.iso.org/obp/ui/#iso:std:iso:9223:ed-2:v1:en (accessed October 12, 2017).
- 2) T.E. Graedel and C. Leygraf: Scenarios for Atmospheric Corrosion in the 21st Century, (2001).
- 3) L.T.H. Lien and H.L. Hong: Int. J. Engine Res. 2 (2016) 86–95.
- 4) L.T.H. Lien, P.T. San and H.L. Hong: Proc. Jpn. Soc. Corros. Eng. Conf., (Tokyo, Japan, 2009) p. A305.
- 5) L.T.H. Lien: Tạp Chí Khoa Học Và Công Nghệ 51(3) (2013) 379–391.
- 6) W. Pongsaksawad, E. Viyanit, S. Sorachot and T. Shinohara: Corrosion J. Met. Mater. Miner. 20 (2010) 23–27.
- 7) L. Mariaca, C. Menchaca, E. Sarmiento, O. Sarmiento, J. Ramirez and J. Uruchurtu: Innov. Corros. Mater. Sci. 4 (2014) 11–20.
- 8) F. Corvo, N. Betancourt and A. Mendoza: Corros. Sci. 37 (1995) 1889–1901.
- 9) F. Corvo, T. Perez, L.R. Dzib, Y. Martin, A. Castañeda, E. Gonzalez and J. Perez: Corros. Sci. 50 (2008) 220–230.
- 10) S.A. Abdul-Wahab, C.S. Bakheit, R.A. Siddiqui and S.M. Al-Alawi: J. Corros. Sci. Eng. 5 (2003) 1–22.
- 11) A. Castañeda, C. Valdés and F. Corvo: Mater. Corros. 69 (2018) 1462–1477.
- 12) B. Chico, D. de la Fuente, I. Díaz, J. Simancas and M. Morcillo: Materials 10 (2017) 1–26.
- 13) S. Motoda, Y. Suzuki, T. Shinohara, Y. Kojima, S. Tsujikawa, W. Oshikawa, S. Itomura, T. Fukushima and S. Izumo: Zairyo-to-Kankyo 43 (1994) 550–556.
- 14) T. Shinohara: Zairyo-to-Kankyo 64 (2015) 26–33.
- 15) Y. Ito and S. Kainuma: Eur. Corros. Congr. EUROCORR, (2011) pp. 3290–3295. https://kyushu-u.pure.elsevier.com/en/publications/applicability-of-an-acm-type-corrosion-sensor-to-evaluations-of-c (accessed December 22, 2019).
- 16) N. Fuse, A. Naganuma, T. Fukuchi, J. Tani and Y. Hori: EUROCORR, (2016) pp. 1–10.
- 17) N. Fuse, Y. Shumuta, A. Naganuma, J. Tani and Y. Hori: Corrosion 75 (2019) 839–847.
- 18) A. Wexler and S. Hasegawa: J. Res. Natl. Bur. Stand. 53 (1954) 19.
- 19) J.R. Duncan and J.A. Ballance: Degrad. Met. Atmosphere, (1987). https://doi.org/10.1520/STP25859S.
- 20) I.S. Cole, D. Lau and D.A. Paterson: Corros. Eng. Sci. Technol. 39 (2004) 209–218.
- 21) D. To, T. Shinohara and O. Umezawa: ECS Trans. 75 (2017) 1–10.
- 22) S. Motoda, Y. Suzuki, T. Shinohara, Y. Kojima, S. Tsujikawa, W. Itomura, T. Fukushima and S. Izumo: Zairyo-to-Kankyo 43 (1994) 550–556.
- 23) JIS Z 2381:2001, General requirements for atmospheric exposure testing, (2018). https://www.techstreet.com/standards/jis-z-2381-2017?product_id=2001096 (accessed February 2, 2018).
- 24) ASTM G1-03(2011), ASTM International, (West Conshohocken, PA, 2011), www.astm.org, (n.d.). https://doi.org/10.1520/g0001.
- 25) JIS Z 2382:1998, Determination of pollution for evaluation of corrosivity of atmospheres, (2018). https://www.techstreet.com/standards/jis-z-2382-1998?product_id=1233125#jumps (accessed February 2, 2018).
- 26) W. Oshikawa, T. Shinohara and S. Motoda: Zairyo-to-Kankyo 52 (2003) 293–298.
- 27) Network Center for EANET: EANET Data on the Acid Deposition in the East Asian Region, https://monitoring.eanet.asia/document/public/index (24 August, 2020).
- 28) R. Wang and M. Kido: Mater. Trans. 48 (2007) 1451–1457.
- 29) K. Sugae, T. Kamimura, H. Miyuki and T. Kudo: Mater. Trans. 59 (2018) 779–786.
- 30) M. Eiamsa-ard and S. Amornchairojkul: ICLARM Conf. Proc., (1998) pp. 85–95.
- 31) I.S. Cole, D.A. Paterson, W.D. Ganther, A. Neufeld, B. Hinton, G. McAdam, M. McGeachie, R. Jeffery, L. Chotimongkol, C. Bhamornsut, N.V. Hue and S. Purwadaria: Corros. Eng. Sci. Techn. 38 (2003) 267–274.
- 32) L. Yang, S. Mukherjee, G. Pandithurai, V. Waghmare and P.D. Safai: Sci. Rep. 9 (2019) 1–13.
- 33) W. Kompor, C. Ekkawatpanit and D. Kositgittiwong: Ocean Coast. Manage. 160 (2018) 64–74.
- 34) T. Shinohara, S. Motoda, K. Nabeshima, Y. Suzuki and S. Tsujikawa: Zairyo-to-Kankyo 48 (1999) 796–806.
- 35) P. Klomjit, M. Omoda, D. Mizuno, N. Ishikawa, N. Palsson, W. Pongsaksawad and E. Viyanit: Corrosion 75 (2019) 960–972.
- 36) N.S. Palsson, K. Wongpinkaew, P. Khamsuk, S. Sorachot and W. Pongsaksawad: Mater. Corros. 71 (2020) 1019–1034.
- 37) R.W. Revie and H.H. Uhlig: Uhlig’s Corrosion Handbook, 3rd ed., (Wiley, New York, 2011).
- 38) F. Corvo, T. Pérez, Y. Martin, J. Reyes, L.R. Dzib, J. González-Sánchez and A. Castañeda: Corros. Sci. 50 (2008) 206–219.
- 39) I.S. Cole, W.D. Ganther, S.A. Furman, T.H. Muster and A.K. Neufeld: Corros. Sci. 52 (2010) 848–858.
- 40) F. Haynie, J. Spence and J. Upham: Corros. Eng. Met., (1978) 30-30–18. https://doi.org/10.1520/stp27313s.
- 41) D. Knotková-Čermáková, J. Vlčková and J. Honzák: ASTM Spec. Tech. Publ. 767 (1982) 7–44.
- 42) D. Knotková and V.Ú.O. Materiálu: Corrosion Attack on Weathering Steel, Zinc and Aluminium: Evaluation After 8 Years of Exposure, (1997). https://books.google.co.th/books?id=c4ZHmwEACAAJ.
- 43) I. Díaz, H. Cano, B. Chico, D. de la Fuente and M. Morcillo: Int. J. Corros. 2012 (2012) 812192.
- 44) I.S. Cole, W.D. Ganther, D.A. Paterson, G.A. King, S.A. Furman and D. Lau: Corros. Eng. Sci. Technol. 38 (2003) 259–266.
- 45) Climatological data of Thailand for 30-year period, (1981–2010), (2010).
- 46) Climate data, National Hydro Informatic Climate Data Center, (2008).

