Microstructure of Materials
Texture Formation through Thermomechanical Treatment and Its Effect on Superelasticity in Mg–Sc Shape Memory Alloy
2020 Volume 61 Issue 12 Pages 2270-2275

Details
2020 Volume 61 Issue 12 Pages 2270-2275
The formation of texture through thermomechanical treatment was investigated in Mg–18.8 at% Sc shape memory alloy to enhance its superelasticity at room temperature. The samples were cold rolled in an α phase or in a β phase and then finally heat treated at 690°C followed by water quenching to obtain a β phase. In the case of cold rolling in the α phase, a basal-plane texture was formed, while no preferential texture was observed along in-plane direction. After the final heat treatment, {011}⟨uvw⟩β transformation texture was obtained, according to Burgers relationship, indicating no improvement of the superelasticity along in-plane direction. In the case of the cold rolling in the β phase, a weak {111}⟨011⟩β recrystallization texture was obtained. The sample showed about 0.65% superelastic tensile strain along rolling direction, while that along transverse direction (//∼⟨113⟩β) showed only about 0.43%. This trend is in good agreement with the orientation dependence of the transformation strain, but, the obtained superelastic strain was much lower than the expected value, which is due to the weak texture and suggests the existence of a strong grain constraint in the Mg–Sc shape memory alloy.
This Paper was Originally Published in Japanese in J. Japan Inst. Met. Mater. 84 (2020) 253–259.

Magnesium alloys have great potential as structural materials for automobile components and computers cases, among others, because of its lightweight and high specific strength. Moreover, the biocompatibility of Mg alloys indicates they could be used as core materials for medical devices. Mg alloys, however, show poor plastic workability at room temperature due to their anisotropic crystal structure, i.e., hexagonal close-packed (hcp) structure. To improve their workability, Mg–Li alloys, which have an isotropic body-centered cubic (bcc) structure, have been widely investigated. Mg–Li binary alloys with a Li content of more than 12.5 mass% have a bcc-single phase and show an excellent tensile elongation.1) Unfortunately, these alloys have low tensile strength and poor corrosion resistance.1,2) Moreover, these characteristics cannot be improved by microstructure control through heat treatment, as in Ti alloys, because the boundaries between the hcp (α)/α + bcc (β) and α + β/β phases is almost perpendicular to the composition axis in the phase diagram.
Our research group has focused on Mg–Sc binary alloys, which are the only other Mg-based alloys with a bcc structure in the Mg-rich region. Mg–Sc alloys show a phase transformation between a low temperature α phase and high temperature β phase in the Mg-rich region when changing the heat treatment conditions, similar to Ti alloys. The two-phase alloy heat treated in the α + β region shows a high ultimate tensile strength of over 300 MPa with an elongation of approximately 29%.3) The β single-phase alloy also shows excellent mechanical properties; tensile strength of over 250 MPa and elongation of 25%.3) In addition, it has been reported that Ti alloys with appropriate alloying elements show a thermoelastic martensitic transformation from a metastable bcc phase to an α′′ phase (orthorhombic structure) and exhibit shape memory effect and/or superelasticity.4–6) Our research group found that Mg–Sc alloys also show the thermoelastic martensitic transformation between bcc and orthorhombic structures and exhibit shape memory effect and/or superelasticity.7) Furthermore, we recently reported that the alloys show superelasticity even at room temperature when optimizing the Sc content.8) Similar to Cu- and Fe-based shape memory alloys,9–11) the superelastic strain can be largely improved by increasing the relative grain size d/t (d = average grain size, t = sample thickness) owing to the decrease in grain constraint from the surrounding grains.8) A sample with a grain size of ∼5 mm shows a superelastic strain of approximately 3% at room temperature.8)
Texture formation is a different way to improve superelastic properties. For example, a strong recrystallization texture in which the ⟨011⟩ direction is parallel to the rolling direction is obtained in Ti-based shape memory alloys after heavy cold rolling (thickness reduction of 99%) in a β-single phase and subsequent solution treatment at the β-single phase temperature.12,13) Based on phenomenological calculations, Ti-based shape memory alloys are known to show a maximum superelastic strain along the ⟨011⟩ direction; therefore, polycrystalline alloys with strong recrystallization texture may present excellent superelastic properties.13,14) However, to the best of our knowledge, there are no reports on the recrystallization texture of Mg–Sc alloys. Moreover, in addition to the recrystallization texture, the transformation texture, which is acquired from the deformation texture, has been investigated in controlled-rolled steels and ausformed steels based on the orientation relationship during the transformation.15,16) It is well known that Mg alloys with an α phase show a basal texture after deformation.17,18) Also, it has been reported that the α phase in the Mg–Sc α + β-two phase alloy shows a basal texture after cold-rolling.19) Therefore, the basal texture in the α phase formed by cold rolling is expected to result in a β transformation texture in Mg–Sc alloys. In this study, we investigated the formation of texture in the β phase of a Mg–Sc alloy and analyzed the effect of the texture on the superelastic properties of the alloy at room temperature.
A Mg–Sc alloy ingot was obtained from OSTECH Co. Ltd. and Hunan Oriental Scandium Co. Ltd. The average composition (Mg–18.8 at% Sc) was determined using an electron probe micro analyzer (EPMA). Blocks with a thicknesses of about 15 mm were cut from the ingot and hot rolled at 650°C down to 5 mm. The rolled samples were homogenized at 600°C for 24 h, then treated as described in section 2.2 to achieve texture.
2.2 Thermomechanical treatments 2.2.1 Cold rolling in α-single phaseThe homogenized samples were solution treated at 690°C for 30 min followed by quenching into iced water to obtain a β-single phase. The samples were then heat treated at 500°C for 2 h and quenched to obtain an α-single phase. It is worth noting that the solution treatment at the β-single phase temperature can randomize the texture in the α phase.19) The thermomechanical treatments (TMP 1–3) listed below were conducted for the obtained α-single phase sample, Fig. 1(a)–(c). The thickness reduction per pass was set to about 2%.

Schematic diagrams of the thermomechanical processes (TMP), (a) TMP1, (b) TMP2, (c) TMP3, and (d) TMP4. ST, WQ and CR indicate solution treatment at β-single phase temperature range, water quenching and cold rolling, respectively.
The homogenized samples were solution treated at 690°C for 5 min and quenched into iced water to obtain a β-single phase. The thermomechanical treatment TMP 4 was conducted for these samples, Fig. 1(d), in which the thickness reduction per pass was set to about 2%.
The texture of the samples was analyzed by electron backscatter diffraction (EBSD). Prior to the EBSD measurement, the sample surface was mechanically polished with SiC papers and diamond pastes of different grits, and then chemically etched to obtain a mirror-like surface. The step size and scan area were respectively 2 µm and ∼450 × 1300 µm in the α-single phase sample (grain size ∼25 µm), and 4 µm and ∼900 × 2600 µm in the β-single phase sample (grain size ∼150 µm). EBSD was conducted in two different areas in each sample. Pole figures (PFs) and inverse pole figures (IPFs) for each sample were obtained from the average of the two areas.
2.4 SuperelasticityCyclic loading-unloading tensile tests were conducted at room temperature to investigate superelasticity (strain rate = 10−3 s−1). The sample was loaded until the strain reached N% and unloaded down to zero stress in the Nth cycle (N = 1, 2, 3, …). The loading-unloading cycle was repeated until the applied strain reached 5%. The width, thickness, and gauge length of the samples were 4, 0.5, and 15 mm, respectively.
Figure 2 shows IPF maps in normal direction (ND) and (0001) PFs obtained from the α-single phase sample after cold rolling to a total thickness reduction of 40% and 68%. To achieve a high image quality (IQ) value, the samples were annealed at 500°C for 15 min before the EBSD measurement. The results for the α-single phase sample with no cold rolling are shown in Fig. 2(c) for comparison. The diagram in Fig. 2(d) shows the normal (ND), rolling (RD) and transverse (TD) directions. Figure 2(e) shows the reference-unit stereographic triangle.

IPF maps and (0001)α pole figures of the α-phase samples, (a) after 40% cold rolling in TMP 1 followed by annealing at 500°C for 15 min, (b) after 68% total cold rolling in TMP 2 followed by annealing at 500°C for 15 min, and (c) no cold rolling (TMP 3). (d) The reference directions in a rolled sheet and (e) the reference-unit stereographic triangle.
Figure 3 shows IPFs in the ND (top) and RD (bottom) of the samples obtained under different rolling conditions. As seen from Fig. 2(c) and Fig. 3, the α-single phase sample before cold rolling shows a random texture, indicating that the phase transformation from β to α causes the randomization of the texture, as previously reported.19) Moreover, Fig. 2(a) shows that the (0001) plane is likely to be parallel to the rolling plane after cold rolling to a 40% thickness reduction, which is similar to the behavior of conventional Mg alloys with a basal texture obtained by cold rolling. Further cold rolling, i.e., to a thickness reduction of 68%, results in a stronger basal texture, Fig. 2(b). The IPFs in the RD (Fig. 3) also indicate that no specific texture is formed in the rolling plane.

Inverse pole figures of the α-phase in ND and RD obtained after 40% cold rolling in TMP 1 followed by subsequent annealing at 500°C for 15 min, 68% total cold rolling in TMP 2 followed by subsequent annealing at 500°C for 15 min and without cold rolling (TMP 3).
Figure 4 shows the (a) IPF map and (b) IPF of the β-single phase sample after TMP 1. The β-single phase sample has a transformation texture with the {011} plane parallel to the rolling plane, Fig. 4(b). It is worth noting that the pixels with a confidence index value of 0.1 or less are shown in black in the map, Fig. 4(a). The black areas correspond to plate-like shaped martensite phases (black arrow in Fig. 4(c)) that are formed during quenching. Figure 5 shows the IPFs in the ND and RD of the β-single phase samples after TMP 1, TMP 2, and TMP 3. For the TMP 1 and TMP 2 treated samples, the {011} plane of the β phase tends to be parallel to the rolling plane, and the tendency becomes more evident when increasing the cold rolling reduction ratio, suggesting that the transformation texture of the β phase acquires the rolling texture formed in the α phase. In fact, in the sample with no cold rolling in the α phase (TMP 3 sample), the {011} plane is not parallel to the rolling plane. Moreover, in the RD, when the cold-rolling reduction ratio increases there is no clear tendency on the formation of a specific crystal orientation. The mechanism of formation of the β phase transformation texture is explained as follows. It has been reported for Mg–Sc alloys that an α phase precipitates in a β matrix phase by aging, in accordance with the following Burgers relationship:20–22)
| \begin{equation*} ([1\bar{2}10]_{\alpha} \mathrel{/\!/} [111]_{\beta},\ (0002)_{\alpha} \mathrel{/\!/} (\bar{1}01)_{\beta}). \end{equation*} |

(a) An IPF map and (b) an inverse pole figure in ND of the sample after TMP 1. (c) SEM image in high magnification.

Inverse pole figures of the β-phase in ND and RD obtained after 40% cold rolling in TMP 1 followed by subsequent solution treatment at 690°C for 10 min, 68% total cold rolling in TMP 2 followed by subsequent solution treatment at 690°C for 10 min and without cold rolling (TMP 3) followed by subsequent solution treatment at 690°C for 10 min.
Figure 6 shows IPF maps and IPFs in (a) ND, (b) RD, and (c) TD obtained from the β-single phase sample after TMP 4. The results indicate that the β-Mg–Sc alloy after cold rolling in the β phase followed by solution treatment at the β single-phase temperature region shows near {111}⟨011⟩ recrystallization texture. The RD and TD tend to orient in the ⟨011⟩ and ⟨113⟩ directions, respectively. The ⟨011⟩ orientation in the RD formed by cold rolling has also been reported in other bcc-type alloys, such as Ti- and Cu-based alloys with a {112}⟨011⟩ recrystallization texture12,13,23) and carbon steels with a {111}⟨011⟩ recrystallization texture.24) It is known that the recrystallization texture intensity strongly depends on the cold-rolling reduction ratio, and that a strong texture can be obtained when the reduction ratio exceeds 50%.12,23) In the case of Ti-based alloys, the intensity of the recrystallization texture obtained after cold rolling to a 99% thickness reduction is 40 times stronger than that of the random texture.12) As mentioned in section 2.2.2, the Mg–Sc alloy obtained here has relatively large β grain size that causes an intergranular fracture; limiting the thickness reduction to about 35%. Therefore, only a texture with low intensity (∼2) can be obtained, as shown in Fig. 6. Additionally, the strains of the martensitic transformation between the bcc and orthorhombic structures in the alloy are expected to be ∼8.8% along the ⟨011⟩ direction and ∼6.2% along the ⟨113⟩ direction, according to the orientation dependence of the transformation strain under tensile deformation.25) In other words, tensile testing along the RD and TD can indicate how the recrystallization texture obtained by TMP 4 affects the superelasticity.

IPF maps and inverse pole figures in (a) ND, (b) RD, (c) TD obtained for the β-phase after TMP 4.
Figure 7(a) shows the cyclic stress-strain curves along the RD and TD obtained from sheet samples with β-single phase after TMP 4. The $\varepsilon _{\text{SE}}^{i}$, $\varepsilon _{\text{t}}^{i}$, $\varepsilon _{\text{r}}^{i}$, and $\varepsilon _{\text{e}}^{i}$ correspond to the superelastic strain, total strain, residual strain, and elastic strain at the ith cycle. As seen from Fig. 7(a), the RD sample (//∼⟨011⟩) shows lower apparent yield stress, i.e., lower stress to induce the martensite phase, than the TD sample (//∼⟨113⟩). The difference in yield stress can be explained by the difference of the texture orientation in the tensile direction. According to the Clausius–Clapeyron relationship, the stress to induce the martensitic transformation decreases with increasing transformation strain. The orientation dependence of the transformation strain in the β-Mg–Sc alloy indicates that the ⟨011⟩ orientation has a larger transformation strain than the ⟨113⟩ orientation.25) This suggests that the RD sample with ⟨011⟩ orientation in the tensile direction would have lower stress for the induction of the martensitic transformation than the TD sample with ⟨113⟩ orientation. The dependence of yield stress on texture orientation has also been observed in Ti-13,14,26) and Cu-based23) shape memory alloys. In Fig. 7(b), superelastic strains were plotted as a function of the applied strain. The RD sample shows a slightly better superelasticity than the TD sample, which agrees with the orientation dependence of the transformation strain. The difference in superelastic strain between the two samples is, however, only 0.2%, and the superelastic strain obtained in the RD sample is limited to ∼0.65%. This is due to the weak texture because of the low cold workability. The results suggest that the formation of the recrystallization texture is not very effective in enhancing the superelasticity of the Mg–Sc alloy. To form a strong texture, it is necessary to improve the cold workability through grain refinement. The Mg–Sc alloy, however, shows a β-transus temperature of ∼650°C and a solidus temperature of ∼720°C. Therefore, according to the reported phase diagram of Mg–Sc binary alloy, the temperature window to obtain a β-single phase is very narrow.3,27) This indicates that solution treatment at a temperature just below the melting point is required to obtain a β-single phase, causing a rapid grain growth to about 150 µm even for a short-time treatment. Grain refinement by pinning effect through the addition of a third element may improve the cold workability of the β phase and enhance the texture development.
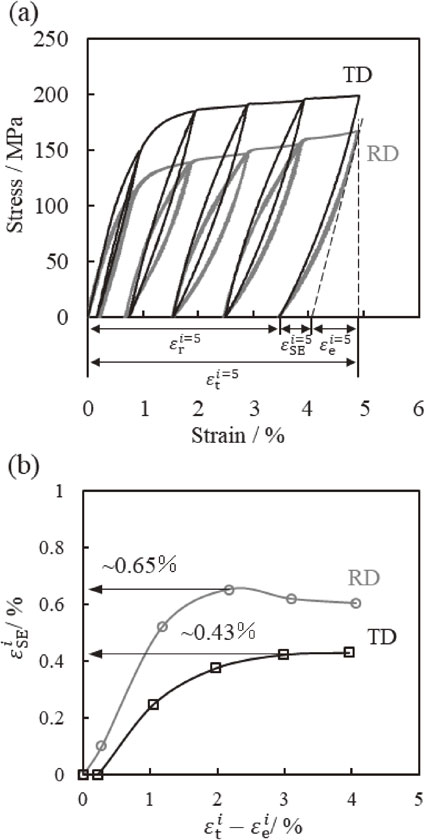
(a) Cyclic tensile stress-strain curves tested along RD and TD at room temperature. (b) Plots of superelastic strain as a function of the applied strain.
In addition, it is worth noting that some alloys show superior superelasticity in spite of a low texture intensity.23) The results in this study indicate that plastic deformation is easily introduced in the Mg–Sc alloy. Generally, the stress to induce a martensitic transformation is increased by the grain constraint; once the stress exceeds the critical value for slip deformation, plastic deformation is introduced and deteriorates superelasticity.9,10) Since the Vickers hardness of the Mg–18.8 at% Sc alloy is just about 100 Hv, its critical stress for slip is much lower than that of other shape memory alloys, resulting in a small superelastic strain. It is therefore necessary to not only develop texture and control the grain size but also to increase the strength of the β matrix phase by the addition of a third element to enhance the room temperature superelasticity of the Mg–Sc binary alloy.
The formation of texture by thermomechanical treatment of a Mg–18.8 at% Sc alloy was studied. When cold rolling in the α single-phase, the basal texture became more evident as the thickness reduction ratio increased. When the cold-rolled samples were solution treated in the β single-phase, the transformation texture of the {011}β plane parallel to the rolling plane was formed according to the Burgers relationship between the α and β phases. In this case, however, no specific orientation was observed in the RD and TD in the cold-rolled α single-phase samples, resulting in a randomly-oriented transformation texture.
When cold rolling in the β single-phase, a weak {111}⟨011⟩ recrystallization texture was obtained after a total thickness reduction of 35%. The intensity of the recrystallization texture was approximately two times stronger than that of the random texture. The superelastic strain of the samples was limited to 0.65% even when the tensile direction was set to be along the RD, in which the maximum superelastic strain was expected because of the orientation dependence of the transformation strain. This limited value is due to the low cold workability of the β-Mg–Sc alloy with relatively large grain size. Thus, improving the cold workability of the β phase via grain refinement by the addition of a third element is expected to enhance the texture development and improve the superelasticity of the Mg–Sc alloy. Moreover, the results suggest that plastic deformation is easily introduced in the Mg–Sc binary alloy, implying that strengthening of the β phase is also necessary to enhance the room temperature superelasticity.
This work was supported by JSPS KAKENHI Grant Numbers (17J10094, 18K14032, 18H01691) and Adaptable and Seamless Technology transfer Program through Target-driven R&D (A-STEP) from Japan Science and Technology Agency (JST).