Environment
Analysis on the Utilization of Opinion of Bridge Inspection Results Using Topic Model for Maintenance and Management
2020 Volume 61 Issue 12 Pages 2428-2434
Details
2020 Volume 61 Issue 12 Pages 2428-2434
Utilization of collected and accumulated data of bridge inspection results is required for maintenance. Although the qualitative evaluation items of bridges have frequently been used in the past, this research focuses on the opinions of technical experts during bridge inspection. Topic models consist of probabilistic modeling of term frequency occurrences in documents, which can be used to classify documents containing opinions of bridge inspections. A topic model can be applied to the text data to detect the characteristics of bridge damage not recorded as database evaluation items. The topics corresponding to the characteristic damage condition of the bridge can then be organized. In this study, topics have been organized by high probability words about deterioration due to ASR (Alkali-Silica Reaction), which is a characteristic deterioration in the Hokuriku region. By focusing on the opinions from bridge inspections associated with high probability topics, early detection and preventative maintenance are possible. Although effective results were obtained, some topics were organized by the characteristic writing of the inspection company. This means that in order to accumulate the inspection data while maintaining quality, it is necessary to consider the method and writing style that was used in creating the contents of the opinion in the bridge inspection report.
This Paper was Originally Published in J. Soc. Mater. Sci., Japan 69 (2020) 197–203.
The rapid deterioration of aging infrastructures has necessitated the systematic maintenance of these structures. The revision of the Road Law in Japan in 2014 mandates periodical visual inspections of bridges to determine appropriate maintenance measures. In response, substantial inspection systems and practices have been established, and the results obtained from these inspections have been accumulated. In addition, research on the sophistication and efficiency of maintenance using these accumulated bridge inspection results have been performed. Moreover, studies investigating the degree of damage to bridge components have also been conducted, with a particular focus on elucidating the soundness of the bridge as a whole and predicting future deterioration.1) Apart from qualitative evaluations of the degree of damage and soundness, an overview of the inspection results based on engineers’ experience is also included. As the design and construction of each bridge is unique, detailed damage evaluation results for each component as well as comprehensive judgments and evaluations conducted by a specialist engineer are essential to ensure appropriate maintenance for bridges in different scenarios. However, very few studies have focused on analyses considering these expert observations of bridge inspection. In recent years, in the field of natural language processing (NLP) and analyses and prediction models for text, such as descriptive sentences, have been rapidly developed. Among these, topic modeling is known for its ease of use and effective results. In this study, we focus on the text data written by an expert in the findings column of bridge inspection data, to analyze the deterioration tendency of bridges, using the topic model, and further examine its utilization for future maintenance measures.
1.2 Previous studies 1.2.1 Analysis of bridge inspection resultsSeveral analyses and studies have been conducted using the results of bridge inspections for their systematic operation. For formulating a long-term maintenance plan, it is necessary to evaluate the soundness through regular inspections of the currently managed bridges and to predict future deteriorations, which is the focus of several quantitative evaluation studies. Tamakoshi et al.2,3) conducted a detailed analysis of bridge inspection results recorded by the respective Regional Development Bureaus of the Ministry of Land, Infrastructure, Transport, and Tourism to grasp the overall trend of deterioration in the main members of concrete and steel bridges. Tsuda et al.4) developed a new deterioration prediction method using the bridge soundness recorded as discrete values. Furthermore, several improved models have been developed since the method was proposed.5)
1.2.2 Application of topic modelingThe progression of NLP techniques, such as topic modeling, and text archives, have been analyzed in a variety of research fields. Some of the previous research that uses topic models to extract and summarize information and predict latent demand is described as follows. Matsukawa6) discussed the application of topic modeling to extract topics from the free description of a class evaluation questionnaire and the validity of the extracted labels. Furthermore, the questionnaire can be automatically categorized because the extracted labels are suitable for the human senses. Tsukai and Shiino7) reported that applying the topic model to the proceedings of the municipality committee can selectively extract topics from the proceedings composed of multiple topics and follow the transition of topics in the meeting. Tsukai and Tsukano8) compared the applicability of topic models in geographic information analysis with the results obtained via factor analysis. The topic model is effective for applying the data that is characteristic of almost zero counts. Further, interpreting the results can be relatively easy because the analysis limits the parameter to non-negative values. Satomura9) simultaneously analyzed customer purchase histories and their lifestyles by applying joint topic modeling, which is an extension of the topic model, and implied that it could be used to understand the potential demand for a purchase.
1.3 Position of this studyAn example of the information items stored in the bridge management system is shown in Fig. 1. These bridge specifications and inspection results have been analyzed in a previous study.2,3) However, evaluating the soundness of bridges varies depending on the parameters and construction methods. Bridge soundness is evaluated differently by the respective municipalities based on the bridge life-extending repair plan. Therefore, (1) bridge soundness cannot be evaluated by accumulating the damage evaluation data for each part and (2) various states of deterioration of the bridge are difficult to represent with the items accumulated in the system; in other words, all the details regarding the evaluation of deterioration cannot be recorded in the system. For this reason, it is important to consider the results of surveys by experts who understand the situation based on the results of inspections at the site. The analyses of these explanations are used for evaluating the bridges. An example of the description of a diagnosis based on inspection is shown in Fig. 2. In the description of the diagnosis, the expert’s tacit knowledge regarding the deterioration is included, which is not recorded in the database as qualitative evaluation. This study focuses on the expert’s descriptive notes and applies topic modeling to explore its potential use for maintenance and operations. Early deterioration of bridges caused by ASR has affected the maintenance of bridges in the Hokuriku region in Japan,10) where it is necessary to detect deterioration trends and perform preventive maintenance in advance. Topic modeling is applied to the notes to extract information related to the characteristic deterioration in the region, such as ASR, and used for planning the maintenance operation of the bridges by focusing on the bridges which return a high proportion of the topic.

Example of the information accumulated in Bridge Management System.

Example of opinion on bridge inspection results.
The topic model to predict the occurrence of hidden words in a given document was developed in the field of NLP. The model was developed as a probabilistic generative model that uses a combination of terms and their frequency in documents and is called Bag of Words (BoW). Even for image data usually unexpressed by BoW, the model was applied by devising a method for extracting the expression, and various extensions and developments were performed according to the data type. Thus, topic modeling has been widely applied and extended to even image data. In this research, basic topic modeling was used. The estimation procedure of the word wd,i assignment is described as follows. The number of documents is represented as M; the number of words in the document is represented as nd; and the probability of the word within the document is represented as wd,i (i = 1, …, nd). The document is organized into k topics, and that proportion is represented as θd = (θd,1, …, θd,K). The probability of the words assigned the topic k is represented as ϕk = (ϕk,1, …, ϕ(k,V)). Moreover, as shown in eqs. (1)–(4), the probability distribution of both topics and words are assumed as a Dirichlet distribution; the generation distribution of the word and the hidden topic is assumed as a multinomial distribution. α and β are parameters of topic distribution θd and word distribution ϕk, respectively. Therefore, the probability of wd,i is inferred through the assigned hidden topic zd,i. The aforementioned vocabulary generative process of topic modeling is represented by the graphical models shown in Fig. 3.
| \begin{equation} w_{d,i} \sim \text{Multi} (\psi_{z_{d,i}}) \end{equation} | (1) |
| \begin{equation} \phi_{k} \sim \text{Dirichlet} (\beta) \end{equation} | (2) |
| \begin{equation} z_{d,i} \sim \text{Multi} (\theta_{d}) \end{equation} | (3) |
| \begin{equation} \theta_{d} \sim \text{Dirichlet} (\alpha) \end{equation} | (4) |

Graphical model representation of the topic model.
Topic modeling can be used to estimate a word’s probability, even if the word does not appear in the document. This is because topic modeling infers the vocabulary probability through the assigned hidden topic. A description of the bridge inspection result by an expert may contain essential instructions for the execution of future maintenance. However, the appropriate notes to be added are not specified and may vary depending on the individual expert; thus, these notes can record diverse observations regarding the inspection results. The notes may include a description of signs of damage seen but not clearly visible. When using topic modeling, the maintenance actions to be undertaken are estimated by evaluating the co-occurrence with other words, even if the damage condition is written with some variations in the terminology.
The number of topics k must be known before performing topic modeling. Perplexity is one of the evaluation metrics for evaluating the model and determining the number of topics k; this metric is widely used for language model evaluation. The documents are divided into training and test data sets ($w_{d}^{test},w_{d}^{train}$); the training set is used to optimize the model. Here, the log-likelihood of $w_{d}^{test}$ is expressed as L [wtest|M]. Furthermore, perplexity PPL [wtest|M] is expressed as follows:
| \begin{equation} \mathrm{PPL} [w^{\textit{test}}|M] = \exp \left(-\frac{L[w^{\textit{test}}|M]}{\displaystyle\sum\nolimits_{d=1}^{M}n_{d}^{\textit{test}}}\right) \end{equation} | (5) |
Perplexity is represented as the number of branches or choices, that is, it represents the performance of predicting a hidden word in a given document; a lower perplexity score indicates a better generalization performance of the model. Inferring the model by using Bayesian estimation and assuming a Dirichlet distribution for the prior distribution θ of each topic is termed as latent Dirichlet allocation (LDA). There are several methods for estimating the parameters in topic modeling. In this study, we used R14) (version 3.4.4) and estimated the parameters using the variational expectation-maximization (VEM) algorithm implemented in the topic models package.13)
2.2 Using dataIn this study, the bridge inspection results implemented and recorded by Toyama Prefecture from 2006 to 2016 were used for analysis. At Toyama Prefecture, there are two types of inspection: regular inspection by the in-house staff, and detailed inspection implemented by outsourcing a private contractor.15) Results of the detailed inspection were used for the analysis because these findings of the experts have been recorded. Although the number of bridges is 609, a total of 702 bridge inspection reports were analyzed, because some of the bridges were inspected multiple times. After sentences were divided into words using MeCab,16) a morphological analyzer, nouns which were considered to have meaning and express words related to the damage situation were extracted. Moreover, the words that are not directly related to the analysis of symbols (for example, “□” or “*”, or “things”) were arbitrarily set as stop words and excluded from the analysis. Finally, 1,779 words (the number of words, including duplication, was 38,591) were analyzed.
Prior to the parameter estimation using topic modeling, the number of topics k must be set. After creating the model using 70% of the documents, validation was performed using the remaining 30% by changing the number of topics, as shown in Fig. 4. The number of topics was set to 30 because perplexity is considered to be stable when the number of topics exceeds 30, as shown in Fig. 4.

Perplexity of models with different number of topics.
Figure 5 shows the distribution of the probability of assignment of a topic in each document (bridge) based on the results of analyzing each sentence using the created model. The vertical axis indicates the number of documents on a logarithmic scale, and the horizontal axis represents the probability of assigning a topic to the sentence. A value closer to 0 indicates a lower probability of the text belonging to a topic, and a value closer to 1 indicates a higher probability of the text belonging to a particular topic. The distribution of γ is significantly high near 0, as shown in Fig. 5. A smaller probability of appearance (γ) for topics that are irrelevant to the document indicates that such topics have been extracted appropriately. In addition, the distribution of γ is relatively constant, except near the vicinity of 0; this implies that there are only a few documents with a few specified topics and that a majority of the documents are organized into multiple topics. The bridge is composed of multiple members, and its progressive nature of deterioration was considered to yield the aforementioned results.
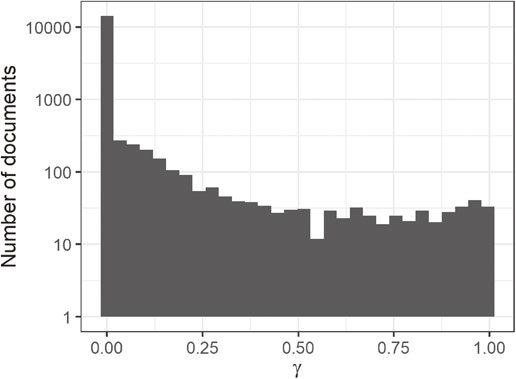
γ (probability that a given document belongs in a given topic) distribution.
Topics that have a characteristic tendency of word appearance probability are extracted; the top 10 words with the highest probability of appearance for each topic are shown in Fig. 6. Words such as “crack,” “damage,” “water leakage,” and “corrosion” have high occurrence probability in many topics. The frequency of occurrence of these words accounts for approximately 10% of the total word occurrences, indicating that the bridge is damaged. These types of damage were also a part of the qualitative evaluation item stored in the database, which indicates that bridge diagnosis has been performed based on such words (item). To clarify the characteristics of the topics, we focused on the words having a high probability of occurrence for each topic. Topic 13, for example, is considered to be related to “ASR” because of the high occurrence of words such as “crack,” “ASR,” and “turtle-shaped.” Similarly, topic 24 is considered to be related to steel bridges or damage of steel members because of the high occurrence of the words, “corrosion,” “break,” and “handrail.” Topic 12 is related to serious damage to the bridge and has a high probability of occurrence of words such as “emergency,” “repair,” and “need.” As explained above, each topic has been formed according to the state and interpretation of the damage.

An example of top terms in topic modeling.
Topics with the highest proportion of words are assigned to the bridge, and the characteristics of the bridges for each assigned main topic were analyzed. The relationship between the main topics and the soundness and the construction year was also analyzed to clarify the features of the topics.
Figure 7 shows the distribution of the degree of health of each topic. The center of the boxplot is the median, the top of the box is the third quartile, the top of the whisker is the (3rd quartile) + 1.5(3rd quartile-1st quartile), and black points represent other outliers. The numbers at the top of the figure represent the number of bridges assigned to the topic. Bridges with the degree of soundness missing were excluded from the analysis. For many topics, the distribution of the degree of soundness is wide, which indicates that the relationship between the degree of soundness and each topic is weak. However, bridges assigned to topic 5, 12, 24, 27, and 29 have low soundness trends. The words with the highest appearance probabilities that compose these topics are “Whole Bridge,” “Urgent,” and “Needs (Repairing).” These words could indicate a bridge that needs immediate repair.

Distribution of health index for each topic.
Figure 8 shows the distribution of bridge construction year for each topic. From the figure, it can be said that topics 16, 21, and 30 are in a damaged state where the range of the whiskers in the box plot is as large as 60 years or more, regardless of the construction year. The words with the highest appearance probabilities for topics 16, 21, and 30, are related to common forms of damage, such as “crack,” “rust,” “water retention,” and “corrosion.” These topics are composed of common damage words found throughout the bridge, and the topic represents general damage regardless of construction age. Topic 14 has a box (whisker) range of more than 60 years, but it is thought that the topic was formed by the manner of writing by the inspection company, and it is considered that the distribution of the construction years has widened. In contrast, for topics 6, 25, 26, and 27, the whiskers range less is than 10 years, and the construction period of the bridges belonging to the topic is concentrated. The words with the highest appearance probabilities in topics 6, 25, 26, and 27 are identified as words related to damage, such as “crack,” “corrosion,” “void in concrete,” and “bar exposure,” and related words about countermeasures, such as “repainting,” “repair,” and “measures.” Words related to countermeasure work for bridges, such as “repairing,” have the highest occurrence probability. Thus, it can be considered that the bridges belonging to these topics have deteriorated over the years since their erection and require measures such as repair.

Distribution of constructed year of bridges for each topic.
Next, among the topic distributions of each sentence, we focus on those sentences in which the probability of belonging to a particular topic is high (γ > 0.5) and consider which inspection company (private contractor) performed the inspection result for each topic, as shown in Fig. 9. Regarding topics 2, 5, and 14, it can be confirmed that despite the relatively large number of documents with more than 30 sentences, there are variations among the inspection companies, and the inspection results are specific, depending on the inspection company. Returning to the text of the analysis of bridges where the probability of belonging to these topics is high, topic 2 documents often contain the sentence, “Confirm the progress of damage and examines of the necessity of repair,” and topic 14 documents often contain the sentence, “damage can be confirmed (damage state: XX).” From this, it is considered that the characteristic description method by the inspection company was formed as a topic.

Inspection company of each topic.
Next, the analysis focuses on the damage caused by ASR, which is a problem in the Hokuriku region. Table 1 shows the percentage of topics that contain the word “ASR” in the remarks column for each topic. Topic 13 has a high proportion of “ASR” among the topics with many sentences where ASR damage is confirmed; however, it can be seen that ASR damage is also confirmed in sentences where other topics are dominant. Topics 12, 26, and 29, which contain relatively many sentences containing “ASR,” have the highest appearance probability (Fig. 6). Probable words having the highest appearance probability, are “deteriorated” and “require repairs,” and the probability of belonging to a topic different from ASR is increased.

Figure 10 shows the probability distribution of topic 13, depending on the presence or absence of the word “ASR” in the original document. For sentences that do not include the word “ASR,” the probability of belonging to topic 13 is low, but for sentences that include “ASR,” the probability distribution of topic 13 is high, and topic 13 can be reconfirmed as an ASR-related topic. In addition, if we check sentences that do not contain the word “ASR” but have a high probability of belonging to topic 13 (γ ≥ 0.05), 5 out of 18 sentences having ASR-related descriptions such as “Suspicious Al bones” were confirmed. In addition, even if a sentence does not include direct words such as ASR and Al bone, the description is confirmed when the ASR is damaged (statements like “cracked cracks” and “free lime” indicated that follow-up was necessary). It was confirmed that even for bridges where the word “ASR” is not included in the text, the probability of belonging to topic 13 is high; a description of the damage state in which ASR is suspected is included in the findings column. Thus, by focusing on a specific topic, it is possible to extract bridges with ASR-related damage even if the expression method is slightly different, and to correlate it with early detection of potential damage. Topic modeling can estimate hidden words in a document relating to a particular topic. For example, a description of the bridge, such as damage state, has a high probability of belonging to topic 13, and even if it is not currently determined to have ASR damage, it may lead to suspected ASR symptoms in the future.

Comparison of gamma distribution of topic 13 considered as ASR topic.
Topic modeling was used to extract the characteristic topics related to the damage state of bridges based on the descriptive evaluation by experts. Bridges with 5, 12, 24, 27, and 29 as the main topics tend to have low health levels, and each of these topics has a high occurrence rate of words that indicate the state of deterioration. It was implied that focusing on these topics could support the proactive maintenance of bridges with advanced degradation. The analysis results showed that bridges with characteristic damage, for example, topic 13 related to ASR, could be extracted. In addition, even if the damage shows similar words that express ASR, it may be possible to extract bridges with similar damage patterns even with variations in the expression due to the frequency of other words, thereby confirming the damage situation. However, it is implied that specific topics, such as topics 6 and 26, might have been formed depending on the characteristic manner in which the findings were recorded by the company experts. There are no specific criteria for writing the findings of the inspection results. Since the administrators’ cognition of the current state of bridges differs depending on how the findings are recorded, and not only the contents, the documents may affect the decisions regarding the operation of the bridges. Therefore, it is required to consider the manner in which the findings were written along with the quantitative evaluation items.
This work was supported by the Council for Science, Technology and Innovation, “Cross-ministerial Strategic Innovation Promotion Program (SIP), Infrastructure Maintenance, Renovation, and Management” (funding agency: JST). In addition, we express gratitude to the agencies for providing the bridge inspection results.