Abstract
The distribution of precipitation microstructures in the interdiffusion layer of Al/Al–Zn alloy/Al model multilayer was examined using microbeam small-angle X-ray scattering (SAXS) measurements. The change of scattering profiles across the graded interfacial layers reflected the spatial change in the volume fraction, average size, and size distribution in the sample. Microstructural parameters obtained from the SAXS analysis explained the hardness change in the interface area. The present results suggest that small-angle scattering analysis using a scanning microbeam is a useful tool to examine the microstructural distribution and predict the properties of the interface region in multilayer composite sheets, in particular, the microstructure and properties of transient interfacial layers.
1. Introduction
Composite materials are widely used in practice, for example, vehicle and aerospace manufacturing, to satisfy required properties that are hard to be compatible (be satisfied at the same time) by a single material. Multilayered composite materials are one of the prospective structures.
However, during the fabrication of composite materials which have multilayered structure, an interdiffusion layer is often formed spontaneously at interface area, regardless of whether it is intended or not. Within this layer, solute composition distributes with location of specimen, inducing a microstructure distribution, resulting in distribution of properties within the sheet materials. Understanding the relationship of metallic composition, structure and strength in this interdiffusion layer will have a wide range of applications various welding processes.1,2)
Age-hardenable Al alloys have been used for light-weight structure materials, and designing multilayered alloy structures may be an attractive candidate for advanced materials. From this view point, multilayered Al–Zn–Mg alloy composite with its interdiffusion layers has been proposed and investigated by Sato et al.,3) focusing on designing high-strength sheets. In the present work, we are aiming to examine more detailed analysis on nanostructures in interdiffusion layer in a multilayered composite, whose width is several hundred micrometers. For simplicity, we used the layered composite of Al–14.07 wt% (6 at%) Zn alloy and pure Al as a model. The Zn concentration of approximately 6 at% has been intensively studied as a model system for isothermal phase decomposition by multiple authors.3–12)
2. Sample Preparation
2.1 Sample structure
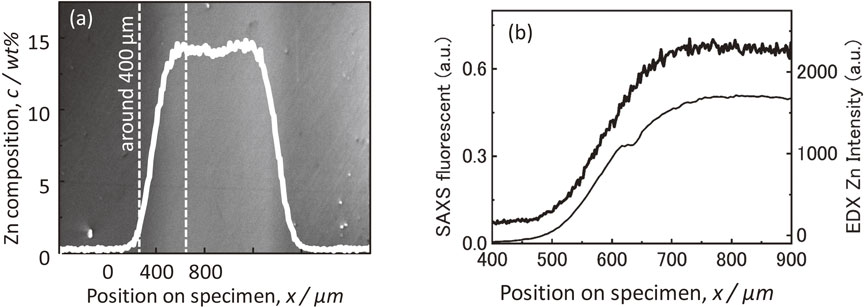
A three-layered sandwich composite with pure Al and an Al–Zn alloy was studied. Table 1 shows the detailed chemical compositions of these layers with minor additions of Zr to control grain structure. As shown in Fig. 1(a), the top and bottom layer corresponds to pure Al, and the middle layer corresponds to Al–14.07 wt% Zn alloy. All layers have a uniform thickness. The production process is described below. Al and Al–Zn alloy ingots were homogenized at 500°C and 450°C for 14.4 ks and air cooled. Then, both were hot rolled into 2.5 mm at 400°C and cold rolled into a thickness of 2.0 mm. Finally, the cladding process was applied using hot rolling, which started at 300°C, rolled down to the thickness of 3 mm thickness in total (approximately 1 mm for each layer). Before cladding, the attaching surfaces were polished with wire brush to remove oxides.
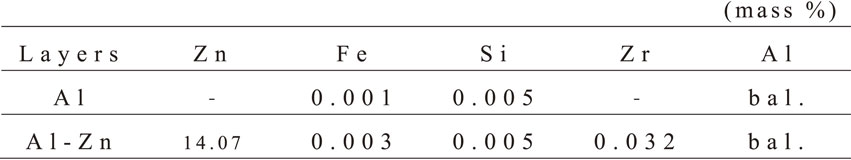
Table 1 Chemical compositions of the layers.
To conduct a detailed survey on the inhomogeneous distributions of the constituent elements on the composite, additional heat treatment at 500°C was conducted at approximately 14.4 ks for the composite to proceed with the interdiffusion. After this heat treatment, the specimen was cut along the cross-section with a 1 mm thickness and solution treated at 325°C and 350°C for 5 min, followed by fast water quenching. Artificial aging treatment at 40°C for 14.4 ks was also performed for precipitation.
Solid solution temperature was chosen within the range that is used by proceeding works,10,11) and made sure not too high that vacancy strongly affect the Zn precipitation consumed during quenching process.
Because Zn has a relatively high vapor pressure, specimen was thinned down with mechanical polish on RD direction, from 1 mm to 0.2 mm to remove surface layer to avoid possible Zn depleted layer.
3. Experiment Procedure
SAXS was conducted at BL 40XU in Super Photon ring-8 GeV (SPring-8) in Hyogo prefecture, Japan. A high flux X-ray of 5 µm in diameter and 15 keV in energy was used as incident beam. Beam was shaped with double pin hole system, with 5 µm in diameter for the first defining pin hole. The Scanning process was conducted by changing the irradiation position of the X-ray on a specimen by 5 µm after every measurement in the interdiffusion direction. The scattered X-ray intensity within small angle was detected using a Pilatus 100 K device, which has a detection area of 83.8 × 33.5 mm2, with a pixel size of 172 × 172 µm2. Camera length between Pilatus and specimen was 950 mm. The incident and transmitted X-ray was measured by ion chamber and photo diode, respectively. In addition, Zn–K radiation was detected at the transmitted X-ray side using a silicon drift detector (SDD) simultaneously, as shown in Fig. 2.

A Vickers hardness test has been performed to measure the local hardness distribution around the interdiffusion area on the specimen using micro Vickers hardness testing machine. A test with force of 10 g under 10 s holding was applied for 40 cycles to a specimen which was heat treated the same way with the one measured with scanning-SAXS. Indentations were maintained at intervals of 54 µm.
4. Results and Discussion
4.1 Solute concentration distribution
Energy dispersive X-ray spectrometry (EDX) was applied before the SAXS measurement with an electron probe micro analyzer (EPMA) to evaluate the Zn concentration distribution of the specimens, and it was confirmed that the interdiffusion layer is approximately 400 µm wide, as shown in Fig. 3. Since the interdiffusion treatment temperature of 500°C is higher than the miscibility gap for the present Zn concentration range of the samples, i.e., lower than 6 at%, the sample remains a solid solution during the interdiffusion treatment. As a result, the Zn distribution in an interdiffusion layer well described by a single error function.
During aging at 313 K, G.P. Zones formed under metastable miscibility gap as shown in Fig. 1(b), whose metastable volume fraction Vf(x) and average size R(x) strongly depend on the composition at each point, x.
4.2 SAXS result
4.2.1 Two-dimensional scattered profile
Figure 4 shows a series of detected SAXS two-dimensional profiles from 325°C solution treatment composite specimen. It is known that Al–Zn alloys around this composition precipitate spherical G.P. Zone initially,4,9,10) and patterns can be seen simultaneously with the reported G.P. Zone induced scattered pattern. Before and after 610∼625 µm, we can find the patterns. However, as shown at a position of 605 µm∼630 µm, the 2-fold symmetric patter, which can also be confirmed by isotropic additional ellipsoid shaped intensive pattern and 4-fold symmetric pattern changes, indicating that the interfering directions of G.P. Zones alter with positions on the specimen. Thus, we can determine that the directions of matrix alter in these positions, meaning we detected two different grains, and so there is a grain boundary around the strong ellipsoidal pattern. Moreover, this ellipsoidal pattern can only be observed where the interface of the Al/Al–Zn alloy is located, and the elongation direction is the same as the diffusion direction. Above all, it is natural for the ellipsoidal scattered patterns to be sandwiched by easily oxidized Al alloys, which may come from the aluminum oxides.

It is well known that scattered intensity I is proportional to Δρ, the electron density difference between scatterer and matrix, and as shown in 4.1, phase separations at regarded concentration are the same, indicating the validity of comparing different scattered profiles with different concentrations.
As in the work by Hennion et al.,9) the scattered intensity was regulated based on the radial average and incident X-ray beam intensity. The integrated intensity Q was calculated using
| \begin{equation}
Q=\int_{0}^{\infty} q^{2}I(q)\,dq = 2\pi^{2}\varDelta \rho^{2}V
\end{equation}
| (1) |
where
q is the magnitude of scattered vector,
V is the precipitation volume. Appreciable amount of the G.P. Zones was detected at 5.17 wt%, which is slightly higher than 4.71%.
14)
Guinier’s radium was calculated in every detected scattered profile, using the well-known Guinier’s plot. Figure 5(a) shows the results of the distribution analysis. The results differ from the classical nucleation theory, where the critical radius decreases with an increase in concentration. This result was reported by H. Okuda et al.,10) demonstrated its reason in grain growth speed difference.
In addition, J.H. Letcher and P.W. Schmidt16) showed the distribution of the diameters in non-interacting assemblies of spherical particles, which can be derived using functions below:
| \begin{equation}
\rho (r) = \frac{1}{\pi^{3}\delta^{2}r^{2}} \int_{0}^{\infty} dq[q^{4}F^{2}(q) - C]\alpha (qr)
\end{equation}
| (2) |
| \begin{align*}
&\text{where}\\
&\quad\alpha (qr) = \left[\mathit{cos}\,qr\left(1 - \frac{8}{q^{2}r^{2}} \right) - \frac{4\,\mathit{sin}\,qr}{qr}\left(1 - \frac{2}{q^{2}r^{2}} \right) \right],\\
&\quad C = \mathit{lim}_{q \to \infty}q^{4}F^{2}(q)
\end{align*}
|
In here, F(q) is scattered wave function. Figure 5(b) shows the size distribution of each point on the specimen. As the Zn concentration increases, the change in the size distribution can be set into two parts:
-
1.
Peak position of distribution shift into the large radius direction with a summit lower in height, and
-
2.
Distributions keep the same shape, but the amplitude increase
The integrated intensity in Fig. 5(a) shows that no precipitates are found for x < 600 µm. Still, hardness shown in Fig. 6 shows a slight increase with Zn concentration. This can be attributed to solid solution strengthening.
For x > 600 µm the integrated intensity in Fig. 5(a) increases appreciably, corresponding to the increase in the precipitates.
Hence, the hardness detected for x > 600 µm can be regarded as the sum of solid strengthening and precipitation strengthening. Also, phase separates in to a uniformed concentration of G.P. Zone and matrix, meaning hardness induced by solid solution stays constantly, with a value of HV right before precipitation.
The precipitation strengthening mechanism17) shifts from a cut-through mechanism to an Orowan mechanism depending on the stress required for deformation. This can be determined respectively using
| \begin{equation}
\tau \approx 3\mu | \varepsilon |^{\frac{2}{3}}\sqrt{\frac{RV_{f}}{b}} \propto \sqrt{RV_{f}}
\end{equation}
| (3) |
| \begin{equation}
\text{and}\quad \tau = \frac{0.8}{bR}\sqrt{\frac{3V_{f}}{2\pi}} \propto \frac{1}{R}\sqrt{V_{f}}
\end{equation}
| (4) |
where τ is critical resolved shear stress, CRSS, ε is the lattice constant difference between precipitation and matrix, μ is the shear modulus,
R and
Vf are average radius and volume fraction of precipitations.
For small Vf, Vf is approximated to13)
| \begin{equation}
V_{f} = \frac{Q}{2\pi^{2}\Delta \rho^{2}}
\end{equation}
| (5) |
i.e.,
Q ∝
Vf. Where
Q was defined in 4.2.2. Considering SAXS has been conducted on specimen every 5 µm, this can be rewritten as a function of position on specimen
Q(
x) ∝
Vf within concerned precipitation area with uniformed thickness and electron density difference.
Guinier radius is also evaluated as a function of position on specimen Rg(x), and is identical to radius of gyration. In every SAXS measuring, detected Rg(x) is an averaged value by all illuminated precipitations. Vf and R can be replaced with Q(x) and Rg(x) within concerned, precipitated area.
Figure 6 shows the change of the Vicker’s hardness with the position, x, change of the strength expected from the two mechanisms described as a function of Vf and Rg in eq. (3) and (4), i.e., are also shown in the figure. Expected strength from the Orowan mechanism shows a significant deviation from the hardness, whereas that from the cut-through mechanism agreed with the experimental results. ΔHss corresponds to the solid solution strengthening by the Zn atoms at solubility limit, served as an offset for the precipitation hardening. This indicates that the cut through mechanism has the same tendency as the actual local hardness, meaning the regarded multilayered material strengthens with the cut-through mechanism.
In a conventional investigation, Vf is a constant and τ changes with the change of R. In this study, alloys in different sample positions have different compositions but separate into the same matrix and precipitation, i.e., having the same structure. Hence, we can expect that μ, b, ε in eqs. (3) and (4) are the same over the present sample, making it applicable for the comparing structures with different volume fractions and radii.
5. Conclusion
Simultaneous scanning using micro small-angle X-ray scattering and fluorescence measurement were applied to investigate the distributions of precipitated nano-structures in the interdiffusion region in multilayered Al alloy materials.
The changes in volume fraction and size distribution of the G.P. Zones in the interdiffusion region were evaluated. This can also be linked with and explain local hardness in the same area. Thus, a continuous microstructure was investigated in a nondestructive manner. In other words, this study made possible an evaluation of the strengthening mechanism with the span that occurs industrially due to structural distribution.
Acknowledgments
This research is based on the results obtained from a project commissioned by the New Energy and Industrial Technology Development Organization (NEDO). The synchrotron radiation experiments were performed at the BL40XU of Spring-8 with the approval of the Japan Synchrotron Radiation Research Institute (JASRI) (Proposal No. 2016A1168, 2016B1275, 2016B1282, 2017B1570).
REFERENCES
- 1) F. De Geuser, B. Malad and A. Deschamps: Philos. Mag. 94 (2014) 1451–1462.
- 2) H. Okuda, I. Murase, R. Kurosaki, E. Nakagawa, S. Ochiai, Y. Yokoyama, J. Saida and K. Inoue: Intermetallics 14 (2006) 1038–1042.
- 3) K. Sato, K. Matsumoto and H. Okuda: Mater. Trans. 60 (2019) 254–262.
- 4) V. Gerold: Phys. Status Solidi B 1 (1961) 37–49.
- 5) M. Murakami, M. Morinaga, O. Kawano and Y. Murakami: Trans. JIM 11 (1970) 318–323.
- 6) G. Laslaz, G. Kostorz, M. Roth, P. Guyot and R.J. Stewart: Phys. Status Solidi A 41 (1977) 577–583.
- 7) A. Naudon and J. Allain: Scr. Metall. 8 (1974) 1105–1111.
- 8) G. Laslaz and P. Guyot: Acta Metall. 25 (1977) 277–285.
- 9) M. Hennion, D. Ronzaud and P. Guyot: Acta Metall. 30 (1982) 599–610.
- 10) K. Osamura, K. Okuda, H. Hashizume and Y. Amemiya: Acta Metall. 33 (1985) 2199–2203.
- 11) H. Okuda and K. Osamura: J. Japan Inst. Metals. 49 (1985) 825–831.
- 12) E. Bubeck, V. Gerold and G. Kostorz: Cryst. Res. Technol. 20 (1985) 97–103.
- 13) A. Guinier and G. Fournet: Small Angle Scattering of X-Rays (John Wiley & Sons, Inc., New York, 1955).
- 14) S. Popović, B. Gržeta, V. Ilakovac, R. Kroggel, G. Wendrock and H. Löffer: Phys. Status Solidi A 130 (1992) 273–292.
- 15) H. Löffer: Structure and Structure Development of Al–Zn Alloys, (Akademie Verlag GmbH, Berlin, 1995) pp. 217.
- 16) J.H. Letcher and P.W. Schmidt: J. Appl. Phys. 37 (1966) 649–655.
- 17) V. Gerold and H. Haberkorn: Phys. Status Solidi B 16 (1966) 675–684.