Abstract
An accumulative roll bonding process was applied up to 8 cycles on high-purity aluminum, aluminum–0.02 mass%iron and aluminum–0.2 mass%iron in order to measure electrical properties in addition to the mechanical properties. Ultimate tensile strength increases about 3–5 times compared with that of coarse grain metals, whereas, the electrical conductivity at room temperature decreases about a few %IACS. The dislocation density and density of grain boundary were evaluated from XRD and SEM/EBSD measurements. The microstructure change in those parameters explains the change in electrical resistivity measured at 77 K.
1. Introduction
Severe plastic deformation (SPD) process has been used to fabricate ultrafine-grained (UFG) metals for decades.1) An accumulative roll bonding (ARB) process is one of the SPD processes,1–3) which has been used for fabricating higher strength UFG metals compared with coarse-grained (CG) metals. Lately, it was found that ARB processed AA1100 aluminum (Al) of which purity is 99% (commercial-purity aluminum) exhibits both a few times higher strength and slightly higher electrical resistivity ρ measured at room temperature (RT) compared with CG commercial-purity aluminum.4) When ρ at RT is converted to electrical conductivity in %IACS which was the abbreviation of international annealed copper standard, the reduction was about 2.5%IACS. It implies that the SPD process including the ARB process is an effective method to fabricate metals having both high strength and high electrical conductivity.
When the electrical property of low concentration alloy was discussed, Matthiessen’s rule was used,4–6) and, ρ is described as the summation of each contribution, such as, lattice vibration, impurities and lattice defects. Since those factors work as scattering centers of free electrons in alloys, increasing the contribution of such factors reduces the mean free path of free electrons. Consequently, electrical properties, such as ρ and electrical conductivity are changed.
The contribution of lattice defects, such as dislocation density LV [m−2] and density of grain boundary (GB) SV [m−1], against ρ was reported.6) Here, the subscript V denotes per unit volume. However, it has not been revealed yet what is the best alloying element in terms of fabricating high strength and high electrical conductivity metals by the SPD process. In other words, what is the best alloying elements which enhance grain refinement during the SPD processes and maintain high electrical conductivity?
In this study, iron (Fe) was selected as an alloying element for aluminum since its solubility limit is low, about 0.02 mass% (0.01 at%) as maximum,7) and therefore, the solute iron atoms may affect against electrical conductivity less than the other alloying elements having higher solubility limit such as silicon and magnesium which are normally used as alloying elements in conventional aluminum-alloy strengthened by solid solution strengthening and precipitation strengthening. Furthermore, iron is normally introduced during recycling of aluminum and it is also difficult to remove.8) If aluminum–iron alloy can be used as a new aluminum alloy for high strength and high conductive subjecting to SPD process, it may be effective from environmental point of view, since wire drawing can also be treated as the SPD process.
2. Experimental Procedures
Three types of specimen; high-purity aluminum (purity more than 99.9 mass%), aluminum–0.02 mass% iron alloy (Al–0.02Fe) and aluminum–0.2 mass% iron alloy (Al–0.2Fe) of which chemical composition is shown in Table 1, were subjected for this study. High-purity aluminum sheets with the thickness of 2 mm were annealed at 673 K for 7.2 ks by an electric furnace in ambient atmosphere. Ingots of Al–0.02Fe and Al–0.2Fe alloys were homogenized at 923 K for 86.4 ks by the electric furnace in ambient atmosphere, and then, water quenched, and then, cold rolled down to the thickness of 2 mm. The sheets were again annealed at 923 K for 3.6 ks by the electric furnace in ambient atmosphere, and then, water quenched.

Table 1 Chemical composition of high-purity aluminum, Al–0.02Fe and Al–0.2Fe.
Three types of 2 mm thick sheets were applied an accumulative roll bonding (ARB) process with lubrication up to 8 cycles. Although the detail of the ARB process and its lubrication condition can be found elsewhere,2,3,9) the concept of the ARB process is shortly described here. The ARB process consists of four steps; (1) cutting a sheet into two pieces, (2) surface treatment of the sheets using acetone and wire-brushing, (3) stacking the two sheet as the treated surfaces faced each other and (4) roll-bonding with the rolling reduction of 50% by one pass and water quenched to reduce the effect of processing heat. When the surface is lubricated by machine oil, it is called the ARB with lubrication, and, the friction between the surface of the sheet and rolls are reduced. Hereafter, the specimen applied the ARB process with N cycles are denoted as ARB Nc. It is noted that the annealed specimen was treated as ARB 0c, and the first ARB cycle was only 50% rolling reduction since the initial thickness was 2 mm. After the 1st cycle of the ARB process, the thickness of the sheets was maintained to be about 1 mm. The sample coordinates were defined as rolling direction (RD), normal direction (ND) and transverse direction (TD).
Contamination always occurs during the ARB process since the stacked surface is always folded into the sheet, even the special care is taken, e.g. surface oxide layer is unavoidable. However, as ARB processed sheets were not annealed in the present study, thus, diffusion is difficult to occur. Therefore, the contamination is localized like thin layers, and, the contribution of contamination on electrical properties is possible to ignore since the volume fraction of such contamination layers are small compared with the non-contaminated matrix.
Tensile tests were carried out for the ARB processed specimens with the initial strain rate of 1.0 × 10⁻³ s−1. The gage length and width were 10 mm and 3 mm, respectively. Electron backscattering diffraction (EBSD) was carried out using OIM data collection ver. 7 (TSL) on both TD and RD sections in a field emission-type scanning electron microscope (FE-SEM, JSM-7001F, JEOL). The specimens for the EBSD measurements were cut from the sheets by an arc discharge wire cutting machine. The surface damaged layer by the arc discharge was removed by SiC paper, and, finished by electrolytic etching using 33% nital, mixture of nitric acid and methanol by volume of 1:2, at 233 K with the applied voltage of 13–14 V. From the EBSD data, GB maps and high angle grain boundary (HAGB) maps were constructed using OIM data analysis ver. 7 (TLS). HAGB is GB having misorientation angle more than 15 degrees. The GB having misorientation angle between 2 and 15 degrees were treated as low angle grain boundary (LAGB) in this study. It is noted that GB having misorientation angle less than 2 degrees were ignored due to the measurement condition. The mean separation of GB dGB and HAGB dHAGB were evaluated from the GB and HAGB maps, respectively. The mean separation of GB and HAGB were evaluated along ND, RD and TD, and, denoted as subscript. $d_{\text{ND}}^{\text{GB}}$ and $d_{\text{ND}}^{\text{HAGB}}$ were evaluated using sectioning method, whereas $d_{\text{RD}}^{\text{GB}}$ $d_{\text{TD}}^{\text{GB}}$ $d_{\text{RD}}^{\text{HAGB}}$ and $d_{\text{TD}}^{\text{HAGB}}$ were evaluated as the average of actually measured 200 grains. Electrical resistance measurements were performed using four terminal method using a current source 6220 and nanovoltmeter 2182A (Keithley) with delta-mode, which changes the polarity of current regularly in order to remove the thermopower occurred at different metal contacts in the circuit. The passing current was set to be 100 mA and the measurement temperature was 77 K (in liquid nitrogen) and 293 K (RT). ρ was converted from electrical resistance using the size of a bar-like shape specimen of which cross sectional area is about 1 mm2 and the length is about 50 mm. The thickness and width of the specimen were measured using a digital micrometer and the length was measured by a reading microscope. X-ray diffraction (XRD) was performed using SmartLab (Rigaku) with Cu tube of which voltage of 45 kV and current of 200 mA, step of 0.01° and scan time of 0.05 s.
3. Results and Discussion
Figure 1 shows change in (a) 0.2% proof stress, σ0.2, and (b) ultimate tensile strength (UTS) σUTS of ARB processed high-purity aluminum, Al–0.02Fe and Al–0.2Fe depending on N. The initial value of σ0.2 are about 20 MPa for all specimens, and, all the specimen drastically increases σ0.2 to be about 90 MPa after the 1st ARB process. All the specimen slightly increases σ0.2 with increasing N up to 4c, and then, the increase of σ0.2 seems saturate. The value of σ0.2 is about 130 MPa, about 140 MPa and about 150 MPa for high-purity aluminum, Al–0.02Fe and Al–0.2Fe, respectively. UTS of the specimens show similar trend of σ0.2. The initial value of σUTS of ARB 0c is about 30 MPa for high-purity aluminum, and, about 45 MPa for aluminum–iron alloys. It can be seen that σUTS of all samples almost linearly increases up to ARB 2c of which values are between 120 MPa and 130 MPa. Then the increase in σUTS becomes gradual with increasing N, and then, it saturates after ARB 4c. The value of σUTS at the saturation region is about 135 MPa, about 150 MPa and about 160 MPa for high-purity aluminum, Al–0.02Fe and Al–0.2Fe, respectively.

Figure 2 shows change in mean boundary separation of GB and HAGB along (a) ND, (b) TD and (c) RD depending N. The initial grain (ARB 0c) of Al–0.02Fe is the order of the thickness of the sheets (2 mm), and the others are approximately 100 µm. It can be seen that dGB and dHAGB along all directions drastically decreases with increasing N = 3. It is clear that decrease in dGB and dHAGB saturate after N = 4 for all directions. It can be also seen that $d_{\text{ND}}^{\text{GB}}$ and $d_{\text{ND}}^{\text{HAGB}}$ are always smaller than $d_{\text{TD}}^{\text{GB}}$, $d_{\text{RD}}^{\text{GB}}$, $d_{\text{TD}}^{\text{HAGB}}$ and $d_{\text{RD}}^{\text{HAGB}}$ at the saturation region, since the ARB process uses the roll bonding. The difference of iron concentration seems to have no effect on $d_{\text{ND}}^{\text{GB}}$, whereas it seems to affect the others. In other words, $d_{\text{TD}}^{\text{GB}}$, $d_{\text{RD}}^{\text{GB}}$, $d_{\text{TD}}^{\text{HAGB}}$ and $d_{\text{RD}}^{\text{HAGB}}$ of Al–0.2Fe clearly become smallest compared with those of high-purity aluminum and Al–0.02Fe. It should be noted that dGB for ARB 1c was difficult to evaluate since high density of LAGB was introduced and difficult to recognize LAGB on the GB maps.

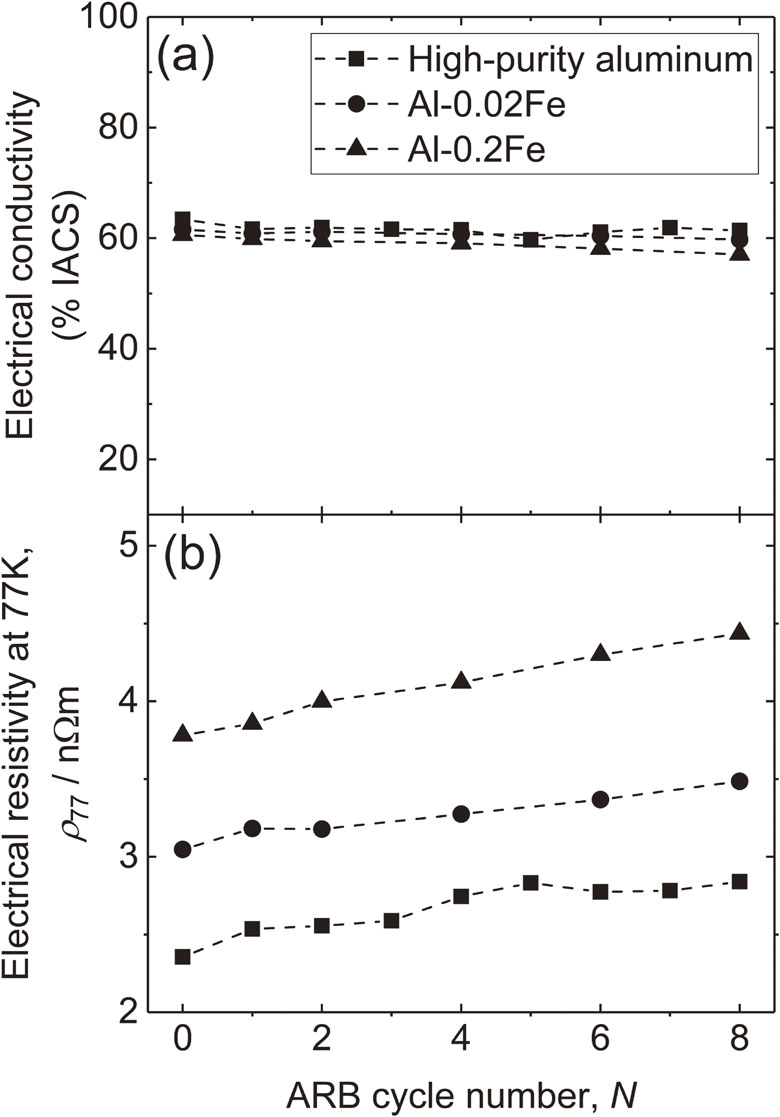
Figure 3 shows (a) electrical conductivity (IACS%) at RT and (b) ρ at 77 K, ρ77, of the ARB processed high-purity aluminum, Al–0.02Fe and Al–0.2Fe depending on N. As can be seen from the figure, electrical conductivity at RT are almost constant at round 60% with increasing N. Strictly speaking, %IACS of high-purity aluminum decreases from about 63.4 down to about 61.4, that of Al–0.02Fe decreases from about 61.6 down to about 59.7, and that of Al–0.2Fe decreases from about 60.6 down to about 57.0. The reduction is comparable with the reported commercial-purity aluminum value.4) It is much easier to maintain temperature to be constant in liquid nitrogen than room temperature, and therefore, signal noise ratio of ρ77 is better than ρ measured at RT, ρ293. Thus, ρ77 is more suitable for the analysis about microstructure. From Fig. 3, the almost linear increase in ρ77 with increasing N can be seen on all specimens. It is also noted that increasing the concentration of iron results in the increasing ρ77 at each N. In the case of high-purity aluminum, ρ77 increases from about 2.36 nΩm up to about 2.84 with increasing N from 0 to 8. Similarly, ρ77 increases from about 3.05 nΩm up to about 3.49 in the case of Al–0.02Fe, and, ρ77 increases from about 3.78 nΩm up to about 4.44 in the case of Al–0.2Fe.

From the XRD peaks, dislocation density LV was evaluated using Williamson-Hall method.10,11) Lattice strain ε was obtained from the gradient of Williamson-Hall plot of which vertical axis is (Δ2θ cos θ)/λ and horizontal axis is sin θ/λ. Here, Δ2θ is full width half maximum of an XRD peak, θ is the Bragg angle and λ is the wavelength of X-ray. It is known that ε can be converted to be LV using following equation.12)
| \begin{equation}
L_{\text{V}} = \frac{16.1 \varepsilon^{2}}{b^{2}}
\end{equation}
| (1) |
Here,
b is the magnitude of Burgers vector.
Using above procedure, N dependence of LV was evaluated as seen in Fig. 4. It is noted that the data for high-purity aluminum is taken from the literature13) for the comparison. It is seen that LV drastically increases after the first ARB process, from the beginning of 1011 m−2 to about the end of 1012 m−2 in the case of high-purity aluminum, from about 1 × 10¹² m−2 to about the middle of 1013 m−2 in the case of Al–0.02Fe, and, from the middle of 1012 m−2 to about 1 × 10¹⁴ m−2 in the case of Al–0.2Fe. Then, LV of high-purity aluminum gradually decreases down to about 1 × 10¹² m−2 with increasing N.

It was also reported that LV of ECAP processed high-purity aluminum with another analysis method with XRD, by Murata et al.14) LV also increases rapidly after the first ECAP, and then, starts decreasing. It can be associated with the dynamic recovery during the ARB process, since the stacking fault energy of aluminum is higher than the other elements. Furthermore, dynamic recovery occurs in the high-purity aluminum easier than Al–0.02Fe and Al–0.2Fe due to the low concentration of impurity which pin dislocations and prevent the dynamic recovery during the ARB process.
Whereas, LV of aluminum–iron alloy seems to be about 1 × 10¹⁴ m−2 that is independent from N. Since the initial grain size is quite large, LV of ARB 0c is less reliable compared with ARB processed specimens. However, LV of the initial annealed specimen seems to be affected by the iron concentration.
In order to understand the change in electrical properties and microstructure, estimation of ρ77 based on the microstructural parameter is performed following the procedure in literature.4,6) ρ of alloy measured at T [K], ρT, can be described below.
| \begin{equation}
\left.
\begin{array}{c}
\rho_{\text{T}} = \rho_{\text{T}}^{\text{alloy}} + \Delta \rho^{\text{vac}} \cdot N_{\text{V}} + \Delta \rho^{\text{disl.}} \cdot L_{\text{V}} + \Delta \rho^{\text{GB}} \cdot S_{\text{V}}\\
\rho_{\text{T}}^{\text{alloy}} = \rho_{\text{T}}^{\text{pure}} + \displaystyle\sum_{i}^{n} \Delta \rho^{\text{i}} \cdot C^{i}
\end{array}
\right\}
\end{equation}
| (2) |
Here, $\rho _{\text{T}}^{\text{alloy}}$ [Ωm] is the resistivity of a single-crystalline alloy, Δρvac [Ω/at.fraction], Δρdisl. [Ωm], ΔρGB [Ωm2] are the contribution of vacancy, dislocation, GB against ρ. These coefficient is considered to have no temperature dependence, and therefore, the subscript T is taken from the equation in the literature.6) NV is vacancy concentration, and, Δρi [Ωm/mass%] and Ci [mass%] are contribution of i-th solute atom against ρ and concentration of i-th solute atom, respectively. It is noted that Δρi is also thought not to have temperature dependence.
From the change in LV and d, it can be said that the grain subdivision occurs during the ARB process in each specimen as reported before.15,16) It is also pointed out that the slopes of the three curves in Fig. 3(b) is more or less the same. Thus, microstructural changes in aluminum–iron alloys are similar to that in high-purity aluminum during the ARB process. In such a case, grain-subdivision is considered to be the main reason to change ρ77. In other words, concentration of iron in aluminum–iron alloys is constant during the ARB process.
Then, $\rho _{\text{T}}^{\text{alloy}}$ in eq. (2) can be treated as constant between before and after the ARB process. Furthermore, it was reported that NV can be treated as constant between before and after the ARB process.4) Thus, eq. (2) can be modified as follows.
| \begin{equation}
\left.
\begin{array}{c}
\delta \rho_{\text{T}} = \Delta \rho^{\text{disl.}} \cdot \delta L_{\text{V}} + \Delta \rho^{\text{GB}} \cdot \delta S_{\text{V}}\\
\rho_{\text{T}}^{\text{alloy}} = \text{constant}
\end{array}
\right\}
\end{equation}
| (3) |
Here, δρ
T, δ
LV and δ
SV are change in ρ
T,
LV and
SV between before and after the ARB process. From XRD,
LV was evaluated for all specimens, and therefore,
SV is requested to evaluate from
d.
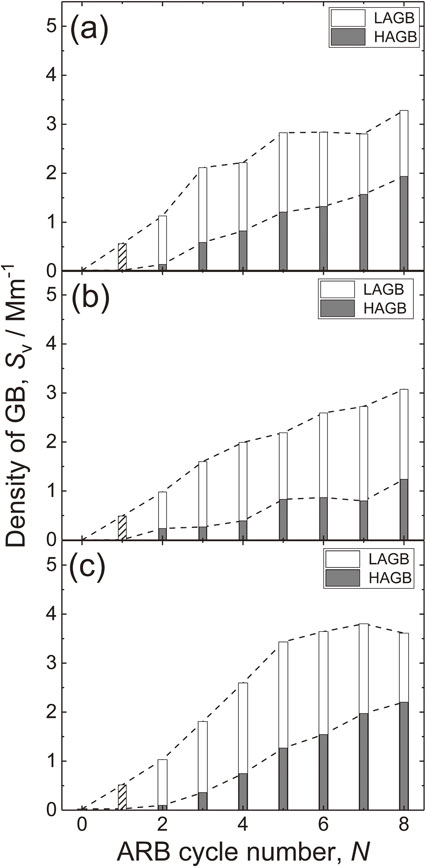
Figure 5 shows change in SV of ARB processed (a) high-purity aluminum, (b) Al–0.02Fe and (c) Al–0.2Fe depending on N. Here, SV is estimated with assuming that the shape of grains are rectangular like in the literature.4,6) All specimen initially increases SV and then the increase saturates after ARB 4c. The value of SV in saturation region is about 2.5 Mm−1 for high-purity aluminum and Al–0.02Fe. The ratio of HAGB of Al–0.02Fe seems less than high-purity aluminum, which may be attributed that the impurity of high-purity aluminum is similar to Al–0.02Fe, but, the contained number of the elements are different. Nevertheless, Al–0.2Fe shows higher SV in saturation region about 3.5 Mm−1. The fraction of HAGB in Al–0.2Fe seems higher than that in Al–0.02Fe, which indicate increasing the concentration of Fe results in higher fraction of HAGB and higher SV.
Using SV and LV, it is possible to estimate ρ77 with increasing N as shown in Fig. 6. Table 2 shows the value of Δρdisl. and ΔρGB used in this study, which are theoretically estimated.17) It is noted that estimated value of ρ77 based on δSV and δLV was added ρ77 of ARB 0c for each specimen, and, expressed as bars. Although the contribution of δSV and δLV were considered, the contribution of δLV is quite small and it may be difficult to recognize in Fig. 6. From Fig. 4, δLV is almost zero after ARB 1c, and the drastic increase in LV occurs at the 1st ARB cycle. However, the main reason of change in ρ77 seems to be δSV for high-purity aluminum and aluminum–iron alloys.

It is pointed out the GB introduced by the SPD process might be different from the conventional GB, and, such GB is called non-equilibrium GB.18) Thus, there is a possibility that GB in the ARB processed sheets are different from conventional GB, and, the contribution of the GB against electrical resistivity is different from that for conventional GB. However, Al sheet can reach about 353 K as maximum due to the processing heat during the ARB process. Thus, the non-equilibrium GB might be changed close to the conventional GB. The processing heat also affect the decreases in LV mentioned above. Anyhow, the theoretically evaluated Δρdisl. and ΔρGB are used in this study.
It must be emphasized that the measurement of LV is generally important since Δρdisl. and ΔρGB are different for each element. Thus, it can occur that the contribution of LV is much higher than SV for some deformation process and heat treatment even in aluminum case.
Nevertheless, the estimated ρ77 agrees with the actually measured ρ77 as shown in Fig. 6, since, the trend and the order of those values are same. Strictly speaking, there are differences between the estimated and actually measured ρ77, which is less than 15%. However, there are many factors which affect the estimation of the ρ77. For instance, we assume rectangular shape as the shape of grains for the estimation of SV, but, actual shape of the grain is different. There is also a possibility the introduced GB by the ARB process might be different from the conventional GB, as discussed above.
Finally, the balance between electrical conductivity (%IACS) versus UTS of high-purity aluminum and aluminum–iron alloys are displayed in Fig. 7. As can be seen, UTS increases about 3–5 times higher than ARB 0c but the reduction of electrical conductivity is only about a few %IACS with increasing N. Thus, SPD process can be a candidate to fabricate metals having both high strength and high electrical conductivity using new composition alloys such as aluminum–iron alloys.
4. Conclusions
The ARB process was applied up to 8 cycle on high-purity aluminum, Al–0.02Fe alloy and Al–0.2Fe alloy, and, mechanical and electrical properties were measured in addition to the microstructure observations. As a result, saturation region appears after ARB 4c, and, 0.2% proof stress of high-purity aluminum, Al–0.02Fe and Al–0.2Fe were about 130 MPa, about 140 MPa and about 150 MPa, respectively. Whereas, UTS of them were about 135 MPa, about 150 MPa and about 160 MPa, respectively. Electrical conductivity of the ARB processed high-purity aluminum, Al–0.02Fe and Al–0.2Fe decreases from about 63.4 down to about 61.4, from about 61.6 down to about 59.7, and from about 60.6 down to about 57.0, respectively. ρ at 77 K increases from about 2.36 nΩm up to about 2.84 for high-purity aluminum, from about 3.05 nΩm up to about 3.49 for Al–0.02Fe, and from about 3.78 nΩm up to about 4.44 for Al–0.2Fe, respectively. Those changes were attributed to the change in both dislocation density and density of GB. As a result, high strength and high electrical conductivity ARB processed aluminum–iron alloy with the iron concentration up to 0.2% could be fabricated. The SPD process can be a fabricating process for high strength and high electrical conductivity alloys.
Acknowledgements
Authors appreciate Prof. Tsuji at Kyoto University for the use of rolling machine. YM would like to thank Prof. Onaka at TI Tech. for discussions. YM also expresses the appreciation for a research grant from The Light Metal Educational foundation Inc. Japan, Aluminum research grant of Japan Aluminum Association, and, Grant-in-Aid for Scientific Research (C) from Japan Society for The Promotion of Science (No. 19K05056).
REFERENCES
- 1) A. Azushima, R. Kopp, A. Korhonen, D.Y. Yang, F. Micari, G.D. Lahoti, P. Groche, J. Yanagimoto, N. Tsuji, A. Rosochowski and A. Yanagida: CIRP Annu.-Manuf. Technol. 57 (2008) 716–735.
- 2) Y. Saito, N. Tsuji, H. Utsunomiya, T. Sakai and R.G. Hong: Scr. Mater. 39 (1998) 1221–1227.
- 3) Y. Saito, H. Utsunomiya, N. Tsuji and T. Sakai: Acta Mater. 47 (1999) 579–583.
- 4) Y. Miyajima, S.Y. Komatsu, M. Mitsuhara, S. Hata, H. Nakashima and N. Tsuji: Philos. Mag. 90 (2010) 4475–4488.
- 5) S. Komatsu: J. JILM 60 (2010) 511–529.
- 6) Y. Miyajima, S. Komatsu, M. Mitsuhara, S. Hata, H. Nakashima and N. Tsuji: Philos. Mag. 95 (2015) 1139–1149.
- 7) M. Nishio, S. Nasu and Y. Murakami: J. Japan Inst. Metals 34 (1970) 1173–1177.
- 8) T. Sato, T. Tani and T. Aoki: J. JILM 68 (2018) 77–78.
- 9) Y. Miyajima, M. Uchiyama, H. Adachi, T. Fujii, S. Onaka and M. Kato: Mater. Trans. 57 (2016) 1411–1417.
- 10) W.H. Hall: Proc. R Soc. London, Ser. A 62 (1949) 741–743.
- 11) G.K. Williamson and W.H. Hall: Acta Metall. Mater. 1 (1953) 22–31.
- 12) G.K. Williamson and R.E. Smallman: Philos. Mag. 1 (1956) 34–46.
- 13) Y. Miyajima, T. Ueda, H. Adachi, T. Fujii, S. Onaka and M. Kato: 6th International Conference on Nanomaterials by Severe Plastic Deformation, (IOP Publishing, Metz, 2014) p. 012138.
- 14) Y. Murata, I. Nakaya and M. Morinaga: Mater. Trans. 49 (2008) 20–23.
- 15) N. Hansen: Metall. Mater. Trans. A 32 (2001) 2917–2935.
- 16) N. Hansen and D.J. Jensen: Philos. Trans. R Soc. London, Ser. A 357 (1999) 1447–1469.
- 17) A.S. Karolik and A.A. Luhvich: J. Phys. Condens. Matter 6 (1994) 873–886.
- 18) R.Z. Valiev: Mater. Trans. 55 (2014) 13–18.