1. Introduction
Because ductile cast iron has a great amount of added silicon, carbides are not easily precipitated during the austempering process. As a result, bainitic ferrite and a large amount of retained austenite are obtained.1,2) Such austempered ductile cast iron is called ADI, and incorporates tough properties due to the strain-induced transformation of the retained austenite.3) However, the untransformed and unstable retained austenite present around eutectic cell boundaries is known to have a negative impact on toughness and machinability,4–7) and for this reason, it is reported that austempering is heat treated from the (α + γ) range after pre-quenching to generate the martensite structure for the purpose of improving the material’s toughness and machinability.8) In the previous report, the tensile properties of ductile cast iron with austempered from the (α + γ) range as the prior structure of fine pearlite9) were investigated. However, while there was a significant difference in the matrix structure depending on whether it was pre-treated or not, the authors were unable to observe any significant differences in mechanical properties. A possible reason for this lack of difference in mechanical properties could be due to the localized strain-induced transformation occurring near the spheroidal graphite, and because the conditions affecting the nodule count of the spheroidal graphite were nearly identical, no major differences were observed. It is for this reason that additional investigation into the effect of spheroidal graphite is considered necessary. Spheroidal graphite has an extremely low bonding strength with the matrix boundary,10) and as it hardly bears the load during tensile deformation,11) it contributes nothing to the improvement in mechanical properties. Rather, because the strength and ductility are degraded compared to steel that contains no spheroidal graphite, graphite spheroids can be considered to act as defects. On the other hand, in the case of retained austenite, strength and ductility are increased by the strain-induced transformation. While both spheroidal graphite and retained austenite have within ADI, the effect of their interaction on the ADI mechanical properties has not been examined.
Therefore, in this study, the authors expected that the spheroidal graphite will act as a defect and investigated how changing its amount would effect the strain-induced transformation of the retained austenite and thus the material’s mechanical properties. Two methods were used to change the nodule count of spheroidal graphite. The first method is that the nodule count is adjusted by changing the solidification speed during casting when crystallization of the spheroidal graphite occurs. The second method is that the amount of added carbon is reduced to decrease the amount of spheroidal graphite being crystallized, which will result in the reduction of the nodule count. The aim was to clear what effect the interaction between the nodule count of spheroidal graphite and retained austenite has on the material mechanical properties.
2. Experimental
2.1 Sample preparation
The samples were melted using a high-frequency induction furnace. To change the nodule count of spheroidal graphite, as shown in Fig. 1, the molten metal was cast into two molds resulting in different solidification speeds. The combination of the chemical composition of the cast samples and the molds used for the casting are shown in Table 1. As shown in Fig. 1 and Table 1, solidification speed of sample No. 2 faster than No. 1 brought about more nodule count. In the case of sample No. 3, the amount of added carbon content was reduced compared to No. 1 to reduce the amount of crystallization of the spheroidal graphite as a way to decrease the nodule count. As a means to stabilize the austenite, Mn, and Cu were added as the alloy elements, and thus No. 1 is made to the same conditions as in the previous report.9) The addition of 1% Mn is the same amount (considered to be high Mn content) used in a prior report.12,13) For this reason, considering the possibility that eutectic cementite may crystallize. Therefore, Cu was added as graphitization promoting element.14) Additionally, in the case of No. 3, because the nodule count would be reduced, the added Mn amount was reduced to 0.7%, as it was presumed that the tendency for Mn to segregate might increase around the final solidification reagion.15)


Table 1 Chemical composition of specimens (mass%).
Figure 2 shows heat treatment condition. Fine pearlite structure was formed after quenching from austenite (823 K soaked for 1 h). Then using the Fe–C phase diagram with 2.4% Si16) as reference, the specimens were heat treated at 1063 K which is (α + γ) range for 3 h, and then were cooled to 623 K and soaked for 3 h before final water quenching.
2.3 Sample evaluation
The samples were polished using emery paper from #150 to 1500 and 2 µm diamond slurry, and each sample was observed using an optical microscope without etching. The spheroidal graphite was evaluated particle size, nodule count, graphite area ratio, and spheroidization rate. Microstructural observation of the specimens which were etched by hydrochloric-picric acid were carried out using SEM. Using the electron backscatter diffraction (EBSD) method, the distribution and size of the α- and γ-phases, as well as the behavior of strain-induced transformation, were analyzed. The mechanical properties were obtained by tensile test. Tensile test specimens were machined from the solidified samples to the shape of No. 4 sub-size as defined by JIS Z 2241 (parallel portion = ϕ6 mm, GL = 30) and tensile tests with a strain rate of 3.0 × 10⁻³ s−1 as defined by ISO 6892-1 were conducted. The specimens used in the tensile tests, and the areas around the grip and fracture sections were collected and X-ray diffraction measurements were conducted using Rigaku Corporation’s SmartLab. For the X-ray diffraction measurements, a Cu-Kα target was used with diffraction angle of 2θ = 30° to 100° as its set condition. The retained austenite was quantified using the five-peak method from the integral strength ratio of α(200), α(211), γ(200), γ(220), and γ(311) determined from the peak X-ray diffraction.17)
3. Experimental Results and Discussion
3.1 Measurement of spheroidal graphite
The results of the optical microscopy of specimens No. 1 to No. 3 are presented in the as-cast condition in Fig. 3. Then based on the optical microscopy results in Fig. 3, the measurement results for the spheroidal graphite particle size, nodule count, graphite area ratio, and spheroidization ratio are listed in Table 2. As shown in Table 2, compared to No. 1, the spheroidal graphite nodule count increased while the spheroidal graphite particle size decreased in No. 2 by the solidification speed was faster. Additionally, as No. 3 has less added carbon compared to No. 1, the former’s graphite particle size changed insignificantly, while the graphite nodule count was reduced and its spheroidal graphite area ratio was reduced to approximately half that of No. 1.

Table 2 Mean diameter of graphite nodule, mean count of graphite nodule, ratio of graphite area, and nodularity of each specimen as cast.
Each of the specimen shown in Table 1 was heat-treated, as shown in Fig. 2. The results from SEM structural observations after heat treatment are shown in Fig. 4. Based on Fig. 4, it was concluded that each specimen achieved the purpose of the matrix structure of ferrite, bainitic ferrite, and retained austenite. Each specimen was then subjected to a tensile test. The results of the tensile tests are shown in Fig. 5. As shown in Fig. 5, 0.2% proof stress of No. 2 is higher than those of No. 1 and No. 3. Because this difference was considered to be due to the difference in the grain size, the matrix structures of No. 1 and No. 2 were analyzed by EBSD. Figure 6 shows the EBSD-IPF map of the α-phase of No. 1 and No. 2. It can be confirmed that the α phase in Fig. 6(b) is smaller than that in Fig. 6(a). The grain has become relatively finer. Based on this, because the solidification speed of No. 2 was faster, the matrix structure became finer as cast. Furthermore, because the spheroidal graphite was finely dispersed, and even after undergoing the heat treatment shown in Fig. 2, the matrix structure remained the finest and the 0.2% proof stress became higher than those of No. 1 and No. 3. Additionally, the increase in tensile strength after reaching the 0.2% proof stress was greater in No. 1 and No. 2 compared to No. 3. In particular, when the nominal stress-nominal strain curves of No. 1 and No. 3 are compared, No. 1 resulted better tensile strength and elongation than No. 3, despite that No. 1 had relatively more number of defects due to more spheroidal graphite area ratio.

The true stress-true strain curves and the work-hardening rate curves are shown in Fig. 7. The work-hardening ability of No. 2 is the highest. When the work-hardening abilities of No. 1 and No. 3 are compared. That is, interestingly, the results were indicated that No. 1 had a higher work-hardening ability despite the fact that it contained more defects.
3.3 X-ray diffraction measurements
Table 3 shows the retained austenite volume fraction of No. 1 to No. 3 before and after the tensile test. No. 2 had the greatest retained austenite volume fraction, and No. 3 had the least. As mentioned previously, it is thought that in the case of No. 2, because the grain became finer, the grain boundary increased, and austenization in the (α + γ) range (Fig. 2) was promoted, which generated relatively more austenite and resulted in a greater amount of retained austenite.

Table 3 Volume fraction of retained austenite in of each heat-treated specimen.
On the other hand, it is thought that in the case of No. 3, the amount of added Mn as the austenite stabilization element was less than that of No. 1 and No. 2, and with the (α + γ) heat treatment temperature range being the same, the amount of generated austenite was relatively lower.
In addition, the lower amount of added Mn accelerated to generate bainitic ferrite. That is to say, because a significantly greater amount of bainitic ferrite was generated from the low amount of austenite, the amount of retained austenite was less than that retained in No. 1 and No. 2.
Additionally, the retained austenite volume fraction decreased after the tensile tests in each specimen; in Fig. 7, No. 2, which is thought to have the highest work-hardening, had the greatest reduction in retained austenite volume fraction followed by No. 1 and No. 3 in order. For this reason, each specimen work-hardening behavior matched the strain-induced transformation behavior shown in Table 3 very well. Based on these results, despite the fact that No. 1 had more defects than No. 3, the effect of strain-induced transformation produced excellent mechanical properties of No. 1.
3.4 Stability of retained austenite
Regarding the difference of strain-induced transformation behaviors shown in Table 3 and Fig. 7, it was considered from the perspective of the stability of the retained austenite. To determine the stability of retained austenite, the Md30 formula18) was used (formula (1)). Md30 is the temperature at which 50% of austenite transforms into a martensite when 30% deformation (tensile true strain) is applied. When the higher the Md30 temperature is, the more unstable is the austenite.
| \begin{align}
\text{Md$_{30}$ [${{}^{\circ}\text{C}}$]}& = 551 - \text{462C%} - \text{9.2Si%} \\
&\quad - \text{8.1Mn%} - \text{29.0Cu%}
\end{align}
| (1) |
To obtain the concentration of the alloy element, Mn, Cu and Si (mass%) in retained austenite in each specimen sample. Thermo-Calc calculation in the (α + γ) range was conducted. Then, the solute carbon content in the retained austenite was determined through the X-ray diffraction measurement results. Because the solute carbon content can be calculated from the lattice constant, the lattice constant was determined through Bragg’s formula and from the lattice spacing, as given by formula
(2) below.
19)
| \begin{equation}
\mathrm{a} = \frac{\lambda (h^{2} + k^{2} + l^{2})^{\frac{1}{2}}}{2\,\mathit{sin}\,\theta}
\end{equation}
| (2) |
Here, λ = 1.542 (Å), and θ is the diffraction angles obtained through measurements. Additionally,
h,
k, and
l are the plane indices (
hkl). With formula
(2), the γ lattice constants for each γ-phase (111), (200), and (220) were determined. To accomplish this, the Nelson-Riley extrapolation function
20,21) was applied to determine the γ lattice constants a
γ (Å), and using Dyson and Holmes’ equation
22) as shown in formula
(3), the solute carbon content was calculated. For Mn
γ and Cu
γ, the values calculated with Thermo-Cal were used.
| \begin{align}
\mathrm{a}_{\gamma} &= 3.5780 + 0.0330 \times (\% C_{\gamma}) + 0.00095 \\
&\quad \times (\% \textit{Mn}_{\gamma}) + 0.0015 \times (\% \textit{Cu}_{\gamma})
\end{align}
| (3) |
shows the calculated alloy element concentration in the retained austenite of specimens No. 1 to No. 3 and the Md
30 values as calculated by in formula
(2). As shown in
Table 4, the Md
30 value for No. 1 was −128°C, No. 2 was −123°C, and No. 3 was −205°C. The differences were caused by the fact that the solute carbon content in austenite was 1.3% in No. 1 and No. 2 and 1.5% in No. 3. The reason for this difference of the solute carbon content in No. 3 is because the amount of added Mn was reduced to 0.7%, which accelerated the generation of bainitic ferrite, resulted the in promotion of the concentration of C. As a result, compared to No. 1 and No. 2, the austenite of No. 3 became more stable, which matches the results in
Table 3. Therefore, as the retained austenite became already extremely stable, very little strain-induced transformation occurred in No. 3. Additionally, the Md
30 values of No. 1 and No. 2 did not differ significantly, so their austenite stability was very similar. However, the work-hardening behaviors were different between No. 1 and No. 2 as shown in
Fig. 7.
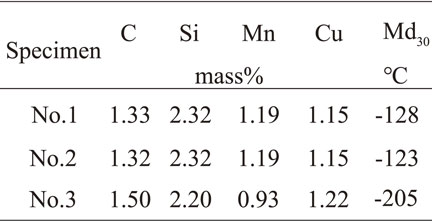
Table 4 Alloy concentration in retained austenite and Md30 of each heat-treated specimen.
As to why there was a more noticeable strain-induced transformation in No. 2 than in No. 1 despite their austenite stability being the same, EBSD analyses of the matrix structures in No. 1 and No. 2 were conducted. Figures 8 and 9 show the phase map overlaid with an image quality map in the grip section and the fracture section of No. 2 tensile test specimen, respectively. The red color and green color represent the α-phase and γ-phase, respectively, and the black region shows spheroidal graphite or inclusions that are not determined to be an α- or γ-phase. Comparing Fig. 8(a) and Fig. 9(a), the black region in the matrix in Fig. 9(a) is significantly larger. In Fig. 8(b) and Fig. 9(b), which magnify the areas near the spheroidal graphite, Fig. 9(b) shows that the austenite that was previously green changed to a black region. This is, as reported in the previous paper,7) thought to be martensite that was generated by a localized strain-induced transformation caused by strain concentrating in the vicinity of the spheroidal graphite. From Table 2, because No. 2 had a more spheroidal graphite nodule count, the region in which a strain concentration occurred have increased compared to No. 1. It was discovered that even in the case where the stability of the retained austenite is the same, an increase in the spheroidal graphite nodule count increase the region in which strain-induced transformation occur and strain-induced transformation occur more readily. Based on these findings, it is thought that the work-hardening behavior of No. 2 in Fig. 7 resulted in increased strength, but the ductility decreased because the strain-induced transformation occurred more than No. 1 at early stage. That is, the retained austenite in the vicinity of the spheroidal graphite had transformed into martensite readily.


