Abstract
Scanning Kelvin force probe microscopy (SKPFM) and subsequent electron backscatter diffraction (EBSD) measurements were performed across the same area of a ferrite/pearlite microstructure for annealed S45C steel. Larger potential differences were observed at the heterogeneous phase boundaries between cementite and ferrite. The EBSD measurements confirmed the dependence of potential on the crystallographic orientation of the ferrite phases. Specific orientation relationships between ferrite and cementite phases were observed when both phases nucleated in the same pearlite colony, however, such relationships were not valid when nucleation occurred in separate colonies. The heterogeneous phase boundaries exhibiting larger potential differences, in addition to having no specific orientation relationship, could be considered as a highly plausible candidate location for corrosion initiation. Thus, combined SKPFM and EBSD analyses are a powerful technique to improve the evaluation of the corrosion initiation process in ferrite/pearlite microstructures with respect to potential difference and crystallographic orientation relationships.

1. Introduction
Innovative structure materials designed to have both high tensile strength and toughness are realized by a sophisticated control of the microstructure. Because the distribution of grains and precipitates necessary to induce high strength properties in materials can result in increasing corrosion susceptibility, the development of technologies to evaluate the corrosion initiation mechanisms along the heterogeneous phase boundaries is urgently required to improve the verification process related to feasibility studies for practical use of such materials. Scanning Kelvin probe force microscopy (SKPFM) is a powerful device to study the electrical potential relevant to the surface work function in the microstructures of metal materials.1) This device somewhat combines scanning probe microscopy with a standard Kelvin probe and high-resolution atomic force microscopy (AFM), yielding important information relating to the potential distribution map and topography across the same area of measurement simultaneously. Numerous studies have demonstrated that the measured potential derived from SKPFM is not only reflected by the surface work function of the microstructure, but can also be modified by the presence of any surface defects, surface oxide layers, chemical variations and residual stress. However, even in the presence of numerous influential factors contributing to the value of the potential, the potential difference measured by SKPFM has been demonstrated to exhibit a linear relationship with the difference of corrosion potential in aqueous solutions.2,3) Therefore, the potential difference can indicate relative nobility between two adjacent phases, which is important when determining their role in micro-galvanic interactions. During the course of SKPFM technological improvements, a lateral resolution of at least 100 nm4) and a potential sensitivity of a minimum of 1 mV5) have been achieved. Several authors have demonstrated that the SKPFM technique can be adopted to examine the microstructural influence on corrosion behaviors for structured materials.6–8) The electron backscatter diffraction (EBSD) technique has also been used to study corrosion behavior of structured materials with respect to the crystallographic features present in their microstructures.9–11) The EBSD technique enables the identification of component phases, their crystallographic orientations, misorientation gradients with local plastic stains, and the orientation relationship between two adjacent phases in the microstructure. In particular, the mismatch of lattice structures evaluated by the crystallographic orientation along the boundary is closely correlated to the interfacial free-energy driving force of the corrosion initiation process.12) Although both the potential difference and the orientation relationship are key factors that can determine corrosion susceptibility, there are only a limited number of reports2,13) that have studied the correlation of these two factors. In the present study, SKPFM and subsequent EBSD measurements were performed across the same area of a ferrite/pearlite microstructure for annealed S45C steel to investigate how the microstructure characterization is relevant to corrosion initiation in ferrite/pearlite microstructures.
2. Experimental Procedure
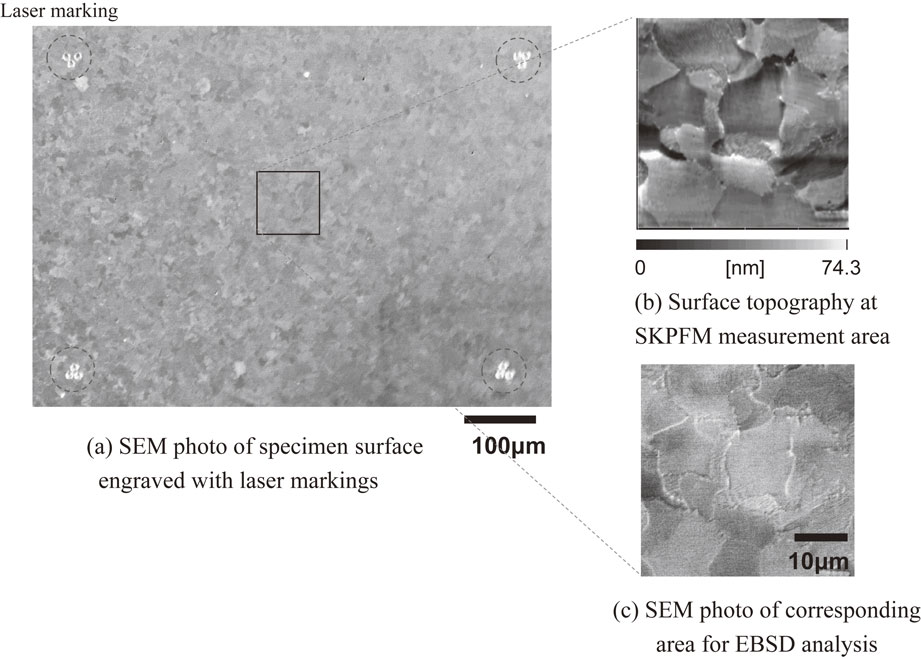
The material used in the present study was commercial S45C steel. The chemical composition of the steel is shown in Table 1. Prior to annealing for 30 min at 850°C and furnace cooling to room temperature, the material was fabricated into a miniature cuboid specimen having dimensions of: 10 mm (L) × 3 mm (W) × 2 mm (D). The specimen surface was mechanically ground using #600–1200 emery papers, polished by a colloidal silica suspension and finished by Ar-ion milling. Laser markings were introduced onto the specimen surface as guides for SKPFM and EBSD measurements.

Table 1 Chemical composition of S45C steel (mass%).
The SKPFM used in the present study comprised an AFM, Kelvin probe, potential measurement devices and a X-Y stage system (SII-SPI3800N). The measurement was conducted at room temperature in air using a conductive Rh-coated Si tip having a resonant frequency of ∼25 kHz, operated in a tapping/lift dual-pass mode. The measurement area was 40 × 40 µm2 with data points of 512 × 512 pixels. The resolution of the potential was 1.4 mV. Because the measured value of the potential from this device was the potential difference between the bias-controlled Kelvin probe tip and the ground specimen, the data is relatively quantitative, and hence, the potential difference provides useful information. For the measurements provided herein, the lowest value was normalized to zero in the potential map. Further comprehensive explanations regarding the SKPFM technique can be found elsewhere.6,7,14)
Subsequent EBSD measurements on the ferrite/pearlite microstructure were performed across the same areas studied by the SKPFM measurements using a field emission scanning electron microscope (FE-SEM, JEOL-JSM7900F) instrument equipped with a diffraction detector (EDAX, DVC-4). For each area, the crystallographic orientations were examined with a step of 0.20 µm over a surface dimension of 40 × 40 µm2. As for the description of the inverse pole figure (IPF) maps and IPF plots, a standard direction was assigned to be considered as the normal direction (ND) of the specimen surface. All the data derived from the EBSD measurements were analyzed using the software OIM System (version 7.3, TSL solutions). The crystallographic orientation analysis of the microstructure was performed using data having the confidence index (CI) value of 0.1 or more.
Figure 1 presents the verification process for the combined analysis in this study. The SKPFM measurement was conducted in the area enclosed by laser markings (see Fig. 1(a)), to obtain the surface topography (see Fig. 1(b)), followed by the EBSD measurement at the corresponding area (see Fig. 1(c)). As shown in Figs. 1(b) and (c), surface topography was a key factor to coincide the SKPFM measurement area with the corresponding EBSD measurement area.
3. Results
The ferrite/pearlite microstructure on the specimen surface for annealed S45C steel consisted of pro-eutectoid ferrite grains and pearlite colonies. Figures 2 and 3 present sets of: (a) SEM micrographs, (b) potential maps, and IPF maps for (c) ferrite phases and (d) cementite phases in Area-A and -B, respectively. The potential maps indicate that pearlite colonies can be characterized into several types: i) a pearlite colony exhibiting larger potential differences between the pearlitic ferrite and cementite phases (designated as Pearlite-1 in Area-A), ii) a pearlite colony having a lower potential difference between the pearlitic ferrite and cementite phases where a higher potential for the pearlitic ferrite phase is observed (Pearlite-2 in Area-B), and iii) a colony having a lower potential difference where the lower potential is observed for the pearlitic ferrite phases only (Pearlite-3 in Area-B). As shown in Fig. 2, a higher potential of the coarse lamella cementite phases, when compared with the potential of the pearlitic ferrite phases, led to a larger potential difference in Pearlite-1. In addition to lamella-like cementite phases in the pearlite colony, numerous fractions of cementite were observed to be nucleated along the boundary of the pearlite colony (see Fig. 2(d)). The potential difference was relatively smaller in Pearlite-2 and -3, as shown in Fig. 3(b). Although the potential of the pearlitic ferrite phases was relatively lower in Pearlite-2, the observed cementite phases appeared too thin to induce a distinctly higher potential in the potential map. In the case of Pearlite-3, the relatively higher potential for both the pearlitic ferrite and cementite phases resulted in a lower potential difference in the potential map. Therefore, the potential difference with respect to the pearlite colony is dependent not only on the aggregative condition of the lamella-like cementite phases, but also the relative potential of the pearlitic ferrite phases. As for the grains of the pro-eutectoid ferrite and the pearlitic ferrite phases in the pearlite colonies, the dependence of the relative potential on their crystallographic orientations was examined by comparing the potential map and IPF map for the ferrite phases. As shown in Fig. 4, the potential scale was divided into three equal parts (low, middle and high in ascending order of potential), and one ferrite grain was assigned to a corresponding scale mark: (a) potential map, followed by the subsequent references of (b) IPF map for the ferrite phase and (c) orientation legend of IPF map for the corresponding color, leading to the development of the (d) IPF plot for the ferrite phase. Figure 5 presents IPF plots of relative potential for (a) pro-eutectoid ferrite grains and (b) pearlitic ferrite phases. These plots were derived from 44 grains of pro-eutectoid ferrite and 43 colonies of pearlitic ferrite across five areas of combined SPKFM-EBSD measurements. As shown in Fig. 5(a), the IPF plots of low and high potential were mainly distributed around (001) and (110) planes for pro-eutectoid ferrite grains, respectively. Although there were few plots around (111) plane, (111) plane was considered to be relatively allocated at a potential between (001) and (110) planes. As for the pearlitic ferrite phases (see Fig. 5(b)), the plots around (001), (111) and (110) planes were mostly addressed to those of low, middle and high potential, respectively. Therefore, the dependence of potential on crystallographic orientation was similar for both the pro-eutectoid ferrite and pearlitic ferrite phases; (001) < (111) < (110) planes. The relationship of crystallographic orientation between the cementite and pro-eutectoid/pearlitic ferrite phases was also investigated in the ferrite/pearlite microstructure, designated as Area C. Figure 6 shows sets of (a) SEM micrographs, (b) potential maps, (c) IPF maps for ferrite phases and (d) IPF maps for cementite phases in Area C. As shown in Fig. 6(c), ferrite phases were designated as ①, ②, ③, ④ and ⑤, respectively. Similarly, as shown in Fig. 6(d), cementite phases nucleated in a pearlite colony and present along the boundary of the colony were designated as, Ⓐ, Ⓑ and Ⓒ, respectively. Namely, ferrite phase ① and cementite phase Ⓐ are the pearlitic ferrite and cementite phases nucleated in the same colony. The orientation relationships of a) Pitsch-Petch15,16) and b) Bagaryatsky16,17) between the cementite (c) and ferrite (α) phases are known to have good alignment between the two lattices: a) [100]c ∼//$[3\bar{1}1]\alpha $, [010]c ∼//[131]α, [001]c//$[\bar{2}\bar{1}5]\alpha $ and b) [100]c//$[1\bar{1}0]\alpha $, [010]c//[111]α, [001]c//$[\bar{1}\bar{1}2]\alpha $, respectively. Figure 7 presents the overlaid pole figures at the pearlitic ferrite phase ① and the pearlitic cementite phase Ⓐ: (a) $[3\bar{1}1]\alpha $ vs. [100]c, (b) [131]α vs. [010]c, (c) $[\bar{2}\bar{1}5]\alpha $ vs. [001]c, (d) $[1\bar{1}0]\alpha $ vs. [100]c, (e) [111]α vs. [010]c and (f) $[\bar{1}\bar{1}2]\alpha $ vs. [001]c. The plots of the overlaid pole figures are almost overlapped, as shown in Figs. 7(a), (b) and (c), whereas the overlaid pole figures are not observed to overlap in Figs. 7(d), (e) and (f). This indicates that the Pitsch-Petch relationship is applicable between the pearlitic ferrite phase ① and the pearlitic cementite phase Ⓐ in a colony, as shown in Fig. 6. Table 2 summarizes all the orientation relationships between the ferrite and cementite phases in Area C, where P signifies that the Pitsch-Petch relation is applicable, while N denotes neither the Pitsch-Petch or Bagaryatsky orientation relationships are applicable. As indicated in Table 2, the cementite phases nucleated along the boundary of a perlite colony appear to be applicable to the Pitsch-Petch relationship to either of two adjacent ferrite phases.


Table 2 Orientation relationship between ferrite and cementite in Area C.
4. Discussion
Localized corrosion is well understood to initiate along the heterogeneous phase boundary between ferrite and cementite in the ferrite/pearlite microstructure for carbon steels. Because the cementite phase acts as a cathodic site to the ferrite phase in corrosive solutions, adjacent ferrite phases would be preferentially dissolved as anode sites in micro-galvanic interactions. There are reports18,19) detailing that cementite could accelerate the dissolution of ferrite not only in a pearlite colony, but also at the vicinity of the pearlite colony. As for the ferrite phase, the dependence of corrosive susceptibility on its orientation has been detailed by theoretical calculations related to the work function in Fe.20) According to the calculations, the work function increases in the order: (001) < (111) < (101) planes, and the close-pack (101) plane of the ferritic phase possess the lowest surface energy of the three low-index surfaces,21) and hence exhibits intrinsic properties related to higher corrosion resistance.12) This anisotropy of the work function for the ferrite phases reflects the potential measured in the present experiment, namely a similar trend of increasing potential in order of the (001) < (111) < (101) planes for both the pro-eutectoid ferrite and pearlitic ferrite phases, as shown in Figs. 5(a) and (b), respectively. Therefore, regarding potential maps, the (001) and neighboring planes for the ferrite phases exhibit higher susceptibility for corrosion. Furthermore, the heterogeneous phase boundaries that display larger potential differences between the (001) and neighboring planes of the cementite and ferrite phases could be considered as candidates for corrosion initiation in ferrite/pearlite microstructures.
Besides the potential difference observed at the phase boundaries, the interfacial energy induced from the misfit of lattices between two phases is another factor to determine the corrosive susceptibility.12) From the classical nucleation theory for carbon steel during furnace cooling, the Pitsch-Petch,15,16) Bagaryatsky17) and Isaichev22) orientation relationships between cementite and ferrite have been derived to minimize the interfacial energy between the two phases. The Isaichev orientation relationship is very close to that of the Bararyatsky orientation relationship, as the former is only 3.8 degrees away from the latter. In the hypoeutectoid system for carbon steels having a low carbon content <0.77 mass%, heat treatment just below the eutectoid temperature yields large volume fractions of pro-eutectoid ferrite. Thereafter, nucleation of cementite at the pro-eutectoid ferrite-austenite interface results prior to pearlite colonies developing from the cementite. In this system, pearlite colonies comprising a continuous crystallographic pro-eutectoid ferrite and pearlitic ferrite system are commonly formed. Mangan and Shiflet23) have pointed to the existence of the Pitsch-Petch orientation relationship in pearlite colonies, whereas no specific orientation relationship has been observed between pro-eutectoid ferrite and cementite nucleated in different pearlite colonies. In the present study, the orientation relationship between cementite and ferrite was examined in Area C, as shown in Fig. 6. The data presented in Table 2 demonstrate that the Pitsch-Petch orientation relationship is applicable to ferrite ① and cementite Ⓐ (denoted as ①-Ⓐ), ②-Ⓑ and ⑤-Ⓒ. Because the ferrite grain ① corresponds to a pearlite colony comprising a continuous crystallographic pro-eutectoid ferrite and pearlitic ferrite system, the existence of the Pitsch-Petch orientation relationship between ① and Ⓐ is in good agreement with the results reported by Mangan and Shiflet.23) Similarly, the cementite phases Ⓑ and Ⓒ belong to the pearlite colonies that include the pro-eutectoid ferrite ② and ⑤, respectively. Although the potential difference in the potential map of Area C (see Fig. 6(b)) indicates higher susceptibility of corrosion at the heterogeneous boundaries between ①-Ⓐ, ①-Ⓑ and ①-Ⓒ, less corrosive susceptibility, having a lower interfacial energy, was anticipated only at the boundary between ①-Ⓐ because of the existence of the Pitsch-Petch orientation relationship. Therefore, the heterogeneous boundaries between ①-Ⓑ and ①-Ⓒ are considered the most plausible candidates for corrosion initiation in terms of both potential difference and orientation relationships in Area C. Thus, a combined analyses of SKPFM and EBSD is a powerful technique to improve the evaluation of corrosion initiation processes.
As a typical form of corrosion initiation for conventional carbon steels, corrosion by pitting has been considered as a common and serious phenomenon caused by the selective dissolution of ferrite phases around the inclusion (e.g. MnS).18) The MnS inclusion may act as a cathodic site to adjacent ferrite phases in micro-galvanic reactions. With the development of desulfurization technologies during smelting processes for innovative high strength materials, the appearance of MnS inclusions must be suppressed significantly to be negligible in corrosion initiation processes. However, regardless of the nature of material development based on carbon steels, the corrosion effect of cementite is intrinsically inevitable even in material fabrications tailored to have precise arrangements. In the next step of the present study, in situ SKPFM measurements of the present specimen corroded by droplets of artificial sea water will be investigated to verify the evaluation of the corrosion initiation process predicted by the present combined analyses. Further extensive efforts to accumulate the data of the combined SKPFM and EBSD analyses are necessary to support the development of reliable evaluation methodology of corrosion initiation for structured materials.
5. Conclusions
Combined SKPFM and EBSD measurements were performed across the ferrite/pearlite microstructures of annealed S45C steel. From the experimental results of the potential maps and orientation relationships at the heterogeneous phase boundary between ferrite and cementite in the microstructure, the dependence of potential on the crystal orientation was observed to increase for the ferrite planes in the order (001) < (111) < (101), while cementite was demonstrated to have a stable and higher potential. A larger potential difference was observed along the heterogeneous phase boundaries between cementite and the (001) ferrite plane and neighboring planes. The Pitsch-Petch orientation relationship was observed at the boundaries between ferrite and cementite in pearlite colonies. When cementite was nucleated at the boundary of a pearlite colony, there was no specific orientation relationship detected at the boundary between the cementite and other ferrite compositions located in adjacent pearlite colonies. In terms of the potential difference and interfacial free-energy, the heterogeneous phase boundary, displaying a higher potential difference and no specific orientation relationship between cementite and ferrite, is considered as a plausible candidate for the initiation of corrosion in the pearlite/ferrite microstructure. The combined SKPFM and EBSD analyses is a powerful technique to elucidate and ultimately improve the evaluation of corrosion initiation processes. Furthermore, extensive efforts to accumulate the combined data of the SKPFM and EBSD analyses are necessary to support the development of a reliable evaluation method related to corrosion initiation for structured materials.
REFERENCES
- 1) M. Stratmann and H. Steckel: Corros. Sci. 30 (1990) 681.
- 2) C. Örnek and D.L. Engelberg: Corros. Sci. 99 (2015) 164–171.
- 3) A.B. Cook, Z. Barrett, S.B. Lyon, H.N. McMurray, J. Walton and G. Williams: Electrochim. Acta 66 (2012) 100–105.
- 4) V. Guillaumin, P. Schmutz and G.S. Frankel: J. Electrochem. Soc. 148 (2001) B163–B173.
- 5) H.O. Jacobs, H.F. Knapp and A. Stemmer: Rev. Sci. Instrum. 70 (1999) 1756–1760.
- 6) N. Sathirachinda, R. Pettersson, S. Wessman and J. Pan: Corros. Sci. 52 (2010) 179–186.
- 7) M. Li, L.Q. Guo, L.J. Qiao and Y. Bai: Corros. Sci. 60 (2012) 76–81.
- 8) H. Masuda: Corros. Sci. 49 (2007) 120–129.
- 9) Y. Murase, N. Yamamoto and H. Katayama: Mater. Trans. 58 (2017) 1386–1391.
- 10) T. Fujii, K. Tohgo, Y. Mori and Y. Shimamura: Mater. Charact. 144 (2018) 219–226.
- 11) Y. Lu, H. Jing, Y. Han and L. Xu: J. Mater. Eng. Perform. 25 (2016) 565–576.
- 12) M. Madrigal-Cano, J.M. Hallen, E.M. Arce-Estrada and T.L. Manh: Comput. Mater. Sci. 161 (2019) 394–402.
- 13) C. Örnek and D.L. Engelberg: J. Mater. Sci. 51 (2016) 1931–1948.
- 14) M. Sababi, S. Ejnermark, J. Andersson, P.M. Claesson and J. Pan: Corros. Sci. 66 (2013) 153–159.
- 15) N.J. Petch: Acta Crystallogr. 6 (1953) 96.
- 16) W. Pitsch: Acta Metall. 10 (1962) 79–80.
- 17) Y.A. Bagaryatsky: Dokl. Akad. Nauk SSSR 73 (1950) 1161–1164.
- 18) C. Liu, X. Cheng, Z. Dai, R. Liu, Z. Li, L. Cui, M. Chen and L. Ke: Materials (Basel) 11 (2018) 2277.
- 19) L. Hao, S. Zhang, J. Dong and W. Ke: Corros. Sci. 53 (2011) 4187–4192.
- 20) G.N. Derry, M.E. Kern and E.H. Worth: J. Vac. Sci. Technol. A 33 (2015) 060801.
- 21) E. Aghemenloh, J.O. Umukoro, S.O. Azi, S. Yusuf and J.O.A. Idiodi: Comput. Mater. Sci. 50 (2011) 3290–3296.
- 22) I.V. Isaichev: Z. Tekhn. Fiz. 17 (1947) 835–838.
- 23) M.A. Mangan and G.J. Shiflet: Metall. Mater. Trans. A 30 (1999) 2767–2781.