Abstract
The mechanical properties of gradient-structured (GS) pure Cu processed by surface mechanical attrition treatment (SMAT) were investigated by tensile tests at different strain rates in the range of 5 × 10⁻⁴ s−1 to 5 × 10⁻² s−1 at room temperature. The yield strength (YS), ultimate tensile strength (UTS) and ductility (uniform elongation, UE) of the gradient-structured Cu are simultaneously increased with increasing strain rate, especially for the sample processed by longer SMAT-treating time, while the coarse-grained (CG) Cu showed no obvious strain rate effect on strength and ductility. In addition, the strain rate sensitivity (m) and hetero-deformation induced (HDI) stress of the gradient-structured samples also increased with increasing strain rate. The increase in strength is mainly attributed to the gradient-structured layers and HDI stress strengthening. On the other hand, the increase in ductility can be attributed to an increase in strain rate sensitivity (m) and the strain hardening induced by the accumulation of a large number of geometrically necessary dislocations (GNDS) caused by a large stress gradient (HDI hardening).
1. Introduction
Metallic materials usually show a trade-off in the strength-ductility, which limits their practical applications.1) It is an everlasting endeavor to improve the strength and ductility of metals. The plastic deformation behaviours of metallic materials, and its dependence on grain size in particular, have long been a topic of materials research. Consequently, bimodal grain size, nano-precipitate dispersion, nano-twins, and gradient nano-grained (GNG) structure were tailored at nano-scale by several novel strategies to improve mechanical properties.2–6) The effect of strain rate on strain hardening behaviours and flow stress has been observed in ultrafine-grained (UFG) and nanocrystalline (NC) materials.7–10) Generally, with increasing strain rate the tensile strength increases, while the ductility decreases. However, increase in ductility has been reported in UFG-Cu,11) nanocrystalline (NC)-Cu12) and NC-Ni13) as the strain rate increases.
The uniform elongation of electrodeposited UFG-Cu with a mean grain size of about 200 nm was found to increase from 20.5% to 33.3% when the strain rate increased from 1.04 × 10⁻⁵ s−1 to 1.04 s−1, and the yield strength increased from 144 to 178 MPa. In comparison, the yield strength and uniform elongation of coarse-grained Cu with a mean grain size of about 40 µm hardly changed with increasing strain rate.11) For the NC-Cu, increasing strain rate from 6 × 10⁻⁵ s−1 to 6 × 10⁻² s−1 improved the fracture strain increased from 15% to 39%, and the flow stress (with 1% plastic strain) from 84 to 122 MPa.12) Increasing the strain rate from 3 × 10⁻⁴ s−1 to 1.8 × 10⁻² s−1 enhanced the uniform elongation of NC-Ni increased from 3.16% to 3.9%, and the ultimate tensile strength from 1485 to 1610 MPa.13)
The strain rate sensitivity, m, measured experimentally is an important factor in evaluating material ductility.14) A coarse-grained Cu with an average grain size of D = 40 µm has an m value of 0.006 according to Follansbee et al.,15) m = 0.019 was reported for ECAP + cold-rolled Cu (D ≈ 300 nm) by Q. Wei et al.,7) and an unusually high m = 0.14 was reported for ECAP Cu (16 passes, D = 100 nm) by R.Z. Valiev et al.16) It should be noted that the mechanical properties of NC metals measured in the earlier time might not be accurate due to small sample sizes.16)
There is currently a lack of understanding of the strain rate effect on the plastic deformation behaviours for gradient-structured Cu processed by the SMAT process. In the present work, gradient-structured Cu samples consisting of a coarse-grained core sandwiched between two ultrafine-grained (UFG) surface layers, with their grain sizes change from hundreds of nanometers near the surface to several micrometers in the core was processed by using the SMAT technique.17,18) During tensile testing, stress state change is induced in the GS/CG architectures, which can be attributed to mechanical incompatibility and mutual constraint between different layers.2,19,20) The mechanical incompatibility of GS/CG layers produces a large strain gradient that must be accommodated by the geometrically necessary dislocations (GNDS).21)
In this work, the strain rate sensitivity (m), GNDS and strain hardening behaviours of gradient-structured Cu under tension were systematically studied over a wide range of strain rates, and the corresponding plastic deformation behaviours were also compared with its coarse-grained and nano-grained counterpart.
2. Experimental Procedure
A commercially pure copper (99.995% purity) was cut into plates with dimensions of 5 × 80 × 100 mm3, and then fully annealed in vacuum at 923 K for 2 h. to obtain homogeneously coarse-grained structure. On both two sides of copper plates were then processed by SMAT process at 77 K (liquid nitrogen environment) for 10, 30 and 60 min to obtain gradient structures. The SMAT processing was carried out in a cylinder-shaped chamber with a vibration frequency of 50 Hz and 208 stainless steel balls of 8 mm diameter. Briefly, a large number of balls impacted the sample surface repeatedly from random directions, as a consequence, the repeated multidirectional impacts at high strain rates onto the sample surface result in grain refinement progressively. The gradient-structured samples consist of a coarse-grained layer in the core and a gradient-structured surface layer on both sides. For simplicity, such samples with gradient-structured surface layer were called SMAT-processed samples.
Dog-bone-shaped samples with the gauge length of 15 mm, width of 5 mm, and thickness of 5 mm were cut from the SMAT-processed plates by wire-electrode cutting. Uniaxial tensile tests were performed at room temperature using a SHIMADZU Universal Tester, with a maximum load of 100 kN and different quasi-static strain rates ($\dot{\varepsilon }$) of 5 × 10⁻⁴ s−1 and 5 × 10⁻² s−1. At least three tensile tests were conducted under each testing condition to ensure the reproducibility of stress-strain curves. The tensile properties of annealed and SMAT-processed samples were listed in Table 1. In order to investigate the effect of hetero-deformation induced (HDI) stress22) on the mechanical properties of gradient-structured samples, the loading-unloading-reloading (LUR) tests were conducted at the strain rates of 5 × 10⁻⁴ s−1 and 5 × 10⁻² s−1. The stress measured by the LUR tests was used to be called back stress,23) but it was found recently that HDI stress is a more accurate term.22) In the LUR test, the strain increment for each LUR cycle was ∼1%, and the LUR cycle was repeated up to the strain of 15%. At each applied strain, the samples were unloaded with the unloading rate of 1000 N·min−1 to 20 N, followed by reloading back to further deform the sample. Strain jump tests were performed to investigate the effect of strain rate sensitivity on the ductility of gradient-structured Cu. Each Cu sample was initially subjected to a tensile strain at a strain rate of 5 × 10⁻⁵ s−1. The strain jumps were triggered at 2%, 5%, 8%, 10% and 12% elongation, and the corresponding strain rates of each jump were 2 × 10⁻⁴ s−1, 1 × 10⁻³ s−1, 5 × 10⁻³ s−1, 2 × 10⁻² s−1, and 1 × 10⁻¹ s−1, respectively.

Table 1 Details of samples and mechanical properties of annealed and SMAT-processed samples.
Vickers micro-hardness tests have been conducted on the cross-sections of SMAT-processed samples to investigate the hardness evolution across the gradient structure. A load of 0.49 N and dwell time of 15 s were used for the hardness tests. The 20 µm interval between two neighboring indents guaranteed a detailed detection of the hardness values in local areas while preventing mutual interference caused by the strain of neighboring indents. Every microhardness value was determined by averaging the values of 5 indents.
The tensile tests were stopped at 99% of the fracture strain and the necking positions of both samples were cut for scanning electron microscopy (SEM) testing. The samples for SEM analysis were mechanically polished by using 1200 grit sand papers, 6 µm and 1 µm diamond papers and 0.4 µm colloidal silica suspensions sequentially to acquire a mirror-like surface. SEM analysis was conducted with a Carl-Zeiss-Auriga scanning electron microscope equipped with a fully automatic EBSD system. The distribution and statistics of GNDS were estimated used EBSD images by the channel 5 software.
3. Results
3.1 Microhardness results
The variation of hardness with respect to the depth from the SMAT-processed surfaces to the interiors of the samples are presented in Fig. 1. The hardness of the annealed sample is approximately 0.60 GPa, and is provided as a reference. The highest hardness was detected at the surface of each SMAT-processed sample. The hardness values gradually decreased with depth, and began to level-off at the depth of 300 µm. The hardness was also affected the SMAT-treating time as shown in Fig. 1. At the same depth, the hardness was higher in the sample SMAT-processed for a longer period. For example, the highest hardness value was ∼1.24 GPa and detected at the topmost surface of the SMAT-60 min sample. Hardness is directly related to the severity of the plastic deformation. The sample surface was directly in contact with the incoming shots, and plastically deformed due to impact. The plastic strain induced by the impact on the sample surface was transmitted in the form of dislocation slip and deformation twinning from grain to grain. The impact strain gradually diminished as the impact energy was absorbed by increasing number of defects through depth. As a result, the strain hardening effect decreased through depth, so did the hardness values.
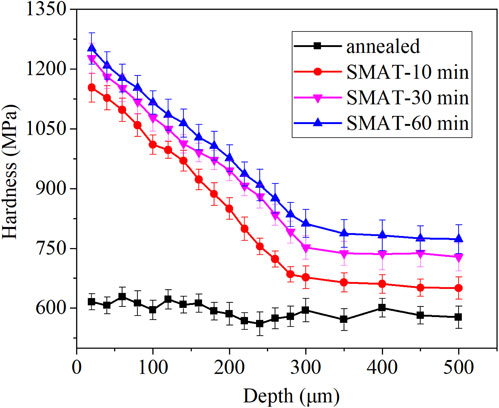
Figure 2 shows the engineering stress-strain curves for the annealed and SMAT-processed samples at different strain rates. It can be seen that the ductility decreases with increasing SMAT-treating time. Meanwhile, the yield strength and ultimate tensile strength gradually increase with increasing SMAT-treating time. SMAT process is very effective in improving the yield strength of the materials. For example, the yield strength (198 MPa) of the SMAT-10 min sample is about three times as higher as that of the annealed sample (67 MPa) at $\dot{\varepsilon } = 5 \times 10^{ - 4}$ s−1. For the SMAT-60 min samples tested at two different strain rates, both curves peaked after yielding and then began to decline. Increased strain rate has positive effects on ultimate tensile strength and uniform elongation of the materials. The SMAT-60 min sample has the highest strain rate sensitivity among all tested samples. When the strain rate increased from $\dot{\varepsilon } = 5 \times 10^{ - 4}$ s−1 to $\dot{\varepsilon } = 5 \times 10^{ - 2}$ s−1, the yield strength of the SMAT-60 min sample increased from 205 MPa to 223 MPa.

In order to examine strain rate effects on the mechanical behaviours of the SMAT-processed materials, the differences in yield strength, uniform elongation, and ultimate tensile strength induced by increasing the strain rate from $\dot{\varepsilon } = 5 \times 10^{ - 4}$ s−1 to $\dot{\varepsilon } = 5 \times 10^{ - 2}$ s−1 are measured and shown in Fig. 3.

The yield strength, uniform elongation, and ultimate tensile strength of coarse-grained Cu increased very lightly when the strain rate was increased. In contrast, for the SMAT-processed samples the strength increments and uniform elongation increments increase with increasing SMAT-treating time. This result suggests: (1) the coarse-grained Cu is less sensitive to strain rate than SMAT-processed samples, and (2) for SMAT-processed samples the strain rate sensitivity increases with increasing SMAT-treating time. The increased strain rate sensitivities of SMAT-processed Cu samples are attributed to the nanostructured surface layers, because the strain rate sensitivities of face-centered cubic (fcc) materials increase with decreasing grain size in the ultrafine-grained regime and nanocrystalline regime.24)
It is worth to note that the uniform elongation of coarse-grained Cu and the SMAT-processed Cu samples for less than 60 min seem insensitive to strain rate, but when the SMAT-treating time increased to 60 min the uniform elongation increment increased significantly, as shown in Fig. 3.
The strain hardening rate curves and true stress-strain curves of annealed and SMAT-processed samples are provided in Fig. 4, where the strain hardening rate as a function of true strain. The intersections between the true stress-strain curves and the strain hardening rate curves are the necking point (the onset of localized deformation). The normalized strain-hardening rates decrease rapidly with increasing strain for gradient-structured samples at the strain of before 3%. Additionally, the strain hardening rate curves become steeper when the SMAT-treating time is increased. It is worth noting that the strain hardening rate of the annealed samples is clearly higher than that of the gradient-structured samples. The strain hardening rate curves of annealed Cu tested at the strain rates of $\dot{\varepsilon } = 5 \times 10^{ - 4}$ s−1 and $\dot{\varepsilon } = 5 \times 10^{ - 2}$ s−1 are very similar, indicating that coarse-grained Cu is insensitive to strain rate.7,25) In contrast, for the SMAT-processed samples, the strain hardening rates increase with the increasing strain rate from $\dot{\varepsilon } = 5 \times 10^{ - 4}$ s−1 to $\dot{\varepsilon } = 5 \times 10^{ - 2}$ s−1, indicating that gradient-structured Cu is sensitive to strain rate.

The HDI stress is caused by the microstructural inhomogeneities and heterogeneous deformation in the gradient-structured materials.22) With increasing tensile strain, the softer layers/domains will be subjected to higher plastic strain than the hard layers/domains. Thus, there will be a strain gradient at the interface or transition region between soft and hard domains. The strain gradient has to be accommodated by GNDS at the interface. The HDI stress is the resultant of back-stress and forward-stress. It is generally measured by the LUR test.22) HDI stress can simultaneously increase the strength and ductility of the heterogeneous materials.22) In order to study the effects of HDI stress on the mechanical properties of gradient-structured Cu samples, LUR tests were conducted to measure the HDI stress. Figure 5(a) shows the LUR stress-strain curves for annealed and SMAT-processed samples tested at the strain rates of 5 × 10⁻⁴ s−1 and 5 × 10⁻² s−1. Figure 5(b) shows the magnified view of the sixth hysteresis loops in Fig. 5(a). Figure 5(c) depicts the HDI stress calculated from the hysteresis loops in Fig. 5(a).26) According to Fig. 5(c), the HDI stress increases with increasing SMAT-treating time and with increasing strain rate. Again, the HDI stress in annealed Cu sample is low and insensitive to the strain rate.

Strain rate jump tests were carried out on SMAT-processed samples within the strain rate range of 5 × 10⁻⁵ s−1 to 1 × 10⁻¹ s−1 to evaluate the m values. The true stress-strain curves obtained from the strain rate jump tests are shown in Fig. 6(a), and inset is the partially enlarged view. The m values were estimated by using the formula (1):14)
| \begin{equation}
m = \left(\frac{\partial \ln \sigma}{\partial \ln \dot{\varepsilon}}\right)_{\varepsilon,T}{} \approx \left\{\frac{\ln(\sigma_{2}/\sigma_{1})}{\ln(\dot{\varepsilon}_{2}/\dot{\varepsilon}_{1})}\right\}_{\varepsilon,T}
\end{equation}
| (1) |
where T and ε represent the absolute temperature and the true strain, respectively. The σ
2 and σ
1 correspond to the measured true stress immediately after and before applying strain rate jump, respectively;
$\dot{\varepsilon }_{2}$ and
$\dot{\varepsilon }_{1}$ represent the strain rates after and before the strain rate jump test, respectively.
The m values of the SMAT-processed samples at varying tensile strain rates are shown in Fig. 6(b). The m values of SMAT-processed samples increase with the increasing strain rate. It is worth noting that the maximum m values correspond to the highest strain rate ($\dot{\varepsilon } = 2 \times 10^{ - 2}$ s−1). In addition, it is noticed that at the strain rate of $\dot{\varepsilon } = 5 \times 10^{ - 5}$ s−1 the m values increase slightly with increasing SMAT-treating time but at the strain rate of $\dot{\varepsilon } = 2 \times 10^{ - 2}$ s−1 the m values decrease noticeably with increasing SMAT-treating time.
3.3 Microstructure
As shown in Fig. 7(a1) and (b1), the cross-sectional EBSD maps of SMAT-60 min and SMAT-30 min sample near the surface were obtained via SEM-EBSD, and (a2), (b2) are their corresponding grain size distributions maps. Where the mean grain sizes are ∼0.56193 µm and ∼0.83339 µm, respectively. Clearly, grain refinement at the topmost surface intensifies with increasing SMAT-treating time. This phenomenon can be reflected by comparing Fig. 7(a1) and (b1).
Figure 7(c) represents a summary of experimental results reported to date including the present work regarding the variation of m values as a function of grain size for Cu. It is clear that the m values increase with decreasing grain sizes from the micrometer regime to the nanocrystalline regime. This trend is common in fcc metals. However, for bcc metals opposite trend has been observed31) which was attributed to the change of deformation mechanism from screw dislocation controlled slip to edge dislocation controlled slip.32)
As shown in Fig. 8(a1) and (b1), the microstructure coarsens with increasing depth from the sample surface to the interior, indicating that severe plastic deformation occurred at the surface and the plastic strain decreased with increasing depth. This result matches the microhardness curves in Fig. 1, i.e., the microhardness decreases significantly with increasing depth from the SMAT-processed sample surface.
Figure 8(a2) and (b2) show the boundary misorientation maps. The red and black lines delineate low-angle grain boundaries (LAGBS, 2° ≤ θ < 15°) and high-angle grain boundaries (HAGBS, θ > 15°), respectively. The majority of the boundaries are LAGBS.
Figure 9(a1) and (b1) show the local misorientation maps which also reflect the GNDS distribution. GNDS density distribution histograms shown in Fig. 9(a2) and (b2) are calculated based on the kernel average misorientation (KAM) data extracted from Fig. 9(a1) and (b1), respectively.33,34) The misorientation angles associated with GNDS were determined to be within the range of 0∼2° by used CHANNEL-5 software.33,35) The strain gradient theory has been adopted for calculating the GNDS density (ρGND):33,36)
| \begin{equation}
\rho_{\textit{GND}} = 2\theta/\mu b
\end{equation}
| (2) |
where μ represents the length between adjacent data points; θ and b are the local misorientation (0∼2°) and the magnitude of the Burger’s vector for copper (b = 0.256 nm), respectively. In order to prevent disturbance by neighboring grains in the local misorientation calculation, the KAM values were evaluated to the second-nearest neighboring point, and any point with a misorientation larger than a predefined threshold of 2° is excluded.
37)
As shown in Fig. 9(b1), high densities of GNDS are distributed at the surface region of SMAT-processed samples. With increasing depth, the density of GNDS gradually decreases. It can be clearly observed in Fig. 9(a2) and (b2) that the density of GNDS in (b2) (ρGND (mean = 95.09648)) is much higher than that of (a2) (ρGND (mean = 53.57589)). The samples subjected to the same SMAT-treating time but tensile test at different strain rates were compared here.
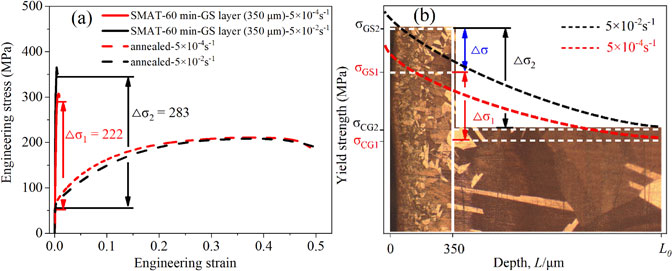
It is widely known that the stress gradient exists between the gradient-structured layer and coarse-grained core in a gradient structural material which is attributed to the strength difference and microstructural difference between the gradient-structured layer and the coarse-grained core. The stress gradient is also thought as one of the determinative factors affecting the mechanical properties of the material.21,23,38) Thus, the stress gradients in the SMAT-processed materials are examined mathematically by taking account of the strength differences between the gradient-structured layer and the coarse-grained core in each SMAT-processed material. Figure 10(a) shows the engineering stress-strain curves of the gradient-structured layer and the coarse-grained core of the SMAT-60 min sample tested at two different strain rates.

Let the sum of thicknesses of the gradient-structured layer and the coarse-grained layer be L0, then the stress gradient at the two selected strain rates can be defined as:
| \begin{equation}
G_{1} = \frac{\sigma_{\textit{GS${1}$}} - \sigma_{\textit{CG${1}$}}}{L_{0}} = \Delta \sigma_{1}/L_{0}
\end{equation}
| (3) |
| \begin{equation}
G_{2} = \frac{\sigma_{\textit{GS${2}$}} - \sigma_{\textit{CG${2}$}}}{L_{0}} = \Delta \sigma_{2}/L_{0}
\end{equation}
| (4) |
Where the σ
GS1 and σ
GS2 represent yield strength of the gradient-structured layers at the strain rates of 5 × 10
−4 s
−1 and 5 × 10
−2 s
−1, the σ
CG1 and σ
CG2 represent yield strength of the coarse-grained core at the strain rates of 5 × 10
−4 s
−1 and 5 × 10
−2 s
−1, respectively. Thus, according to the yield strength of gradient-structured layers and coarse-grained core presented in
Fig. 10(a). Stress gradients and the corresponding microstructures of SMAT-60 min sample are shown in
Fig. 10(b) as an example. The red and black dotted lines represent the variations of yield strength of the gradient-structured samples as a function of grain size at the strain rates of 5 × 10
−4 s
−1 and 5 × 10
−2 s
−1, respectively. The white dotted lines are used to quantify the yield strength of the gradient-structured layers and coarse-grained layers at different strain rates. Furthermore, the Δσ, Δσ
1, and Δσ
2 correspond to those in
Fig. 10(a). The
G2 −
G1 = Δσ/
L0 is clearly a positive value, indicating that the stress gradient of the gradient-structured Cu increased with increasing strain rate. The strong stress gradient is expected to improve the strain hardening ability of the gradient-structured materials,
39) as evidenced in
Fig. 4.
4. Discussions
Both the ductility and strength of all SMAT-processed samples show varying degrees of enhancement with increasing strain rate, as schematically illustrated in Fig. 2 and Fig. 4. According to previous the study,40,41) the gradient-structured layers play a crucial role in improving the mechanical properties of the copper. It is well-known that the strength of materials increases with decreasing grain size, therefore yield strength and ultimate tensile strength enhancements in SMAT-processed samples are attributed to the gradient-structured layer, in which the grain sizes of the top surface are in the ultrafine-grained regime.
The gradient-structured samples produced by the SMAT process consist of the GS layers and the coarse-grained core. The grain sizes change from hundreds of nanometers to several micrometers from the sample surface to the interior.42) It is evident from Fig. 10(a) that gradient-structured layers are more sensitive to the strain rate. This is because the strain rate sensitivity of fcc materials increases with increasing strain rate.7,25) This phenomenon can be clearly explained in Fig. 7(c). The result indicates a substantial increase in m values with decreasing grain size. Therefore, it is anticipated that during the tensile test the flow stress of the gradient-structured layer increased with increasing strain rate, but the flow stress of the coarse-grained core is nearly unchanged with increasing strain rate.25,39) Consequently, the strain incompatibility in gradient-structured materials increases with increasing strain rate. In order to accommodate the strain incompatibility of the gradient-structured sample, massive amounts of GNDS are created leading to large stress gradients and HDI stress.23,39,43–45)
The strain hardening capability that determines the ductility of the materials is controlled by the competition between the dislocations storage and dynamic recovery.46) Dynamic recovery of dislocations can be reduced by increasing the strain rate. Hence, the dislocation storage in the material is increased.47,48) The stress gradient increases with increasing strain rate leading to the high GNDS density, which improves the ductility and strength of the gradient-structured material. The increase in GNDS density is reflected by the increase in HDI stress at the increased strain rate (Fig. 5(c)).
Figure 5(c) shows that the HDI stress of all SMAT-processed samples increase with increasing strain rate. In particular, the higher HDI stress is associated with higher density of GNDS obtained at the larger strain rate, which led to higher strength of the gradient-structured samples, as schematically illustrated in Fig. 9(a2), (b2), Fig. 5(c) and Fig. 2. The high strain gradient at the GS/CG interface under the high strain rate promotes strain hardening and retards the dislocation recovery during the tensile test.21,33) It illustrated that the strain gradient existed in gradient structure materials with heterogeneous interfaces not only enhanced the strength of gradient-structured materials but improved the ductility of the materials as well.35,39)
Based on the above discussion, m values can obtain a better performance at longer SMAT-treating time and higher strain rates. On the contrary, in Fig. 6(b), m values display an abnormal phenomenon at the highest strain rate ($\dot{\varepsilon } = 2 \times 10^{ - 2}$ s−1). However, the m values of SMAT-60 min, 30 min, 10 min sample at the strain rate of $\dot{\varepsilon } = 2 \times 10^{ - 2}$ s−1 are 0.00884, 0.00934, 0.0105, respectively. Although all of them exist a significantly downward trend with increasing SMAT-treating time, the difference between them is extremely small. Therefore, we can think that this phenomenon was caused by experimental errors. In conclusion, the m values of all gradient-structured samples increase with increasing strain rate ($\dot{\varepsilon }$). The m values could have a noticeable effect on the uniform elongation of a metallic material, Hart derived the criterion for the tensile instability as:49)
| \begin{equation}
(1/\sigma)(\partial\sigma/\partial\varepsilon)_{\dot{\varepsilon}} + m \leq 1
\end{equation}
| (5) |
where the first term represents the normalized strain hardening rate, which reflects the strain hardening capability of the material. According to Hart’s criterion, high
m values can effectively delay the onset of necking, and thus improve tensile ductility of the rate-sensitive material.
14)
Figure 7(c) shows that the m values increase with decreasing D value. This can be attributed to the change in deformation mechanisms that, dislocation slip dominates the deformation in coarse grains and grain boundaries activity dominates the deformation in nano-grains. Therefore, at a higher strain rate, the structural characteristics of gradient-structured Cu determined that its deformation mechanism may be the cooperative character of dislocations slip and grain boundary sliding.50) Consequently, the m values increased with increasing strain rate, resulting in the improvement of uniform elongation for the gradient-structured samples. However, for the coarse-grained samples, the mechanical properties are insensitive to the strain rate, which is shown in Fig. 2, Fig. 4 and Fig. 10.
Consequently, based on all of the above discussions, it can be deduced that the increase of strain rate has an obvious enhancement effect on the strength and uniform elongation of all gradient-structured samples, especially the ones with longer SMAT-treating time.
5. Conclusion
In conclusion, the gradient-structured Cu prepared by the SMAT process exhibited an enhancement both in strength and ductility with increasing strain rate. The increase in strength can be attributed to the gradient-structured layers and HDI stress strengthening, which increases with increasing strain rate. The increase in uniform elongation (UE) can be attributed to an increase in m values and the strain hardening capacity induced by the accumulation of a large number of GNDS, which helps to deter dynamic recovery and delays the necking during the tensile test.
Acknowledgments
The authors would like to acknowledge financial support by the National Natural Science Foundation of China (NSFC) under Grant No. 51561015, No. 51911540072, No. 51601094, No. 51861015, No. 51664033 and No. 51861013, and 2019 JSPS/NSFC Bilateral Joint Research Project. The authors are thankful for the technical support from the Jiangsu Key Laboratory of Advanced Micro & Nano Materials and Technology, and the Materials Characterization Facility of Nanjing University of Science and Technology.
REFERENCES
- 1) N. Tsuji, Y. Ito, Y. Saito and Y. Minamino: Scr. Mater. 47 (2002) 893–899.
- 2) T.H. Fang, W.L. Li, N.R. Tao and K. Lu: Science 331 (2011) 1587–1590.
- 3) P.V. Liddicoat, X.Z. Liao, Y. Zhao, Y. Zhu, M.Y. Murashkin, E.J. Lavernia, R.Z. Valiev and S.P. Ringer: Nat. Commun. 1 (2010) 63.
- 4) G. Liu, G.J. Zhang, F. Jiang, X.D. Ding, Y.J. Sun, J. Sun and E. Ma: Nat. Mater. 12 (2013) 344–350.
- 5) K. Lu, L. Lu and S. Suresh: Science 324 (2009) 349–352.
- 6) Y. Wang, M. Chen, F. Zhou and E. Ma: Nature 419 (2002) 912–915.
- 7) Q. Wei, S. Cheng, K.T. Ramesh and E. Ma: Mater. Sci. Eng. A 381 (2004) 71–79.
- 8) G. Subhash: JOM 47 (1995) 55–58.
- 9) B. Song, W. Chen, B.R. Antoun and D.J. Frew: Exp. Mech. 47 (2007) 671–679.
- 10) A. Mishra, M. Martin, N.N. Thadhani, B.K. Kad, E.A. Kenik and M.A. Meyers: Acta Mater. 56 (2008) 2770–2783.
- 11) H. Zhang, Z. Jiang, J. Lian and Q. Jiang: Mater. Sci. Eng. A 479 (2008) 136–141.
- 12) L. Lu, S.X. Li and K. Lu: Scr. Mater. 45 (2001) 1163–1169.
- 13) R. Schwaiger, B. Moser, M. Dao, N. Chollacoop and S. Suresh: Acta Mater. 51 (2003) 5159–5172.
- 14) G.E. Dieter: Mechanical Metallurgy, (McGraw-Hill, New York, 1986) pp. 95–301.
- 15) P.S. Follansbee and U.F. Kocks: Acta Mater. 36 (1988) 81–93.
- 16) Y.H. Zhao, Y.Z. Guo, Q. Wei, A.M. Dangelewicz, C. Xu, Y.T. Zhu, T.G. Langdon, Y.Z. Zhou and E.J. Lavernia: Scr. Mater. 59 (2008) 627–630.
- 17) K. Lu and J. Lu: Mater. Sci. Eng. A 375–377 (2004) 38–45.
- 18) Y. Wei, Y. Li, L. Zhu, Y. Liu, X. Lei, G. Wang, Y. Wu, Z. Mi, J. Liu, H. Wang and H. Gao: Nat. Commun. 5 (2014) 3580.
- 19) X. Feaugas: Acta Mater. 47 (1999) 3617–3632.
- 20) F.P. Yuan, P. Chen, Y.P. Feng, P. Jiang and X.L. Wu: Mech. Mater. 95 (2016) 71–82.
- 21) X.L. Wu, M.X. Yang, F.P. Yuan, G.L. Wu, Y.J. Wei, X.X. Huang and Y.T. Zhu: Proc. Natl. Acad. Sci. USA 112 (2015) 14501–14505.
- 22) Y.T. Zhu and X.L. Wu: Mater. Res. Lett. 7 (2019) 393–398.
- 23) X.L. Wu and Y.T. Zhu: Mater. Res. Lett. 5 (2017) 527–532.
- 24) Y. Cao, S. Ni, X. Liao, M. Song and Y. Zhu: Mater. Sci. Eng. Rep. 133 (2018) 1–59.
- 25) S. Cheng, E. Ma, Y.M. Wang, L.J. Kecskes, K.M. Youssef, C.C. Koch, U.P. Trociewitz and K. Han: Acta Mater. 53 (2005) 1521–1533.
- 26) M.X. Yang, Y. Pan, F.P. Yuan, Y.T. Zhu and X.L. Wu: Mater. Res. Lett. 4 (2016) 145–151.
- 27) R.Z. Valiev, I.V. Alexandrov, Y.T. Zhu and T.C. Lowe: J. Mater. Res. 17 (2002) 5–8.
- 28) Y.M. Wang and E. Ma: Appl. Phys. Lett. 83 (2003) 3165–3167.
- 29) L. Lu, R. Schwaiger, Z.W. Shan, M. Dao, K. Lu and S. Suresh: Acta Mater. 53 (2005) 2169–2179.
- 30) R.P. Carreker and W.R. Hibbard: Acta Mater. 1 (1953) 654–663.
- 31) Q. Wei: J. Mater. Sci. 42 (2007) 1709–1727.
- 32) G.M. Cheng, W.W. Jian, W.Z. Xu, H. Yuan, P.C. Millett and Y.T. Zhu: Mater. Res. Lett. 1 (2013) 26–31.
- 33) H. Gao, Y. Huang, W.D. Nix and J.W. Hutchinson: J. Mechan. Phys. Solids 47 (1999) 1239–1263.
- 34) M. Calcagnotto, D. Ponge, E. Demir and D. Raabe: Mater. Sci. Eng. A 527 (2010) 2738–2746.
- 35) Z. Fu, Z. Zheng, L. Meng, B. Shu, Y. Zhu and X. Zhu: Mater. Sci. Eng. A 726 (2018) 154–159.
- 36) L.P. Kubin and A. Mortensen: Scr. Mater. 48 (2003) 119–125.
- 37) X. Ma, C. Huang, J. Moering, M. Ruppert, H.W. Höppel, M. Göken, J. Narayan and Y. Zhu: Acta Mater. 116 (2016) 43–52.
- 38) H.J. Gao and Y.G. Huang: Scr. Mater. 48 (2003) 113–118.
- 39) H.F. Tan, B. Zhang, X.M. Luo, X.D. Sun and G.P. Zhang: Mater. Sci. Eng. A 609 (2014) 318–322.
- 40) X. Yang, X. Ma, J. Moering, Z. Hao, W. Wei, Y. Gong, J. Tao, Y. Zhu and X. Zhu: Mater. Sci. Eng. A 645 (2015) 280–285.
- 41) Y. Zhe, L. Sun, Y. Jian, Y. Gong and X. Zhu: J. Alloy. Compd. 687 (2016) 152–160.
- 42) X. Huang: Science 312 (2006) 249–251.
- 43) X.L. Wu, P. Jiang, L. Chen, F.P. Yuan and Y.T. Zhu: Proc. Natl. Acad. Sci. USA 111 (2014) 7197–7201.
- 44) X.L. Wu, P. Jiang, L. Chen, J.F. Zhang, F.P. Yuan and Y.T. Zhu: Mater. Res. Lett. 2 (2014) 185–191.
- 45) S.S. Chakravarthy and W.A. Curtin: Proc. Natl. Acad. Sci. USA 108 (2011) 15716–15720.
- 46) Y. Estrin and H. Mecking: Acta Metall. 32 (1984) 57–70.
- 47) T. Suo, K. Xie, Y.L. Li, F. Zhao and Q. Deng: Adv. Mater. Res. 160–162 (2010) 260–266.
- 48) U.F. Kocks and H. Mecking: Prog. Mater. Sci. 48 (2003) 171–273.
- 49) E.W. Hart: Acta Metall. 15 (1967) 351–355.
- 50) I. Sabirov, Y. Estrin, M.R. Barnett, I. Timokhina and P.D. Hodgson: Acta Mater. 56 (2008) 2223–2230.


