3. Results and Discussions
3.1 Deformation behavior
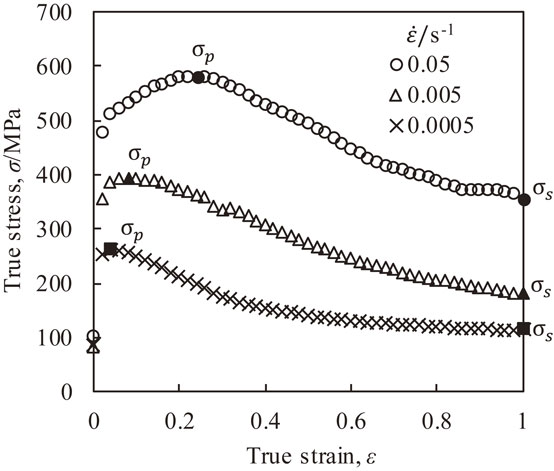
We calculated the true stress-strain curves of TMW-4M3 from actual load-stroke data obtained from compression tests. The flow stress curves in Fig. 2 show dynamic recrystallization behavior, which has peak stress σp and steady stress σs. Peak stress σp is the maximum point of flow stress and originates from the balance between work hardening by accumulation of dislocation and softening by dynamic recovery and recrystallization. After the peak stress point, dynamic recrystallization becomes predominant relative to work hardening, and flow stress decreases. Steady stress σs is the stable value of the flow stress curve in the larger strain range. In this region, the whole of the matrix phase is composed of recrystallized grains, and introduced dislocation by deformation is constantly balanced with dislocation annihilation by dynamic recrystallization. The relationship between these characteristic stresses and compression conditions in the precipitation strengthening type Ni-base superalloys is given as the following numerical modeling,
| \begin{equation}
Z = \dot{\varepsilon}\exp (Q/RT) = A\sigma^{n'},
\end{equation}
| (1) |
where
Z is the Zener-Hollomon parameter that denotes the temperature-compensated strain rate,
$\dot{\varepsilon }$ is the strain rate,
Q is the activation energy of high temperature deformation,
R is the gas constant,
T is the deformation temperature, σ is the flow stress, and
A and
n′ are the material constants.
12,13) Then, we evaluated the process dependency of σ
p and σ
s using
eq. (1).
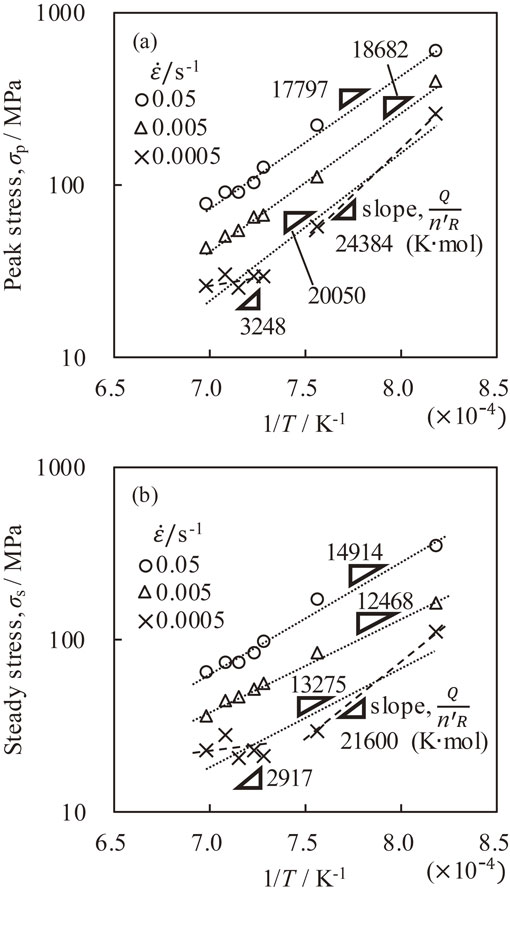
First, the temperature dependency of σp and σs were investigated. We took the natural log of eq. (1) and obtained the following expression,
| \begin{equation}
\ln \dot{\varepsilon} + (Q/R)(1/T) = \ln A + n'\ln \sigma.
\end{equation}
| (2) |
Under constant strain rate conditions, we can evaluate the effect of activation energy from the slope of the Arrhenius plot for σ using
eq. (2).
Figure 3 shows the Arrhenius plots toward σ
p and σ
s. For the strain rates of 0.05 s
−1 and 0.005 s
−1, we found linear relationships. In the case of the 0.0005 s
−1 strain rate, the temperature dependency is different. At high temperature, σ
p and σ
s were almost constant, but they increased at low temperature. The slopes
Q/
n′
R of all strain rate conditions estimated by the method of least squares are also listed in
Fig. 3. In the lower temperature range below 1373 K, the slopes for the strain rate of 0.0005 s
−1 had the same order of magnitude as the slope of 0.05 and 0.005 s
−1. However, in the higher temperature range greater than or equal to 1373 K, the slope for the strain rate of 0.0005 s
−1 was smaller than the other slopes by an order of magnitude. The reduction of the slope implies a decrease of activation energy. The small activation energy is revealed especially in conditions of smaller strain rates and higher compression temperature. Therefore, the dynamic recovery mechanism was assumed to be dominant in this region rather than dynamic recrystallization.
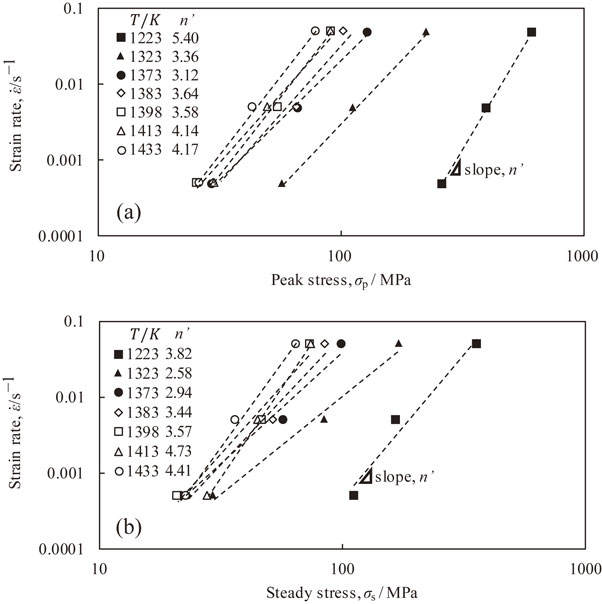
Secondly, stress index n′ was investigated from the relationship between $\ln \dot{\varepsilon }$ and ln σ for each compression temperature shown in Fig. 4. As with Fig. 3, the slope of the approximate straight line in this relationship denotes stress index n′. The calculated values of index n′ for all compression conditions are also written in Fig. 4. Stress index for pure metal and alloys usually ranged from 3 to 7 in previous research, and that for TMW-4M3 was generally consistent with this tendency.7)
From the slopes shown in Fig. 3 and Fig. 4, we found that the activation energies in different compression conditions differ. Calculation results of activation energies based on the peak stress and stready stress for all conditions are summarized in Table 3 and Table 4, respectively. These variations in activation energies are thought to be due to the γ′ state change with time and temperature. For example, at a lower temperature, the higher volume fraction of γ′ precipitates increase deformation resistance, which will lead to a large activation energy of deformation. In fact, it has been reported that the activation energy of high temperature deformation in Alloy 720Li also differs according to compression conditions.14) As shown here, in the case of dual phase structure, the microstructure evolution of the matrix phase is affected by the other phase, and the influence rate differs according to the process conditions. In this study, the best fit value of activation energy for the ranges of compression conditions was derived from the average value of the slope in both Fig. 3 and Fig. 4. As for the strain rate of 0.0005 s−1 in Fig. 3, the slopes Q/n′R defined from whole temperature range were used: 20050 K·mol for the peak stress, and 13275 K·mol for the steady stress. Then, we obtained 18843 K·mol and 13552 K·mol as the the average values of Q/n′R for the peak stress and the steady stress, respectively. Moreover, the average values of n′ derived from Fig. 4 were 3.92 and 3.64 for the peak stress and the steady stress respectively. Finally, we found the activation energies Q as 613.6 kJ for the peak stress and 410.3 kJ for the steady stress. As a result, we developed the following prediction model of σp and σs using the Zenner-Hollomon parameter on the basis of eq. (1).
| \begin{equation}
[\sigma_{\text{p}}]\quad Z = \dot{\varepsilon}\exp \left(\frac{613.6 \times 10^{3}}{RT} \right) = 1.07 \times 10^{14} \times \sigma_{\text{p}}^{3.92},
\end{equation}
| (3) |
| \begin{equation}
[\sigma_{\text{s}}]\quad Z = \dot{\varepsilon}\exp \left(\frac{410.3 \times 10^{3}}{RT} \right) = 2.19 \times 10^{7} \times \sigma_{\text{s}}^{3.64}.
\end{equation}
| (4) |
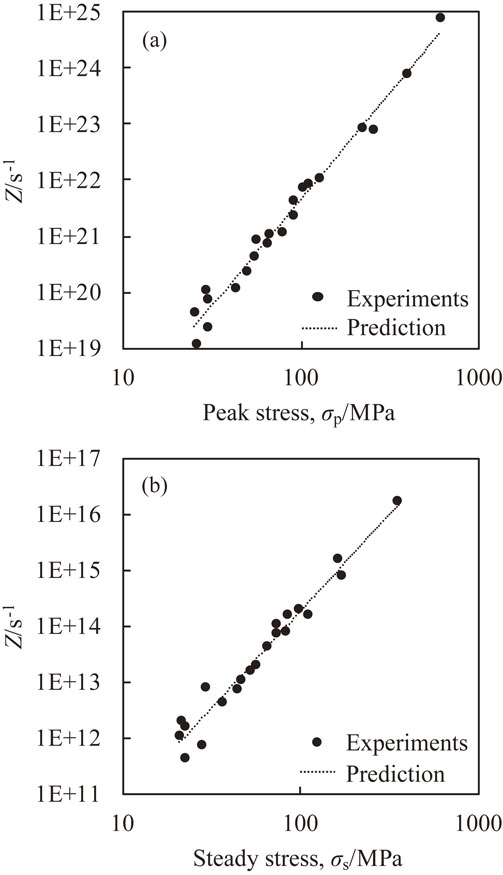
Here, the material constant A was derived from ln
Z-intercept of the approximate straight line in the relationship between ln
Z and ln σ. The comparison between the experiments and prediction model are shown in
Fig. 5. For each flow stress, the prediction model shows good agreement. Generally, the activation energy of high temperature deformation with dynamic recrystallization is larger than that of diffusion for solute elements. For example, the activation energy of nickel self-diffusion is 281 kJ/mol, and the activation energy of molybdenum inter-diffusion in nickel is 288 kJ/mol. On the other hand, the reported activation energy of high temperature deformation for the Ni-base superalloy Waspaloy ranged from 346 to 468 kJ/mol.
5,15–17) As for the solute elements in TMW-4M3, the activation energies of aluminum and titanium volume diffusion in nickel are about 260 kJ/mol.
18–20) Moreover, the activation energies of volume diffusion for cobalt, chromium and tungsten range from 280 to 310 kJ/mol.
18,20) Therefore, as with Waspaloy, the activation energies of high temperature deformation for TMW-4M3 are larger than those of volume diffusion for its solute elements, which indicates the deformation by dynamic recrystallization.
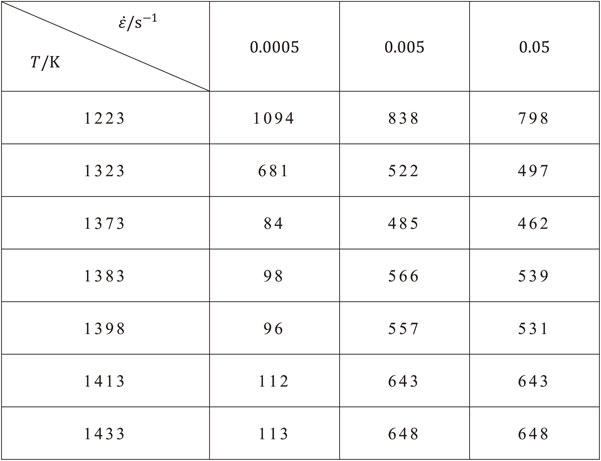
Table 3 Calculated activation energy Q of all compression conditions based on the peak stress (kJ).
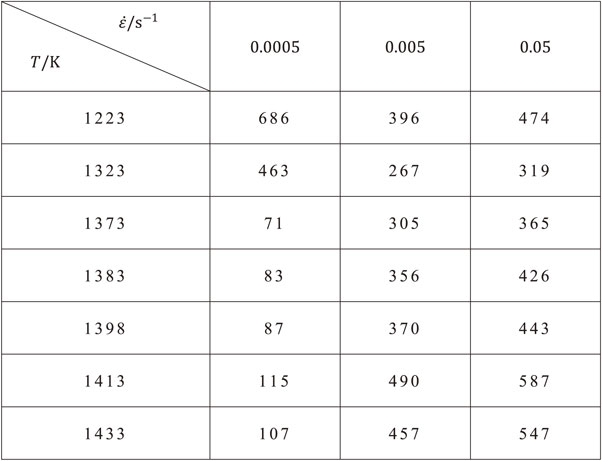
Table 4 Calculated activation energy Q of all compression conditions based on the steady stress (kJ).
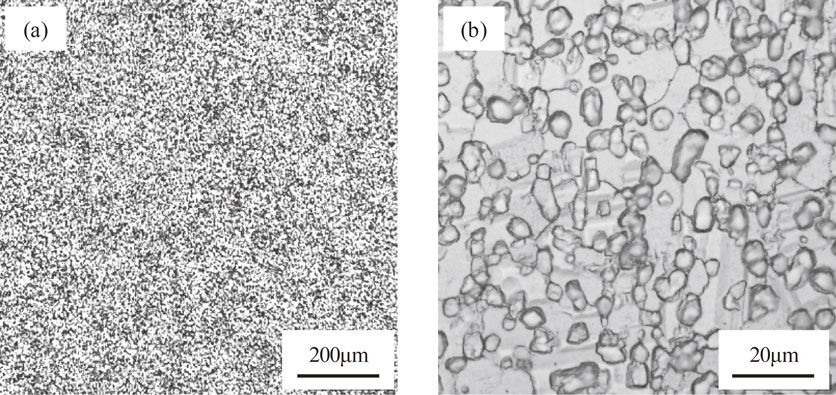
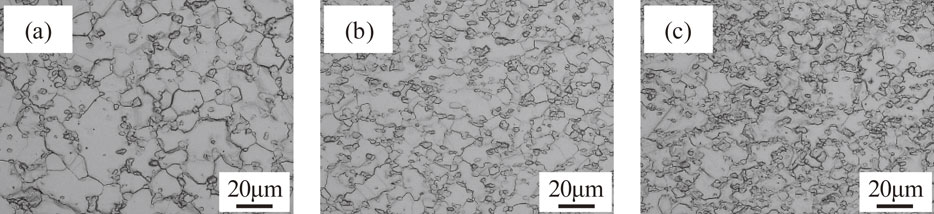
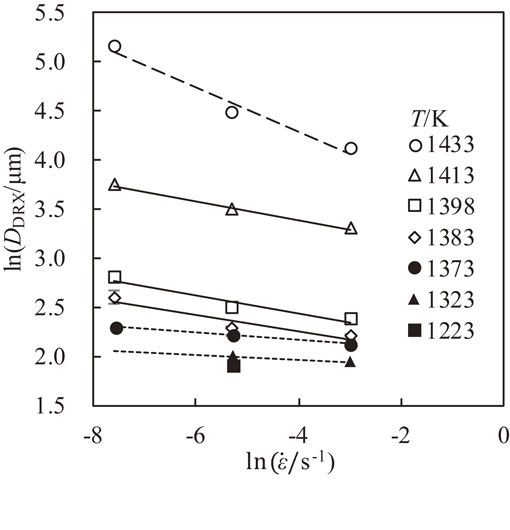
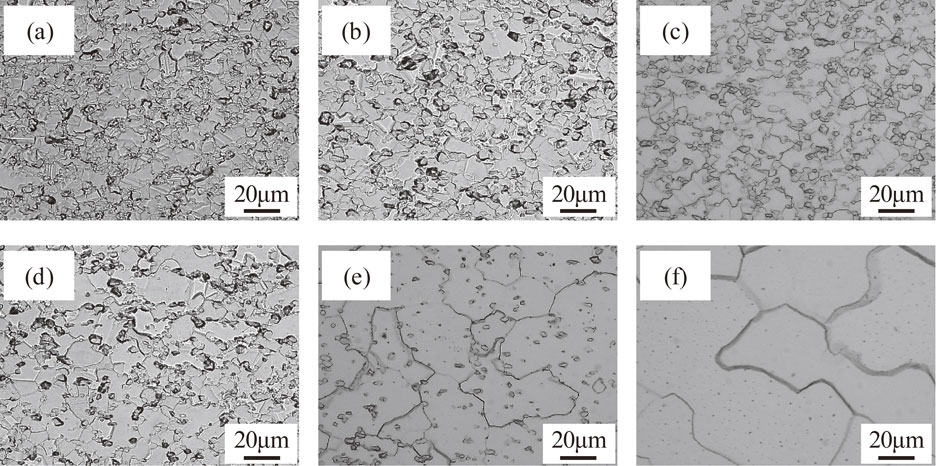
Typical microstructures after isothermal compression tests are shown in Fig. 6. The true strains of all test pieces were about 1.4, which showed steady flow stress, and then all the matrix grains were dynamically recrystallized ones. The average grain size after dynamic recrystallization DDRX increased with higher compression temperature. At the same time, the amount of γ′ particles decreased. Moreover, the strain rate dependency of DDRX is indicated in Fig. 7. A faster strain rate resulted in a fine microstructure, and a slower strain rate resulted in a coarse one. Then, the compression temperature dependency of DDRX evaluated by an Arrhenius plot and the strain rate dependency of DDRX are shown in Fig. 8 and Fig. 9, respectively. For the temperature dependency, the slope of the Arrhenius plot changes with temperature. For the strain rate dependency, the slopes of the double logarithmic chart also change and are clarified to be in three temperature range groups: lower temperature range below 1373 K, middle temperature range from 1383 to 1413 K, and higher temperature range around 1433 K.
Here, it is known that the Zener-Hollomon parameter, characteristic value of isothermal forging process, and DDRX have the following relationship,
| \begin{equation}
D_{\text{DRX}} = A_{\text{DRX}}Z^{- n_{\text{DRX}}},
\end{equation}
| (5) |
where
ADRX and
nDRX are material constants. This equation shows that forging in a large
Z condition, at low temperature, and at a fast strain rate results in small
DDRX. In the process design of isothermal forging, the main parameters are the strain rate and forging temperature. By using
eq. (5), we can predict the dynamically recrystallized grain size just after the isothermal forging process. Therefore, we have developed numerical modelling of the dynamically recrystallized grain size on the basis of
eq. (5). Here, we used the activation energy of steady stress for the calculation of the Zener-Hollomon parameter because
DDRX in the general isothermal forging process is defined toward the fully dynamically recrystallized microstructure. The relationship between
DDRX and
Z of TMW-4M3 is shown in
Fig. 10. Generally, a single-phase alloy system has a certain relationship of
eq. (5), but TMW-4M3 showed a unique
DDRX −
Z relationship at each compression temperature. This means that even if we compress TMW-4M3 under one certain
Z condition, the average value of the dynamically crystallized grain size differs with compression temperature. As stated in
Fig. 9, we also found that this ln
DDRX − ln
Z relationship was grouped in to three regions according to the slope of the approximate lines shown in
Fig. 10.
- Region 1: below 1373 K
- Region 2: from 1383 K to 1413 K
- Region 3: 1433 K
Region 1 showed the smallest slope. Moreover, the difference in
DDRX under the same
Z compression was sufficiently small in this region, so the approximate line seems to converge into one. Region 2 has a larger slope than region 1. In addition, the degree of coarsening was becoming larger with higher temperature. Region 3 indicated the largest slope and a very large grain size. Here, we presumed that the amount of γ′ phase greatly influences
DDRX, because it has a pinning effect on matrix grain growth. Then, the measured fraction and average radius of γ′ precipitates for each compression temperature were summarized in
Fig. 11. The average sizes of γ′ particles were similar to each other. On the other hand, the γ′ phase fraction was decreasing with higher temperature. The average fraction was more than 25% in region 1, from 15% to 22% in region 2, and less than 1% in region 3. As shown in
Fig. 6 and
Fig. 7, a lot of γ′ particles were dispersed in the TMW-4M3 microstructure. Therefore, a large amount of γ′ fraction means a large number density, which results in a strong pinning effect on the growth of dynamically recrystallized γ matrix grains.
We analyzed the grain growth behavior affected by γ′ particles using the following Smith-Zener relationship,21)
| \begin{equation}
\skew3\bar{R} = a\frac{\bar{r}}{f^{b}},
\end{equation}
| (6) |
where
$\skew3\bar{R}$ is the average grain radius,
f is the fraction of pinning particles, and
$\bar{r}$ is the average radius of pinning particles. Assuming fixed pinning particles, for example, the material constants
a and
b were identified as 4/3 and 1, respectively.
22) Moreover, many modified models by taking into account such as fraction range, the effects of curvature and interfacial energy of particles have been suggested.
23–30) They reported different values of a and b in
eq. (6).
Figure 12 shows the relationship between
$\skew3\bar{R}/\bar{r}$ and
f in this study. If the recrystallized microstructures of TMW-4M3 obey the general formula,
eq. (6), the plots will show the straight line in
Fig. 12. However, in particular, in the range of small γ′ fraction, the grain size shifted to the coarse microstructure. Therefore, the recrystallized grain size of TMW-4M3 was affected by both the strain rate and the pinning particles.
3.3 DDRX prediction model under pinning effect
We thought that the pinning effect in region 1 was large enough in any temperature conditions, and the difference in grain size for each temperature was quite small. The volume fraction in this region was almost same. However, the contribution of Z was obvously confirmed in Fig. 10. To include the effect of strain rate conditions, one certain DDRX − Z relationship was applied to this region, which enables us to predict the relationship between forging conditions and resulting grain sizes. Using the method of least squares, we derived the following prediction formulae,
| \begin{equation}
\text{Region 1}\quad D_{\text{DRX}} = 51.4 \times Z^{- 0.0577}.
\end{equation}
| (7) |
In region 3, the γ′ phase was quite small and the microstructures were almost γ single phase. Therefore, the pinning effect is negligible, and the conventional
DDRX −
Z relationship seems to be available. From the experimental results shown in
Fig. 10, we identified the material constants of
eq. (5) as follows,
| \begin{equation}
\text{Region 3}\quad D_{\text{DRX}} = 72403 \times Z^{- 0.227}.
\end{equation}
| (8) |
As for region 2, the pinning effect was becoming smaller than that of region 1 with decreasing volume fraction of γ′ precipitates. Here, the difference of this pinning effect also affected the microstructures, not only the
Z value. Here, by taking the natural log of
eq. (5), we obtained the following relationship,
| \begin{equation}
\ln D_{\text{DRX}} = \ln A_{\text{DRX}} - n_{\text{DRX}}\ln Z.
\end{equation}
| (9) |
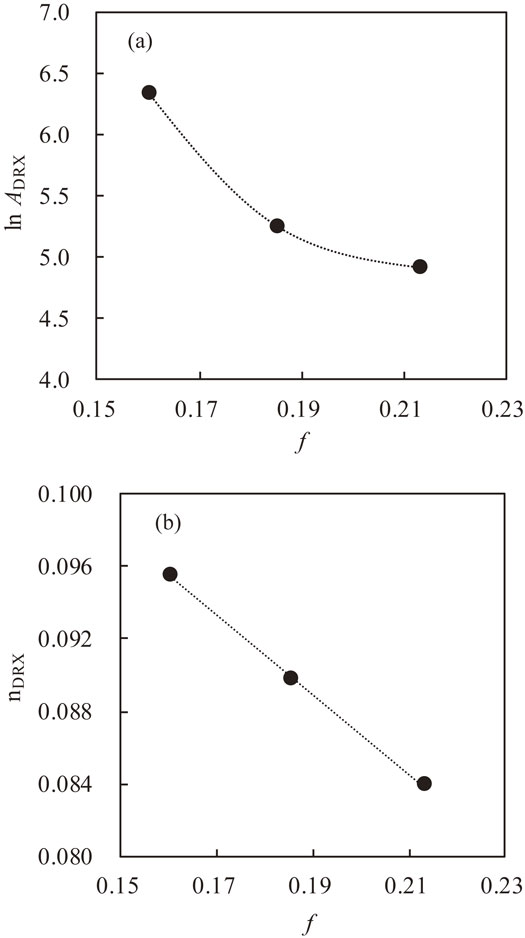
The γ′ fraction dependency of the intercept term ln
ADRX and the slope
nDRX were investigated for the compression temperature of 1383 K, 1398 K, and 1413 K in region 2. From
Fig. 10, each ln
ADRX was derived as 4.91, 5.25 and 6.35, respectively. Moreover, each
nDRX was obatained as 0.084, 0.090 and 0.096, respectively. These results are summarized in
Fig. 13. The intercept terms ln
ADRX and the slope
nDRX were fitted well by quadratic and linear functions, respectively. Then, we identified the material constants using the following expression,
| \begin{equation}
\ln A_{\text{DRX}} = 590.4 \times f^{2} - 247.3 \times f + 30.8,
\end{equation}
| (10) |
| \begin{equation}
n_{\text{DRX}} = - 0.219 \times f + 0.131.
\end{equation}
| (11) |
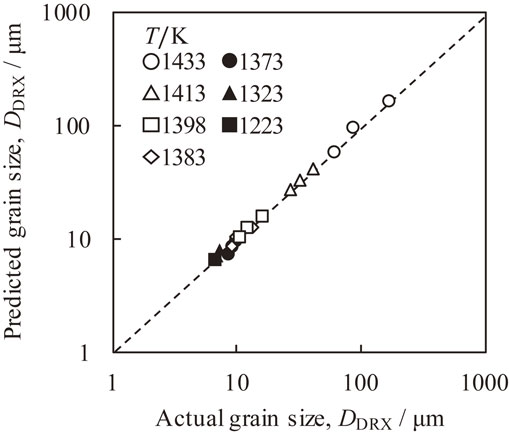
The comparison of
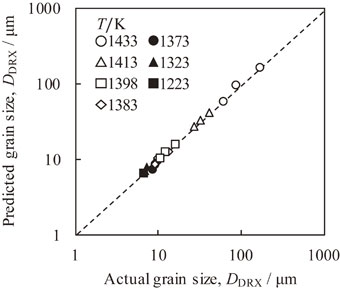
DDRX between the experimental results and prediction model calculated by
eqs. (7)–
(11) are shown in
Fig. 14. The predicted
DDRX agrees quite well with the experimental results in the whole range of isothermal compression conditions by applying not only the conventional
Z dependent prediction model but also the new formulae considering the pinning effect through the γ′ fraction. The error in this model is within 12% for
DDRX, which is sufficiently accurate for the actual forging process design.
Finally, we summarize our DDRX prediction model. In the dynamically crystallized microstructure system where the pinning effect is significant, the relationship between DDRX and the Zener-Hollomon parameter of the isothermal forging condition is shown as
| \begin{equation}
D_{\text{DRX}} = A_{\text{DRX}}(f)Z^{- n_{\text{DRX}}(f)}.
\end{equation}
| (12) |
Unlike in the case of conventional modelling, the material constants
ADRX and
nDRX are dependent on the γ′ fraction and are patterned into the following three groups by the influence rate of the pinning effect.
-
I.
Pinning effect is large enough and dominant for grain boundary migration
| \begin{equation}
A_{\text{DRX}} = A_{1},\quad n_{\text{DRX}} = n_{1}.
\end{equation}
| (13) |
-
II.
Both pinning effect and Z parameter are considered
| \begin{equation}
\ln A_{\text{DRX}} = A_{2}f^{2} + A_{2}'f + A_{2}'',\quad n_{\text{DRX}} = n_{2}f + n_{2}'.
\end{equation}
| (14) |
-
III.
Pinning effect is quite small or negligible
| \begin{equation}
A_{\text{DRX}} = A_{3},\quad n_{\text{DRX}} = n_{3}.
\end{equation}
| (15) |