Abstract
The relationship between the critical resolved shear stress (CRSS) at T = 0 K and the atomic structure distortion was studied using molecular dynamics (MD) simulation with atomic distortion (root-mean-square-atomic-displacement (RMSAD)) controlled Lennard-Jones (LJ) interatomic potentials for different face-centered-cubic (FCC) high entropy alloy (HEA) systems, such as ternary, quaternary, and quinary alloy systems. We demonstrated that an almost universal linear relationship exists between CRSS and RMSAD for the random solid solution (RSS) of these alloy systems. The universality was also confirmed by a more realistic embedded atom method (EAM) potential. However, alloy systems that have a chemical-short-range-order (CSRO) do not follow this universal linear relationship.
1. Introduction
High entropy alloys (HEAs) are almost random solid solution (RSS) alloys comprising of five or more metallic elements with equiatomic or nearly equiatomic proportion. HEAs have attracted tremendous attention from the materials science research community due to their remarkable mechanical properties when applied as a structural material. This properties include excellent cryogenic temperature ductility,1) high mechanical strength,2,3) good wear resistance,4) exceptional damage tolerance,1,5,6) moderate strain-rate sensitivity,2) and high thermal stability.4,7) The design and development of a new HEA that has better mechanical properties than the presently existing HEAs have been a major challenge. Recently, a universal linear relation between the critical resolved shear stress (CRSS) and several atomic distortion parameters, like the root-mean-square-atomic-displacement (RMSAD),8) the atomic volume difference,9–11) and the local atomic strain,12) has been proposed and backed by experimental findings. Our first goal here is to demonstrate the universal relationship between CRSS and RMSAD in the ternary, quaternary, and quinary alloy systems using molecular dynamic (MD) simulations with emphasis on direct atomistic deformation testing. To achieve this goal, we developed RMSAD controlled Lennard-Jones (LJ) potentials for these alloy systems and performed direct dislocation glide analysis using these potentials. Another goal was to investigate the chemical-short-range-order (CSRO) effect on the universal linear relation. The existence of the CSRO in HEA has been strongly suggested in recent modeling13) and experimental studies.14,15) It is not surprising that there are atomic bonding preferences in such multi-element systems, which should lead to a local atomic ordering at low temperatures where the effect of configurational entropy is expected to be lower than the effect of enthalpy.
2. Computational Methods and Models
2.1 Interatomic potential model
The LJ potential is simple and useful in qualitatively studying the movement of defects, such as dislocation glide, in metallic systems. Although the many-body effect was ignored in the interatomic interaction, the LJ potential was used in this work due to its flexibility in adjusting the RMSAD and making the CSRO in the HEA model. This flexibility enables the demonstration of the universal relation between CRSS, RMSAD, and CSRO effect on it. The LJ potential between the same element, i, is given by
| \begin{equation}
U_{LJ} = 4\varepsilon_{ii} \left\{ \left( \frac{\sigma_{ii}}{r} \right)^{12} {}- \left( \frac{\sigma_{ii}}{r} \right)^{6} \right\},
\end{equation}
| (1) |
where ε
ii is the depth of the energy well and σ
ii defines the cut-off distance of the interatomic interaction. The LJ potential for the elements
i and
j was determined using
eq. (1). The potential parameters, ε
ij and σ
ij, are given by
$\varepsilon _{ij} = \sqrt{\varepsilon _{ii}\varepsilon _{jj}} $ and
$\sigma _{ij} = \sqrt{\sigma _{ii}\sigma _{jj}} $. In this study, the Large-scale Atomic/Molecular Massively Parallel Simulator (LAMMPS)
16) was used to perform for the MD simulations.
2.2 RMSAD computation method
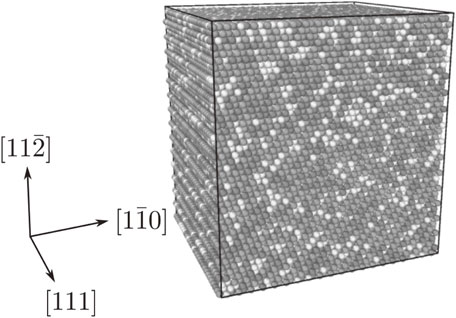
The MD simulations were performed to determine the RMSAD values for different equiatomic alloying systems (ternary, quaternary and quinary) in a three-dimensional FCC crystal structure. The three-dimensional FCC crystal comprised of ∼54,000 atoms with a 7.7 × 8.9 × 9.4 nm3 supercell under periodic boundary conditions in all three directions, such as (111), ($1\bar{1}0$), and ($11\bar{2}$) (See Fig. 1 for typical supercell). The specific number of atoms for all the elements were randomly arranged on the FCC lattice. The RMSAD of the LJ alloy systems was computed by the following procedure. First, (a) the volumetric supercell relaxation without atomic structure relaxation was performed on the model using NTP ensemble to keep the number of atoms (N), temperature (T) and pressure (P) constant. Then, (b) atomic structure relaxation without supercell shape relaxation was performed to obtain a distorted atomic structure that deviated from the FCC lattice. The RMSAD values were computed from the atomic displacement that resulted during the atomic structure relaxation process (b) using the following equation:
| \begin{align}
\text{RMSAD} \equiv \sqrt{\langle \Delta r^{2} \rangle} & = \sqrt{\frac{1}{N}\displaystyle\sum_{i=1}^{N} | r_{i}^{(\text{Relax})}- r_{i} ^{(\text{Onlattice})} |^{2}}\\
& = \sqrt{\langle| r_{i}^{(\text{Relax})} - r_{i}^{(\text{Onlattice})}|^{2}\rangle},
\end{align}
| (2) |
where
$r_{i}^{(\text{Relax})}$ is the atomic positions of atom
i at the relaxed configuration and
$r_{i}^{(\text{Onlattice})}$ is the atomic positions of atom
i on the FCC lattice configuration in the process (b),
N is the total number of the atoms in the supercell. We chose the potential parameters that can model various alloys having different RMSADs. The potential parameters used for the ternary, quaternary, quinary alloy systems with various RMSADs are listed in
Tables 1–
3. The parameters ε
ij were set to 0.2 eV.
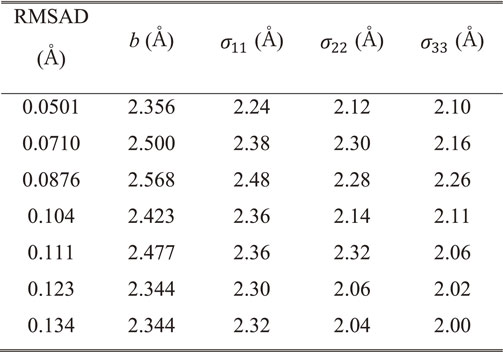
Table 1 LJ parameters for ternary systems with corresponding mean-square-atomic-displacement (MSAD) values. The average Burgers vector b is computed from the supercell size after the volumetric relaxation.
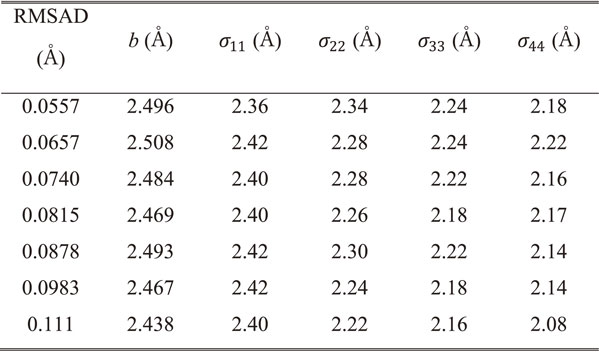
Table 2 LJ parameters for quaternary systems with corresponding MSAD values. The average Burgers vector b is computed from the supercell size after the volumetric relaxation.
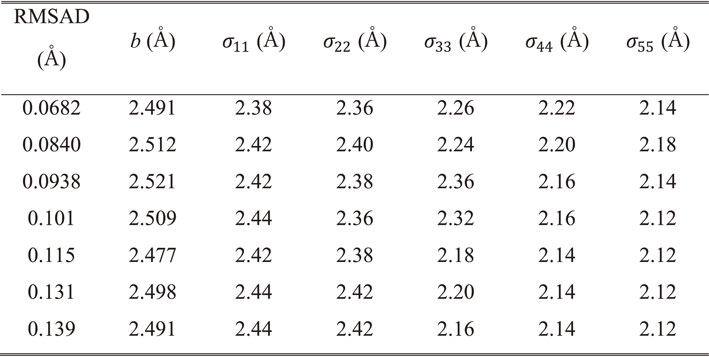
Table 3 LJ parameters for quinary systems with corresponding MSAD values. The average Burgers vector b is computed from the supercell size after the volumetric relaxation.
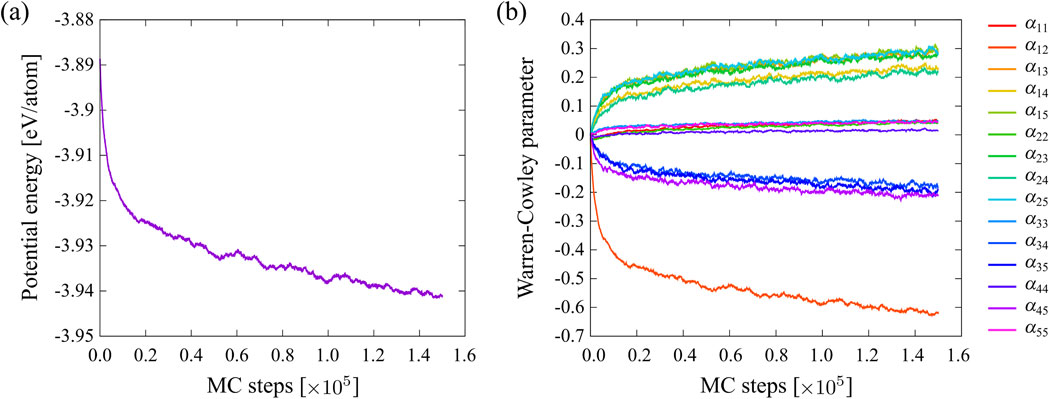
To obtain a CSRO structure, we modified the LJ potential parameter εij for the quinary system in order to model a strong atomic bond between type 1 and type 2 atoms, this resulted in a CSRO structure with higher a bonding probability between them. The parameters of the modified LJ potential are shown in Table 4. A Monte Carlo (MC) annealing simulation at T = 0.83 (1/Tm, Tm is melting temperature) was performed by swapping the atomic positions. Figure 2 shows the energy reduction during the MC simulation and change in the CSRO parameters (Warren-Cowley parameters17,18)), that clearly demonstrate that the CSRO parameters deviate from zero which means that certain CSRO was formed in the model made by the MC simulation. The RMSAD value of this model is computed as 0.053 Å.
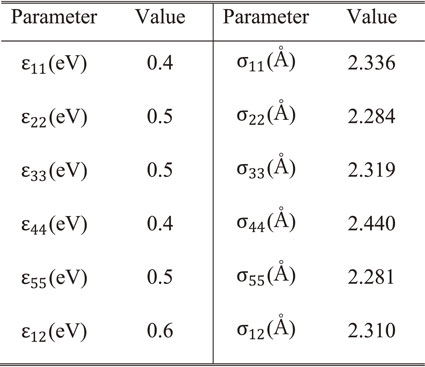
Table 4 LJ parameters for the quinary alloy considering CSRO. The average Burgers vector b is computed from the supercell size after the volumetric relaxation.
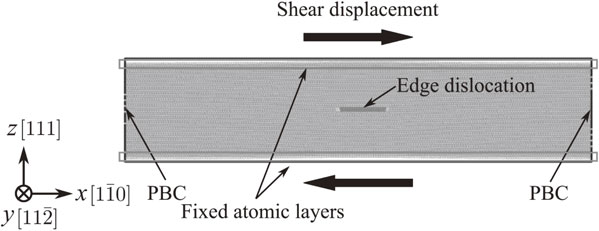
The simulation supercell used for CRSS computation is depicted in Fig. 3, which consists of the FCC HEA structures (the random and the CSRO structures) along $x = [1\bar{1}0]$, $y = [11\bar{2}]$ and z = [111] with a size of 50.9 × 21.2 × 9.8 nm3 comprising of ∼920,000 atoms. One edge dislocation was inserted on the [111] plane. The periodic boundary conditions were applied in the x and the y directions, and free surface boundary condition was applied in the z-direction. The MD simulation supercell and atomic structure were fully relaxed at pressure, P = 0 Pa in the x and y directions and at temperature, T ∼ 0 K. The three atomic layers on both the upper and the lower boundaries were treated as rigid bodies, and then shear strain was applied by applying incremental relative displacement of 0.005 nm on the upper rigid body to the lower body. The atomic structure was relaxed using the conjugate gradient method with a force tolerance of 0.001 eV/Å after each incremental relative displacement. The applied shear stress is estimated from the reaction force acting on the rigid shifting body over the cross-sectional area of the model in the ⟨111⟩ direction. The CRSS is estimated as the shear stress acting when the dislocation starts to glide. In the CRSS computation, for each case we took an average of at least five CRSSs computed using five different atomic structures with the same energy and CSRO (randomness) level.
3. Results and Discussions
3.1 CRSS vs RMSAD
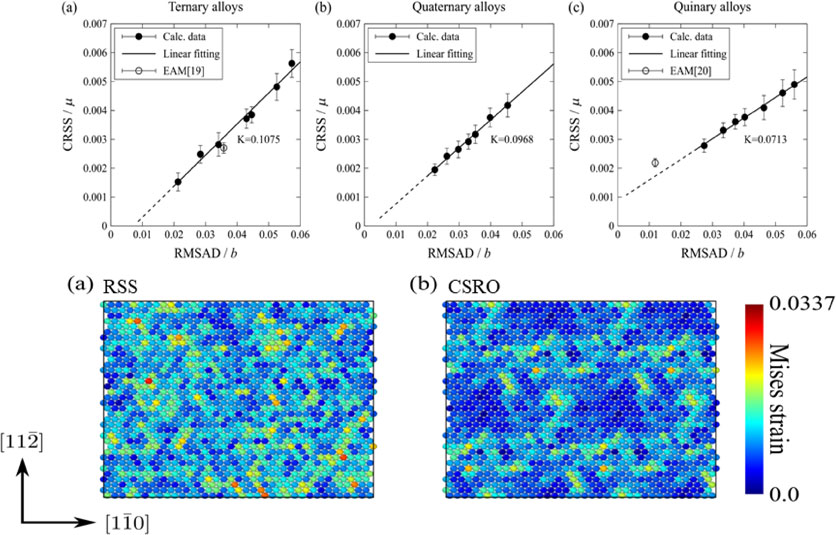
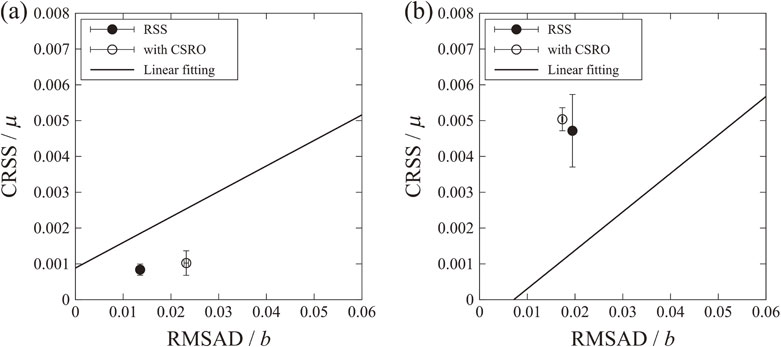
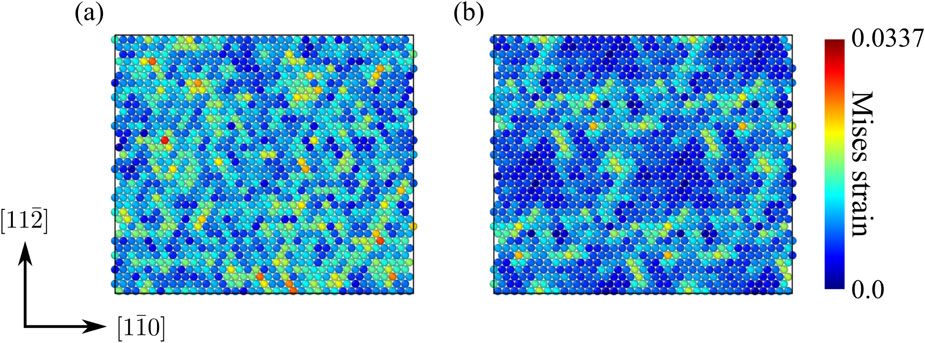
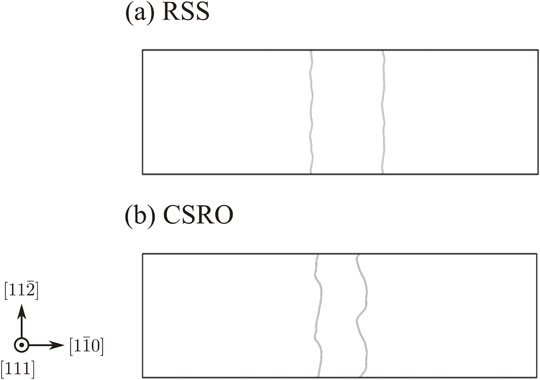
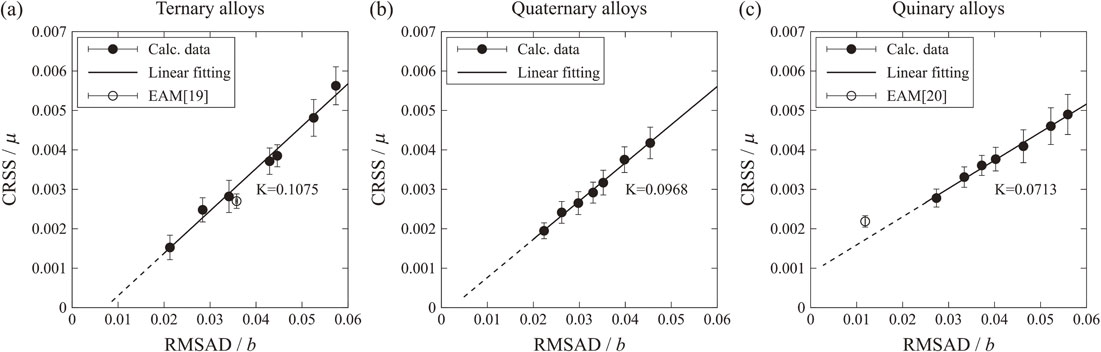
Figure 4 shows the relationship between the computed CRSS and RMSAD of the examined RSS alloys. For a fair comparison, each of the CRSS was normalized by the shear modulus of the model, and each RMSAD was normalized by average Burgers vector length. The relationship between the CRSS and the RMSAD for all the RSS alloy models were linear. The higher the RMSAD of the alloy, the higher the CRSS, regardless of the system being a ternary, quaternary, or quinary alloys. Note that the slope tends to decrease with increasing the number of elements. The fact maybe because of the spatial overlap between potential wells of the dislocation motion induced by the lattice distortion, which becomes more significant in the HEA having a larger number of different elements. The overlap should then lead to a milder relief in the fused potential landscape consists of the potential wells. To further confirm the universality of the linear relation, we also plotted the CRSS with existing embedded atom method (EAM) potential.19,20) We found these data also followed a linear relation. However, the CRSS relationship for the RSS alloy (before MC relaxation) and the alloy with CSRO (after MC relaxation) alloy systems does not generally follow the linear relation as seen in Fig. 5. The quinary LJ alloys have almost the same CRSS even have quite different RMSADs. The EAM alloys13) show the totally opposite trend. Figure 6 shows local Mises atomic strain distribution21) in the RSS alloys and the alloy with CSRO. The alloy with CSRO mostly had lower atomic strain than the alloys without CSRO. The alloy with CSRO had a mesoscale pattern of a localized higher atomic strain region, suggesting that the atomic structure was stabilized by the formation of strong bonds between type 1 and type 2 atoms. It also suggests the release of the average atomic strain, and thus the release of the atomic strain energy of the system. Meanwhile, the strong bonds formed between type 1 and type 2 atoms enabled the formation of the localized higher atomic strain region, and distorted the dislocation glide motion such as pinning effect, leading to the higher CRSS. Figure 7 shows the dislocation shape just before the glide motion for each alloy. The wavy and narrower dislocation core shape can be seen in the CSRO alloy, suggesting dislocation pinning resulted from the strong bond between the type 1 and type 2 atoms. Hence, to correctly predict the CRSS with CSRO, the in-glide-plane distribution of the local shear resistance or stacking faults energies must be directly estimated rather than the volume average of geometrical distortion like the RMSAD, and then one may construct an in-glide-plane shear hardening model based on the distribution.
4. Summary and Conclusion
In this paper, we have demonstrated that there exists a universal liner relationship between the CRSS and RMSAD (atomic distortion from FCC on-lattice). Using molecular dynamics simulations with RMSAD controlled LJ potentials, we were able to show that the higher RMSAD of the equiatomic ternary, quaternary, and quinary RSS alloys alloy, the higher CRSS. On the other hand, alloys with CSRO and alloys without CSRO do not follow the linear relation. This is because during the CSRO formation process, the atomic strain is released which reduces the total strain energy and thus changes the RMSAD, while a localized higher atomic strain region appeared. Meanwhile, strong bonds are formed which leads to a higher CRSS.
Acknowledgments
This work was supported by Element Strategy Initiative for Structural Materials (ESISM) of MEXT, Grant Number JPMXP0112101000. S.O. acknowledges the support by the JSPS KAKENHI Grant Nos. JP18H05450, JP18H05453, JP17H01238 and JP17K18827. S.S. acknowledges the support by the JSPS KAKENHI Grant No. JP19K23487.
REFERENCES
- 1) B. Gludovatz, A. Hohenwarter, D. Catoor, E. Cheng, E. George and R. Ritchie: Science 345 (2014) 1153.
- 2) A. Gali and E. George: Intermetallics 39 (2013) 74.
- 3) F. Otto, A. Dlouhy, C. Somsen, H. Bei, G. Eggeler and E. George: Acta Mater. 61 (2013) 5743.
- 4) M. Chuang, M. Tsai, W. Wang, S. Lin and L. Yeh: Acta Mater. 59 (2011) 6308.
- 5) Z. Zhang, M. Mao, J. Wang, B. Gludovatz, Z. Zhang, S. Mao, E. George, Q. Yu and R. Ritchie: Nat. Commun. 6 (2015) 10143.
- 6) Y. Zou, H. Ma and R. Spolenak: Nat. Commun. 6 (2015) 7748.
- 7) R. Sriharitha, B. Murty and R. Kottada: J. Alloy. Compd. 583 (2014) 419.
- 8) N. Okamoto, K. Yuge, K. Tanaka, H. Inui and E. George: AIP Adv. 6 (2016) 125008.
- 9) I. Toda-Caraballo and P. Rivera-Diaz-del-Castillo: Acta Mater. 85 (2015) 14.
- 10) I. Toda-Caraballo, E. Galindo-Nava and P. Rivera-Diaz-del-Castillo: Acta Mater. 75 (2014) 287.
- 11) Y. Zhao and T. Nieh: Intermetallics 86 (2017) 45.
- 12) Y. Ye, C. Liu, H. Wang and T. Nieh: Acta Mater. 147 (2018) 78.
- 13) Q.-J. Li, H. Sheng and E. Ma: Nat. Commun. 10 (2019) 3563.
- 14) J. Ding, Q. Yu, M. Asta and R. Ritchie: Proc. Natl. Acad. Sci. USA 115 (2018) 8919.
- 15) F. Zhang, S. Zhao, K. Jin, H. Xue, G. Velisa, H. Bei, R. Huang, J. Ko, D. Pagan, J. Neuefeind, W. Weber and Y. Zhang: Phys. Rev. Lett. 118 (2017) 205501.
- 16) S. Plimpton: J. Comput. Phys. 117 (1995) 1.
- 17) J. Cowley: Phys. Rev. 77 (1950) 669.
- 18) B. Warren: X-Ray Diffraction, (Dover Publications, New York, 1990).
- 19) G. Bonny, R. Pasianot, N. Castin and L. Malerba: Philos. Mag. 89 (2009) 3531.
- 20) D. Farkas and A. Caro: J. Mater. Res. 33 (2018) 3218.
- 21) F. Shimizu, S. Ogata and J. Li: Mater. Trans. 48 (2007) 2923.
- 22) A. Stukowski, V. Bulatov and A. Arsenlis: Model. Simul. Mater. Sci. Eng. 20 (2012) 085007.