Materials Chemistry
Photoluminescence from Anodic Aluminum Oxide Formed via Etidronic Acid Anodizing and Enhancing the Intensity
2020 Volume 61 Issue 6 Pages 1130-1137

Details
2020 Volume 61 Issue 6 Pages 1130-1137
Photoluminescence (PL) emission from anodic aluminum oxide (AAO) formed by etidronic acid anodizing was investigated via fluorescence spectroscopy. Highly pure aluminum plates were anodized in an etidronic acid solution under various operating conditions. PL emission from the typical AAO film was identified with an approximately 250–275-nm range in excitation and a 375–450-nm range in emission, and this distribution was greatly different from the AAO film formed by typical carboxylic acid treatment. The PL intensity increased with the decrease of the concentration of etidronic acid solution. The intensity also increased with anodizing time and subsequent thermal treatment, whereas excess anodizing and high temperature treatment caused an intensity decrease. The AAO film consisted of an outer oxide containing incorporated etidronate anions and a thin honeycomb inner oxide without anions, and the oxygen vacancy localized in the AAO film and anion distribution strongly affected the PL intensity. The appropriate operating condition through anodizing in 0.05 M etidronic acid for 40 h and subsequent thermal treatment at 773 K for 2 h caused the maximum enhancement of the PL emission.

Anodizing aluminum in several acidic electrolyte solutions causes the formation of anodic aluminum oxide (AAO) with a nanoscale honeycomb structure.1–4) Characteristic chemical, physical, and mechanical properties, such as corrosion resistance, hardness, wear-resistance, superhydrophilicity, superhydrophobicity, adhesion, and ordered nanostructure synthesis, can be obtained on the aluminum surface via anodizing.5–15) Photoluminescence (PL) of the AAO film was actively investigated by Tajima et al. in the 1970s and 1980s as one of unique optical properties.16,17) The AAO films formed by anodizing in carboxylic acid solutions, such as oxalic, malonic, tartaric, citric, and malic acid, exhibit bluish PL emission under ultra-violet (UV) irradiation.18–25) The PL intensity from the AAO film formed by oxalic acid anodizing is considerably higher than that of alumina formed by other carboxylic electrolytes.16) In addition, minuscule PL emission can be observed from the AAO film formed by other typical electrolytes, such as sulfuric, phosphoric, and chromic acid.16,26–31)
Although the mechanism of PL emission from the AAO film is still unclear, the following two origins are considered: F+ centers based on the oxygen vacancies in the alumina and F centers based on the anion vacancies incorporated from the electrolyte solution during anodizing.25) Because the PL intensity strongly depends on the electrolyte species used during anodizing as described above, the discovery of an additional AAO film with a novel incorporated anion, which is different from carboxylic acids, would cause the novel PL behavior and expand the applicability of AAO.
In the present investigation, we report novel PL emission of AAO formed via anodizing in a new electrolyte, etidronic acid (1-hydroxyethane-1,1-diphosphonic acid, C2H8O7P2). It was previously reported that etidronic acid causes high voltage anodizing, measuring more than 200 V, and the formation of ordered AAO with a large-scale cell size (interpore distance) and pore diameter.32–39) Etidronate ions were incorporated into AAO during anodizing under a high electric field, and we observed that the AAO film exhibited a unique PL emission with different excitation and emission wavelengths. In this study, we describe in detail the PL emission behavior of the AAO film formed via etidronic acid anodizing under various operating conditions. Moreover, enhancement of the PL intensity could be achieved by choosing an appropriate anodizing condition.
Highly pure aluminum plates (99.999 mass%, 0.25–1.0 mm thick, GoodFellow, UK) were used as the starting materials. The specimens were cut into 10 mm or 20 mm × 20 mm pieces with a handle for an electric contact and were ultrasonically degreased in ethanol for 10 min at room temperature. After ultrasonication, the lower half of the handle was covered with a silicone resin (KE45W, Shin-Etsu, Japan) to avoid electrochemical reactions on the handle. The resin-coated specimens were anodically polished in a 78 vol% CH3COOH/22 vol% 70%-HClO4 solution at 280 K and 28 V for 1 min.
2.2 Etidronic acid anodizingThe electropolished specimens were immersed in 0.02–2.0 M etidronic acid solutions (volume: 130 mL, solution temperature: T = 293 K, Tokyo Chemical Industry, Japan) and were anodized at a constant current density of j = 20 Am−2 for up to 80 h. Because the excess current density during high-voltage anodizing such as etidronic acid causes oxide burning with many cracks, the current density was adjusted to 20 Am−2.39) A platinum plate (26 mm × 25 mm, 99.95 mass%, Furuya Metal, Japan) was used as the cathode, and the solution was stirred at 250 rpm and using a cross-head magnetic stir bar. A direct power supply (PWR400H, Kikusui Electronics, Japan) was used for anodizing, and the corresponding voltage was measured using a digital multimeter (DMM4040, Tektronix, USA) connected to a personal computer. To compare the PL emission behaviors, the electropolished specimens were also anodized in typical electrolytes, such as 0.3 M sulfuric, oxalic, phosphoric, and phosphonic acid solutions at 293 K and 20 Am−2 for 2 h.
Two-step constant voltage anodizing was performed for the fabrication of ordered AAO.32,34) The electropolished aluminum specimens were anodized at a constant voltage of U = 255 V and 293 K for 20 h (first anodizing). In this experiment, the voltage was linearly increased to 255 V for the first 2.5 min, and the solution was stirred at 1200 rpm to avoid the oxide burning phenomenon as much as possible. The AAO film then was chemically dissolved in a 0.2 M CrO3/0.51 M H3PO4 solution at 353 K to form an ordered aluminum dimple array. Finally, the specimens were anodized once again in 0.3 M etidronic acid at 255 V and 288 K for 2 h to obtain ordered AAO (second anodizing).
2.3 Post-treatment of the anodized specimensThe ordered AAO film formed via two-step acid anodizing was immersed in 1.0 M etidronic acid at 298 K (volume: 130 mL, rotation speed: 250 rpm) for up to 75 h to expand the diameter of the nanopores in the AAO film (pore-widening). Several anodized specimens were placed in an electric muffle furnace (FO100, Yamato Scientific, Japan), and thermal treatment was performed at 423–1073 K for up to 6 h under the ambient atmosphere.
2.4 Characterization of the anodized specimensThe surfaces and cross-sections of the anodized specimens were examined by field emission scanning electron microscopy (FE-SEM, JSM6500F, JEOL, Japan). For the cross-sectional observations, the anodized specimens were embedded in an epoxy resin, polished mechanically with SiC papers, and buffed with a diamond polishing paste. A thin platinum electro-conductive layer was coated on the specimens by a platinum sputter coater before the SEM observations (MSP-1S, Vacuum Device, Japan).
The amount of phosphorus incorporated in the AAO film was examined by field emission electron probe microanalysis (FE-EPMA, JXA-8530F, JEOL). For the EPMA analysis, the AAO film measuring 8 µm in thickness was formed by anodizing, and a thin carbon electro-conductive layer was coated onto the specimens (VC-100, Vacuum Device).
The anodized specimens were also examined by image-aberration-corrected scanning transmission electron microscopy (STEM, Titan G2 60-300, 60 kV, FEI). Details of the specimen preparations using a precision ion polishing system (PIPS, 5 kV, Gatan) have been described elsewhere.34) Elemental distribution maps of aluminum, oxygen, and phosphorus in the AAO film were obtained by energy-dispersive X-ray spectroscopy (EDS). The oxygen vacancies formed in the AAO film were examined by electron energy-loss spectroscopy (EELS).
The PL emission from the AAO film was examined by a fluorescence spectrometer (FP-8300, JASCO) with a 150 W xenon lamp as the excitation source (excitation range: 250–600 nm, emission range: 250–600 nm).
The electropolished aluminum specimens were anodized in sulfuric (H2SO4), oxalic ((COOH)2), phosphoric (H3PO4), phosphonic (H3PO3), and etidronic acid (C2H8O7P2) solutions under the same operating conditions (concentration: 0.3 M, temperature: 293 K, current density: 20 Am−2, anodizing time: 2 h), and the surface appearance of the anodized specimens under white light is shown in Fig. 1(a). Here, the thickness of the AAO films was approximately 9 µm (see Fig. 6(b)). The AAO films formed by each anodizing exhibited a colorless (sulfuric), a very light yellowish color (oxalic), a grayish color (phosphoric), a light grayish color (phosphonic), and a dark grayish color (etidronic), respectively. These different appearances are due to the incorporation of each electrolyte anion (i.e., SO42−, (COO)22−, PO43−, HPO32−, and C2H4O7P24−) into the AAO film via the high electric field during anodizing.

Surface appearances of the specimen anodized in 0.3 M sulfuric, oxalic, phosphoric, phosphonic, and etidronic acid solutions at 293 K and a constant current density of 20 Am−2 for 2 h under (a) white light and (b) 254 nm UV irradiation.
Figure 1(b) shows the surface appearance of the specimens under UV (254 nm wavelength) irradiation. The AAO film formed by oxalic acid anodizing exhibited dark blue PL emission under UV irradiation, and no PL emission was observed from the AAO film formed by sulfuric, phosphoric, and phosphonic acid anodizing. Interestingly, the AAO film formed by etidronic acid anodizing exhibited a light blue PL emission under UV irradiation. Notably, the intensity of the PL emission from the etidronic acid is higher than that from the oxalic acid.
Figure 2 shows excitation-emission-intensity maps of the AAO film formed by anodizing in (a) oxalic acid, (b) phosphoric acid, and (c) etidronic acid solutions shown in Fig. 1. In the map for AAO formed in oxalic acid (Fig. 2(a)), PL emission was identified for excitation at approximately 300–450 nm with a 375–525 nm range in emission. Especially, intense blue PL emission with a center wavelength of approximately 450 nm was measured by excitation at 370 nm. For phosphoric acid (Fig. 2(b)), extremely weak PL emission was measured at the same excitation-emission region. Interestingly, the excitation-emission-intensity map obtained by the etidronic acid anodizing was completely different from the oxalic acid anodizing (Fig. 2(c)). The excitation wavelength was shifted to below 400 nm, and a strong PL emission at approximately 375–450 nm was measured for 250 nm excitation. The PL intensity at the peak emission wavelength was 1.3 times larger than that obtained for the sample produced by oxalic acid anodizing. Because the AAO film formed by etidronic acid anodizing exhibits strong PL emission, the PL behaviors of the AAO film formed by various operating conditions were investigated in detail.
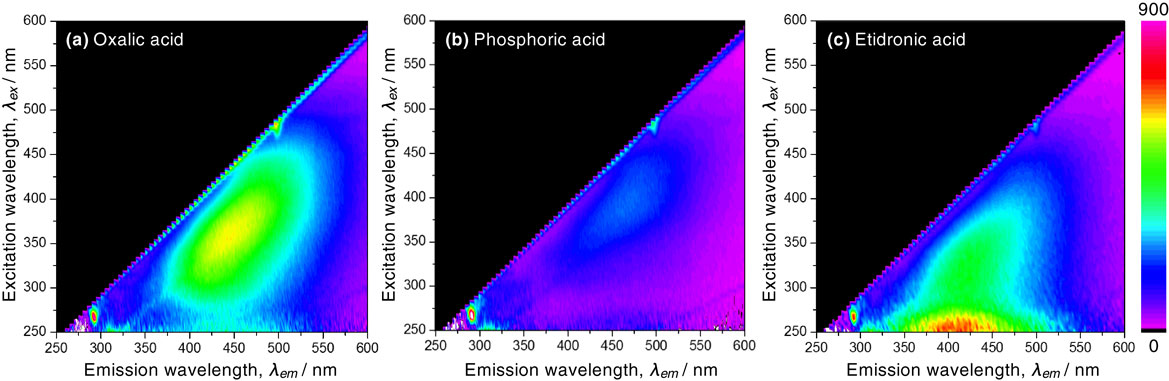
Excitation-emission-intensity maps of the AAO film formed via anodizing in (a) oxalic acid, (b) phosphoric, and (c) etidronic acid solutions. The right scale bar indicates the relative intensity of the PL emission.
To understand the effect of the etidronic acid concentration on the PL emission, the electropolished aluminum specimens were anodized in various concentrations of etidronic acid solution. Figure 3(a) shows the changes in the voltage, U, with the time, ta, during anodizing aluminum in 0.02–2.0 M etidronic acid solutions at 293 K and a constant current density of j = 20 Am−2 for 120 min. In a high concentration of etidronic acid solution (2.0 M), the voltage initially increased to approximately 220 V, decreased slightly to 160 V, and later maintained a steady value during further anodizing. The shape of the voltage-time curve can typically be obtained via the growth of the AAO film under the constant current anodizing.1) The steady value after the initial stage increased gradually with the concentration decrease of etidronic acid (ce = 1.0 M to 0.05 M); thus, the thickness of the barrier layer and the average cell size (interpore distance) of the AAO film also increased with the concentration decrease.3) A highest plateau voltage measuring approximately 235 V was achieved in the lower concentration of etidronic acid solution (0.05 M). However, unstable oscillations were measured in 0.02 M etidronic acid, although the voltage further increased to 255–295 V.

(a) Changes in the voltage, U, with the time, ta, during anodizing in 0.02–2.0 M etidronic acid solutions at 293 K and 20 Am−2 for 2 h. Surface appearances of these anodized specimens under white light and 254 nm UV irradiation are shown in (b) and (c), respectively.
Figure 3(b) shows the surface appearance of the specimens anodized in 0.02–2.0 M etidronic acid solutions for 120 min. Similar light grayish and lustrous AAO films were observed on the aluminum surface through the 0.05–2.0 M etidronic acid solutions. However, more than half of the aluminum surface was covered with a non-uniform burned oxide layer with dark grayish hues when anodizing in a 0.02 M solution due to the burning phenomenon caused by the high electric field applied locally. Interestingly, as the specimens were irradiated with 254 nm UV light (Fig. 3(c)), the PL emission increased gradually with the concentration decrease: strong PL emission can be observed from the AAO film formed in a 0.05 M solution, but weak visible PL emission was obtained that formed in a 2.0 M solution. In addition, the dark grayish burned oxide formed in the 0.02 M solution exhibited weak, non-uniform PL emission. The excitation-emission-intensity of these AAO films was measured by fluorescence spectrometry.
Figure 4(a) shows the changes in the PL intensity of the AAO film formed in 0.05–2.0 M etidronic acid solutions, IPL, with the emission wavelength, λem, under 265 nm UV irradiation. The emission intensity measured over the whole wavelength range increased with the concentration decrease, although the intensity was almost unchanged for the higher concentrations above 1.0 M. The peak emission wavelengths were constant, measuring approximately 410 nm in both concentrations. The changes in the peak emission intensity of each fluorescence spectrum, λPem, and the maximum intensity (i.e., the PL intensity at λPem), Imax, with the concentration of etidronic acid, ce, are summarized in Fig. 4(b). The maximum intensity increased with the concentration decrease, and the value obtained in 0.05 M was approximately two times larger than in 2.0 M; Imax = 390 arb. unit in ce = 2.0 M to 750 arb. unit in 0.05 M. These intensities are in good agreement with the visible surface appearances under 254 nm UV irradiation (Fig. 3(c)).

(a) Changes in the PL intensity from the AAO film formed in 0.05–2.0 M etidronic acid solutions, IPL, with the emission wavelength, λem, under 265 nm UV irradiation. (b) The changes in the peak emission wavelength, λPem, and the maximum PL intensity, Imax, with the concentration of etidronic acid solution, ce.
The etidronate anions in the electrolyte solution are incorporated into the AAO film during anodizing due to the high electric field applied to the barrier oxide.34,36) Because etidronic acid (C2H8O7P2) possesses two phosphorous atoms in its molecular structure, the amount of the incorporated anions into the AAO film can be measured by EDS. Figure 5 shows the change in the phosphorous content, cp, with the concentration of the etidronic acid solution, ce. In this experiment, the aluminum, oxygen, and phosphorus were measured by EDS to calculate the atomic ratio. The AAO film formed in 0.05 M etidronic acid consisted of Al2O3 containing approximately 1.1 at% phosphorous. The phosphorous amount increased gradually with the concentration of etidronic acid used; thus the incorporated etidronate anions also increase with the concentration. This incorporated anion increase is in good agreement with the other typical anodizing solutions, such as sulfuric acid. The PL emission intensity increased as the amount of the incorporated anion decreased.

Change in the phosphorous content in the AAO film, cp, with the concentration of the etidronic acid solution, ce.
To understand the effect of the anodizing time and the AAO thickness on the PL emission, the electropolished aluminum specimens were anodized in 0.3 M etidronic acid at 293 K and 20 Am−2 for 1–80 h. Figure 6(a) shows SEM images of the surface of the anodized specimens. Many disordered nanopores measuring approximately 100 nm in diameter were observed on the whole surface of the specimen anodized for 1 h. The diameter of the pores increased gradually with the anodizing time, and large-scale pores measuring approximately 300 nm were formed on the surface after anodizing for 80 h. This finding is observed due to the chemical dissolution of the anodic oxide around the pores into the etidronic acid solution via long-term anodizing. From the observations of the vertical cross-section of the anodized specimen, the thickness of the AAO film increased linearly with anodizing time up to 80 h, and the growth rate can be calculated as 4.5 µmh−1 (Fig. 6(b)). A thick AAO film measuring 365 µm was formed by anodizing for 80 h.

(a) SEM images of the surface of the AAO film formed by anodizing in 0.3 M etidronic acid at 293 K and 20 Am−2 for up to 80 h. (b) The change in the thickness of the AAO film, δ, with the anodizing time, ta. (c) The changes in the peak emission wavelength, λPem, and the maximum PL intensity, Imax, with the anodizing time, ta, under the 265 nm UV irradiation.
Figure 6(c) shows the changes in the peak emission intensity, λPem, and the maximum intensity, Imax, with the anodizing time, ta, under 265 nm UV irradiation. The peak emission wavelength exhibited similar values measuring 412–415 nm for each anodizing specimen. On the other hand, the maximum PL intensity increased with the anodizing time, exhibited a maximum value of 1450 arb. unit when anodized for 40 h, and later decreased with the anodizing time. PL intensity increased with the thickness of the AAO film measuring up to approximately 175 µm, although the excess anodizing process causes the decrease of PL intensity. This finding may be attributable to the chemical dissolution of the outer anodic oxide during long-term anodizing. The effect of the oxide dissolution on the PL emission was investigated using an ordered AAO in the next section.
3.4 Effect of the pore-widening process on the PL emissionTwo-step constant voltage anodizing causes the formation of ordered AAO. An ordered AAO film was fabricated via two-step anodizing in 0.3 M etidronic acid at a constant voltage of 255 V (first anodizing: at 293 K for 20 h, second anodizing: at 288 K for 2 h). This specimen then was immersed in 1.0 M etidronic acid at 298 K for up to 75 h to uniformly expand the pore diameter (pore-widening), and corresponding SEM images of the surface of the specimens are shown in Fig. 7(a). Ordered AAO film measuring approximately 200 nm in pore diameter was observed on the surface, formed by two-step anodizing. As the specimen was immersed in 1.0 M etidronic acid for 15 h, the diameter of the pores increased to 290 nm by the chemical dissolution of anodic oxide. In addition, light gray honeycomb cell boundaries were revealed around the pores. Although the pores expand circularly with immersion time until 45 h, a honeycomb structure with narrow alumina walls was formed by long-term immersion for 75 h. This chemical dissolution behavior is due to the incorporated anion distribution originating from the electrolyte during anodizing.34) The anodic oxide containing etidronate anions dissolves isotropically, and then hexagonal alumina walls without anions remain due to their slow dissolution rate.

(a) SEM images of the surface of the ordered AAO film formed by anodizing and subsequent pore-widening. Two-step anodizing was carried out in 0.3 M etidronic acid (first: at 293 K for 20 h, second: at 288 K for 2 h), and then the specimens were immersed in 0.3 M etidronic acid at 293 K for up to 75 h. (b) The changes in the peak emission wavelength, λPem, and the maximum PL intensity, Imax, with the pore-widening time, tp, under the 265 nm UV irradiation.
Figure 7(b) shows the changes in the peak emission wavelength, λPem, and the maximum intensity, Imax, with pore widening time, tp, under 265 nm UV irradiation. The maximum intensity decreased gradually with the pore widening time, but it was nearly unchanged by pore-widening after 45 h. In addition, the peak emission wavelength was shifted to approximately 300 nm from 420 nm by pore-widening, whereas it was maintained a steady value of 420 nm with the changing of the concentration and the anodizing time (Figs. 4(b) and 6(c)). This PL emission may correspond to the different dissolution behavior of the anodic oxide with/without incorporated anions. Therefore, it is considered that the origin of the PL emission is different for constituent layer (i.e., the outer oxide containing etidronate anions and the inner oxide without anions).
Figure 8(a) shows a HAADF-SETM image and the corresponding STEM-EDS elemental distribution maps of aluminum, oxygen, and phosphorus contained in the AAO film before the pore-widening shown in Fig. 7(a). In the HAADF-STEM image, light gray cell boundaries measuring approximately 80 nm in width are observed between the pores. From the elemental distribution images, it is clear that this light gray contrast corresponds to the phosphorus distribution incorporated in the AAO film.

(a) HAADF-STEM image and the corresponding STEM-EDS elemental maps of aluminum, oxygen, and phosphorous for the AAO film formed by two-step anodizing at 255 V. (b) EELS spectra of 12 points in the porous alumina shown in (a).
The EELS spectra were linearly measured across the anodic alumina layer between the pores (i.e., 12 points shown in the HAADF-STEM image) and are described in Fig. 8(b). An oxygen K-edge peak corresponding to oxygen in the anodic oxide was measured at 540 eV from the whole EELS spectra. In addition, a strong satellite peak corresponding to the oxygen vacancies localized in the anodic oxide was also found at 530 eV.40) However, the intensity of this satellite peak measured in the cell boundary without anions (i.e., No. 6 and 7) was clearly lower than that in the other anodic oxide with anions (i.e., No. 1–5 and 8–12). Therefore, the shift in the peak emission wavelength during pore-widening (to 300 nm from 420 nm, Fig. 7(b)) may correspond to the oxygen vacancy decrease. In addition, these EELS spectra suggest that the PL emission behavior from the AAO film is changed by the presence or absence of the etidronate anions.
3.5 Effect of the thermal treatment on the PL emissionWe found that thermal treatment of AAO caused a further increase in the PL intensity. An AAO film was formed via anodizing in 0.3 M etidronic acid at 293 K and 20 Am−2 for 2 h and was then subjected to thermal treatment in ambient atmosphere at 473–1073 K for 2 h. Figure 9(a) shows the effect of thermal treatment temperature on the PL emission behavior under 265 nm UV irradiation. The peak emission wavelength maintained a steady value during thermal treatment at 473–1073 K, whereas the maximum PL intensity increased with temperature, exhibited a peak value at 773 K, and then decreased significantly with temperature. Similar behavior has also been measured for the AAO film formed by anodizing in oxalic acid.16) The effect of the thermal treatment time on the PL emission behavior is shown in Fig. 9(b). The maximum PL intensity increased with time in the initial stage of thermal treatment. However, additional thermal treatment for 4–6 h causes a slight decrease of the intensity. Therefore, enhancing the PL intensity can be achieved by short-term thermal treatment.

(a) Changes in the peak emission wavelength, λPem, and the maximum PL intensity, Imax, with the thermal treatment temperature, T, under the 265 nm UV irradiation. (b) The changes in the peak emission wavelength, λPem, and the maximum PL intensity, Imax, with the thermal treatment time, th, under 265 nm UV irradiation.
In summary, we first reported the PL emission behavior of AAO formed via anodizing in etidronic acid solution. A unique PL emission measuring approximately 410–420 nm in emission wavelength under 265 nm UV irradiation, which is different from the conventional carboxylic acid anodized material, was obtained by etidronic acid anodizing. Enhancing the PL intensity from the AAO film can be achieved by optimization of the anodizing conditions and post thermal treatment. The AAO film formed by typical constant current anodizing in 0.3 M etidronic acid for 2 h exhibited PL emission measuring 689.4 in maximum intensity. The intensity became approximately 1.09 times larger with a low concentration of etidronic acid (0.05 M), 2.11 times larger with an appropriate anodizing time (40 h), and 1.25 times larger by thermal treatment (773 K, 2 h). Consequently, the appropriate operating conditions for anodizing in 0.05 M for 40 h and subsequent thermal treatment at 773 K for 2 h caused the 2.70-fold enhancement of the PL emission. Recently, AAO is widely investigated in the field of photodevices such as photonic crystals41) and organic light emitting diodes.42) Anodizing aluminum is a cost-effective coating process of anodic aluminum oxide on the substrate in the industrial applications. Our PL emission of AAO formed via etidronic acid anodizing may be used as these photonic materials, thus further investigations are required.
We investigated the PL emission behavior from AAO fabricated by anodizing aluminum in etidronic acid solution. The following conclusions were drawn from the results of the present investigation.
This study was conducted at Hokkaido University and was supported by the “Nanotechnology Platform” Program of the Ministry of Education, Culture, Sports, Science, and Technology (MEXT), Japan. The authors wish to thank Mr. Nobuyuki Miyazaki, Dr. Takashi Endo (Laboratory of Nano-Micro Material Analysis, Hokkaido University), and Mr. Ryo Oota (High-Voltage Electron Microscope Laboratory, Hokkaido University) for their assistance with the SEM/STEM observations and EPMA analysis. This study was financially supported by the Light Metal Educational Foundation, Japan, and the Japan Society for the Promotion of Science (JSPS) “KAKENHI”.