Mechanics of Materials
Strain Softening of Siltstones in Consolidation Process
2020 Volume 61 Issue 6 Pages 1096-1101
Details
2020 Volume 61 Issue 6 Pages 1096-1101
Strain softening is the mechanical behavior of soil and rock materials and is important in understanding soft rock foundation. To investigate the mechanical behavior of siltstone, a sedimentary soft rock, consolidation tests using constant-strain rate loading were conducted using the consolidation ring to constrain lateral deformation. Using Quaternary siltstones distributed in the Boso Peninsula, central Japan as specimens, strain softening in the consolidation process was confirmed in some formations using two test machines at Kyoto University and Nagoya Institute of Technology. Just before the yielding, stress decreased suddenly at increasing strain. The stress at the time of the softening differed even for specimens taken from the same formation. Furthermore, micro-focus X-ray CT images taken before and after the tests indicated that the specimens had no macro cracks inside. This suggests that strain softening is not due to brittle failure in local areas but due to the softening of the framework structure of the siltstone itself.
This Paper was Originally Published in Japanese in J. Soc. Mater. Sci., Japan 69 (2020) 250–255.

The mechanical behavior of rock masses comprising hard rocks is based on geological weak planes such as joints, fractures and faults. However, that of soft rocks is dominated by the mechanical properties of the rock itself. Because soft rocks have different physical properties to hard rocks, it is essential to understand the mechanical behavior of soft rocks when tunnels and huge structures are constructed in these. Neogene and Quaternary sedimentary rocks generally considered as soft rocks are distributed throughout Japan. Sedimentary soft rocks are softer than hard rocks and their physical properties lie between those of soil and rocks.1)
Understanding strain softening is important for understanding the mechanical characteristic of soft rocks. In general, strain increases as stress increases with loading. However, strain softening is a phenomenon in which the stress does not increase with loading after the stress reaches a certain value, or the strain increases significantly for a small stress increase. The phenomenon is often observed at shearing of dense sands, over-consolidated clay and soft rocks, and is closely related to the progressive failure discussed in various geotechnical problems. Mechanical models using numerical analysis have been calculated.2,3) Triaxial compression tests have been conducted using sedimentary soft rocks such as porous tuff4,5) and diatomaceous soft rocks,6) which have clarified their mechanical properties. Akai et al.4) and Adachi et al.5) conducted triaxial compression tests using Oya stone, a porous tuff and clarified that the elastoplastic behavior, dilatancy and time dependence of the soft rock are characterized by the intermediate properties between soft soil and hard rock. Adachi and Oka7) constructed constitutive equations for elastoplastic behavior of strain softening of soft rocks and considered that strain softening is caused by both localization of deformation and softening of the rock material itself. They compared the models with results of experiments and described that the phenomena in both the models and results were consistent. Furthermore, Zhang et al.8) and Iwata et al.9) improved these constitutive equations and compared them with actual phenomena. However, there are currently no reports of strain softening observed in consolidation tests.
There are a number of ways to view the term “strain softening.” When the softening occurred during loading of the rock material, shear bands simultaneously form in the loaded specimens. Therefore, this softening is not “strain softening”, but is recognized as a phenomenon caused by plastic hardening of the material and localization of deformation such as formation of shear bands. Debate around this was mostly in the 1980s and 1990s, but has not yet been finalized. Considering this background, we focused on the softening behavior of soft rocks and performed consolidation tests to verify whether this phenomenon is an essential property of the ground material itself (that is, an element property) or a boundary variation of deformation localization. Kamiya et al.10) conducted consolidation tests using sedimentary soft rocks taken from the Boso Peninsula to elucidate the generation of abnormal pore water pressure during development of the forearc basin. Consequently, a phenomenon that seems to be strain softening was confirmed in advance. Therefore, consolidation tests were performed with the large number of samples taken from Quaternary layers in the Boso Peninsula to confirm and elucidate strain softening. In this study, the reproducibility of the phenomenon was also confirmed using different equipment.
Neogene siltstone is relatively weak as a rock and is generally classified as a soft rock. Natural siltstones have a consolidation fabric in which clay minerals are oriented parallel to the geological bedding plane, include volcanic crustics such as pumice and scoria and fine particles derived from microfossils like foraminifera and diatoms. Additionally, they have been hardened by diagenesis and cementation depending on the sedimentary environment. However, a high-pressure consolidation test of the siltstone under drain conditions shows a consolidation curve that is very similar to that of over-consolidated clay because its porosity is relatively high.11,12) Experimental samples used in this study are siltstones taken from central Boso Peninsula in Chiba Prefecture, central Japan. The forearc basin sediments are distributed in the middle and northern part of the Boso Peninsula (Fig. 1). The Boso forearc basin is divided in the Miocene to Pleistocene Miura Group and Kazusa Group. The boundary between the two groups is the Kurotaki Unconformity,13) a large-scale geological boundary distributed from east to west. The Kazusa Group comprises alternation of sand and mud without hydrothermal metamorphism and includes many volcanic tuff layers. Sediment thickness in the eastern Kazusa Group is greater than in the western part and some of the lower formations of the Kazusa Group (Ohara, Namihana and Katsuura formations) are distributed only in the eastern part of the basin. Consolidation tests were performed using siltstones taken from the Kiwada (BosC32), Otadai (BosC10) and Ohara (BosC26) formations. The sedimentary age of these formations is approximately 100–150 million years.14,15)

Block samples were taken from the outcrop except cracked and weathered parts. Blue-gray fresh siltstones were cut out in a block to fix direction. They were formed into a 27-mm-diameter cylinder with an axis perpendicular to the geological bedding plane and the curved surfaces of the cores were polished to a diameter of 25 mm using a cylindrical grinder. The core samples were cut to a height of ∼21 mm using a rock cutter and the top and bottom surfaces were polished using a surface grinder so that both ends are parallel and the cores were 20 mm high. The specimens were immersed in tap water in a vacuumed desiccator to saturate highly.
Density and void ratio of the specimens were measured using the buoyancy method. Specifically, the wet and submerged weights of the specimens were measured before the tests. The specimens were dried in an oven at 60°C for four days after the tests and the dry weight was measured. The equations for calculating soil particle density ρg, void ratio e and porosity φ of each specimen are as follows:
| \begin{equation} \rho_{g} = M_{\textit{dry}}/(M_{\textit{wet}} - M_{\textit{water}}) - (M_{\textit{wet}} - M_{\textit{dry}}), \end{equation} | (1) |
| \begin{equation} e = [(M_{\textit{wet}} - M_{\textit{water}}) - M_{\textit{dry}}/\rho_{g}]/[M_{\textit{dry}}/\rho_{g}]\ \text{and} \end{equation} | (2) |
| \begin{equation} \phi = (M_{\textit{wet}} - M_{\textit{dry}})/(M_{\textit{wet}} - M_{\textit{water}}), \end{equation} | (3) |
Constant strain rate consolidation tests were performed with a uniaxial compression apparatus using a rigid stainless-steel ring in a consolidation test chamber (Fig. 2). The specimens were fitted into the ring to avoid lateral expansion during loading. To reduce friction on the curved surfaces of the specimen, double Teflon sheets between which silicon grease was applied were sandwiched between the specimen and consolidation ring. The loading speed was controlled at a constant-strain rate of 0.05%/min and the maximum loading stress was 80 MPa. Unloading was performed at a constant-strain rate of 0.10%/min after the loading, which was completed when the displacement change stopped. The tests were conducted under drain conditions. The upper end of the specimen was open and connected to a volume meter to measure drained water volume to evaluate the specimen’s volume change during the consolidation test. The lower end was closed and pore water pressure was measured here. We used two apparatuses owned by Kyoto University (Fig. 2) and Nagoya Institute of Technology, Japan to analyze the reproducibility of consolidation behavior. Both apparatuses have the almost same system and specifications. Axial load, axial displacement, volume of drained water from upper end of the specimen and pore water pressure at the lower end of the specimen were measured at intervals of 1 second during the tests.
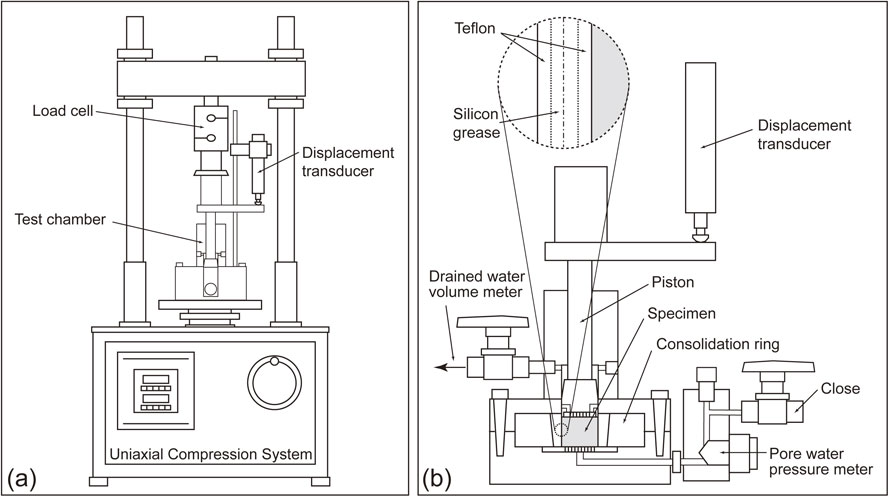
Schematic illustrations of the oedometer test apparatus at Kyoto university; (a) Compression system, (b) Test chamber.
Using measured data such as axial load and pore water pressure, consolidation curves were drawn in semilogarithmic graphs with the vertical axis representing the void ratio and the horizontal axis representing the logarithm of stress (Fig. 3(a)). Stress p on the horizontal axis was calculated from the axial compressive stress σ and pore water pressure u as follows.16)
| \begin{equation} p = \sigma - (2u/3) \end{equation} | (4) |
| \begin{equation} C_{c} = (e_{a} - e_{b})/\mathit{log}(p_{b}/p_{a}) \end{equation} | (5) |
| \begin{equation} C_{c'} = 0.1 + 0.25C_{c} \end{equation} | (6) |
| \begin{equation} C_{c''} = 0.5C_{c'} \end{equation} | (7) |

Void ratio vs. log pressure diagram showing the compression index (a) and measurement of consolidation yield stress (b).
Figure 4 shows the consolidation curves for each specimen. All specimens yielded and the consolidation curves showed over- and normal-consolidation areas. Some specimens’ stress dropped rapidly before yielding (arrows in Fig. 4(a) and (c)). The consolidation yield stresses were calculated based on Mikasa’s graphical method; the results are shown in Table 1. When the consolidation curves show a rapid stress drop, the tangents were drawn using the consolidation curves after the rapid stress drop.

Consolidation curves; (a) BosC32, (b) BosC10-N and BosC10-K, (c) BosC26-N and BosC26-K. Black line shows the test performed at Kyoto University and gray line shows the test performed in Nagoya Institute of Technology. (d) Stress vs. strain diagram of BosC26 focused on the strain softening.

The test for BosC32, taken from the eastern Kiwada Formation, was conducted with apparatus owned by Kyoto University (Fig. 4(a)). The rapid stress drop was confirmed immediately before yielding, which occurred when the stress was approximately 12.3 MPa. The initial void ratio and consolidation yield stress of BosC32 were 0.91 and 7.0 MPa, respectively.
Consolidation tests for the samples taken from the Ohara Formation (BosC26) and the western Otadai Formation (BosC10) were performed using two different apparatuses owned by Kyoto University and Nagoya Institute of Technology. Two specimens were formed from the same block sample and each test was performed using the same procedure with each apparatus. The consolidation curve of BosC10-K shifted to a decreased void ratio, which matched that of BosC10-N (Fig. 4(b)). The consolidation yield stress was 7.6 MPa for BosC10-N and 8.0 MPa for BosC10-K, which are similar. Considering that the initial void ratio was 0.74 for BosC10-N and 0.69 for BosC10-K, the difference in that is 0.05, which indicates a discrepancy in the consolidation curve, this explains the difference in the initial void ratio. Basic physical properties such as porosity and soil particle density vary among specimens even in the same geological layer because of the inhomogeneity of natural rocks. The void ratio difference of ±0.05 can be considered a natural variation. The consolidation curves for both specimens, BosC10-N and BosC10-K, were drawn smoothly from the beginning of loading to the completion of unloading, which means that rapid stress drops were not confirmed.
The consolidation curves of BosC26-N and BosC26-K taken from the Ohara Formation agree well with each other and both show the rapid stress drops just before yielding (Fig. 4(c)). Considering the strain-stress relationship around the stress drop point, the values of stress (p) at which the rapid stress drop occurred were approximately 12.3 MPa for BosC26-N and 15.0 MPa for BosC26-K (Fig. 4(d)). The consolidation yield stress (pc) of BosC26-N was 9.4 MPa and that of BosC26-K was 10.3 MPa, which means that pc of BosC26-K was about 10% larger than that of BosC26-N. The initial void ratio was 0.99 for BosC26-N and 0.97 for BosC26-K.
Figure 5 shows micro-focus X-ray CT images of BosC26-N taken before and after the test. Although small white spots were observed inside the specimen before the test, there were no large particles such as microfossil and cracks. This means that this specimen is relatively homogeneous siltstone. The small white spots are microfossils or microparticles of volcanic ash. The specimen was deformed during the test and the center part of the upper face was raised in a convex shape after the test. This deformation likely formed because the porous stone was softer than the surrounding stainless-steel part. However, CT images of the specimen that experienced high stress during the test indicated that cracks formed by deformation do not distribute in the specimen. Although strain softening of soft rock in the constant-strain rate consolidation test was not reported in previous studies, this study confirmed this phenomenon.

X-ray CT images taken before (a), (b), (c) and after (d), (e), (f) the consolidation test. The compressive axis is vertical in (b), (c), (e) and (f). The lines in each image show the cutting positions.
Consolidation tests were conducted on five samples in this study; three samples showed the rapid stress drop just before yielding. Consolidation tests for two specimens (BosC26-N and BosC26-K) from the Otadai Formation sample were performed using the apparatus owned by Kyoto University and Nagoya Institute of Technology, respectively. Similar stress reductions were observed in both tests, which suggested that this rapid stress drop was reproducible.
The rapid stress drop confirmed in this study can be regarded as a real strain softening because no strain localization could be confirmed within all specimens. In soil materials, unsaturated soils exhibit significant strain softening. Decreased strength due to a reduction in meniscus water is a cause of strain softening.18) Strain softening of the rock materials has been modeled in many elastoplastic constitutive equations, in which the softening is generally considered to be related to a decrease in stiffness and a reduction in yield surface.5) In laboratory tests, however, softening behavior observed in so called element tests usually always accompanied by the formation of shear band within the ‘element specimen’, which, in a sense, means that the so called element test is no longer an element test. Therefore, majority of the researchers related to constitutive modeling7) usually regarded the strain softening of rock materials is just an average behavior of localized deformation of shear band together with a stress reduction process in other region of the specimen, even if the rock material itself is strain hardening. In present research, however, X-ray CT images of BosC26-N before and after the test showed that particularly large particles such as pumice and fossils were not contained in the specimen. Additionally, micro cracks like brittle fractures were not found in the specimen after the test. Therefore, it was suggested that the strain softening observed in this study was attributable to softening of the siltstone itself.
Generally, siltstone has a relatively high clay mineral content. Because the friction coefficient of some clay minerals such as smectite is small,19,20) the mineral component of siltstone and their mechanical behavior might be related to strain softening. However, the Otadai and Kiwada formations contain insignificant amounts of montmorillonite, which is a type of smectite.21) XRD analysis was performed for the specimens used in this study (BosC32, 10-K and 26-K) and suggested that the clay mineral content is not significantly high.
The samples used in this study are siltstone taken from the forearc basin, whose development is related not only to consolidation but also tectonic effects such as horizontal compaction accompanied with plate subduction. Therefore, it is possible that the strain softening confirmed in this study reflects the micro cracks and internal structure that developed during siltstone formation. In the future, the micro structure of the specimen immediately after strain softening should be observed, which would enable elucidation of the softening.
As a first step to elucidate consolidation yielding, which is one mechanical behavior of siltstone, consolidation tests using consolidation rings were conducted for siltstone from the Boso Peninsula, Chiba Prefecture, central Japan. Strain softening was confirmed in the consolidation process of some specimens. This softening occurred immediately before yielding, but the stress values at softening differed even in specimens from the same block sample. Micro-focus X-ray CT images of the specimens were taken before and after the tests. Because no cracks were observed in the specimens after the tests, it is unlikely that the softening occurred because of local brittle failure. Therefore, softening is precipitated by softening of the framework structure of the siltstone itself; this phenomenon is defined as strain softening.
To understand the strain softening mechanism, the presence of cracks should be confirmed by observation of the microstructure in the specimen immediately after the strain softening. The strain softening observed in this study should be reproduced by a numerical model and the constitutive equation to elucidate ground mass behavior, such as how strain softening affects the deformation of the ground.
We thank Dr. Yuzuru Yamamoto and Dr. Masayuki Utsunomiya for advices and assistance with sampling in the field. We are also grateful to Dr. Hirose Takehiro and Dr. Osamu Tadai for support with the micro-focus X-ray CT images. Finally, we appreciate Prof. Katsuaki Koike and Mr. Yu Shimoji for assistance with the XRD analysis. This research was financially supported by a Grant-in-Aid for Young Researchers from the Association for Disaster Prevention Research, Japan.