Microstructure of Materials
Effects of Carbonization on Electrophysical Properties of Cellulose-Based Nanocomposites with Triglycine Sulfate
2020 Volume 61 Issue 8 Pages 1580-1583

Details
2020 Volume 61 Issue 8 Pages 1580-1583
In this study, a ferroelectric nanocomposite was prepared from triglycine sulfate (TGS) with cellulose nanoparticles (CNP) pretreated at different carbonization temperatures. The results showed that along with the increase in electrical conductivity, the phase transition temperature of TGS decreased significantly with increasing carbonization temperatures due to the partial destruction of interaction between CNP and TGS during cellulose carbonization. The dielectric measurements were performed under a weak electric field (2 V/cm) in the frequency range of 10−3–106 Hz. The work provides deeper insights on the influence of dielectric components on the properties of ferroelectrics.

Fig. 3 Temperature dependences of dielectric constant (a) and dielectric loss tangent (b) for CNP/TGS composite containing cellulose at different carbonization temperatures of 120°C, 240°C, 250°C, 300°C, 360°C and 400°C.
Cellulose has been becoming a favorite material that can be used as an important component for manufacturing electronics elements as supercapacitors, batteries;1) electrochemical devices;2) actuators;3) electrodeposition;4) ect. owing to eco-friendliness, high-voltage insulation, light weight and flexibility. With regard to ferroelectric-based materials, cellulose has taken part in developing several ferroelectric nanocomposites.5–9)
The studies on electrophysical properties of ferroelectric nanocomposites containing cellulose and triglycine sulfate (TGS) have been widely reported.10–13) TGS is a classical ferroelectric which underdoes the second-order phase transition at 49°C. Under the influence of cellulose, the phase transition point of TGS is shifted toward higher temperatures by even up to a few tens of degrees Celsius as compared to those of the bulk.10) It has been realized that the main reason for this anomaly is due to the strong interaction between cellulose and TGS through hydrogen bonds. This assumption is reasonable since both cellulose and TGS are hydrogen-containing materials. As a result, the polar state of ferroelectric component can be maintained in a wider region. However, the stated explanation is just stopped at the point of “assumption” and could raise doubts because along with the cellulose/TGS interaction, there are state-of-the-art causes as size effects or ferroelectric particle/particle interaction. In this study, we raise an opposite task based on the idea that if the cellulose/TGS interaction is weakened, how the phase transition would be changed? In this regard, unlike the previous studies, for preparation of cellulose/TGS composite, the starting cellulose will be thermally treated to get samples carbonized with different temperatures. It was proved14–16) that the carbonization process accompanies the changes in structure of cellulose and therefore the cellulose/TGS interaction is expected to be affected.
In the present work, the nanocomposite from TGS and cellulose nanoparticles which is thermally pretreated was prepared. The changes in structure of composite containing cellulose carbonized at different temperatures were observed by FTIR technique. Besides, the carbonization process could lead to the increase in electrical conductivity. Thus, the features of conductivity in the composite were also investigated. All the above results will be used to clarify the effects of cellulose carbonization on phase transition and conductivity of the synthesized composite in this study.
The carbonization process of cellulose was conducted as follows. The starting raw cellulose nanoparticles stored in distilled water were taken out and divided into groups, each of which was heated up to each maximum temperature of 120, 240, 250, 300, 360 and 400°C at a rate of 0.5°C/min. At each maximum temperature, the samples were kept for 2 h. The raw cellulose nanoparticles in size ranged from 40–80 nm was prepared from waste cotton according to procedure described in a previous study with detail characterization.17)
After heat treatment, the cellulose from each group was put into a saturated TGS solution at room temperature at a CNP:TGS mass ratio of 1:1 under a stirring of 600 rpm until a solid part was formed. Then, the mixture was taken out, dried at 120°C for 2 h to remove residual water, crushed into motar and compressed into circle tables with 1 mm in thickness and 0.5 × 0.5 cm2 in large surface.
The changes in functional groups of the synthesized composite at different carbonization temperatures were observed by Fourier-transform infrared spectroscopy (Bruker Tensor 37, USA), respectively. A model GW Instek LCR-821 meter was utilized to detect anomalous phase transition at 1 kHz under a weal electric field of 2 V/cm. The electrical conductivity was investigated on an impedance gain/phase analyzer “Solartron – 1260A” connected with an expanding module of “Dielectric Interface – 1296”. The experimental results shown in this study were measured at least 3 times with an error not exceeding 0.1%.
Firstly, it is curious to explore the influence of carbonization on cellulose. The changes in functional groups of CNP at different carbonization temperatures (Tcar) are indicated by FTIR spectra as shown in Fig. 1. As observed at Tcar = 120°C, all the characteristic functional groups were detected, including a broad band of 3800–2700 cm−1 referring to residual water and intermolecular H-bonds; 2900 and 2840 cm−1 (CH2 asymmetric vibrations); 1635 cm−1 (OH stretching); 1473 cm−1 (OCH in plane); 1378 cm−1 (C–H deformation); 899 cm−1 (C–O–C deformation modes) and 707 cm−1 (OH out of plane bending).7) At Tcar lower 250°C, the major adjustment in adsorption regions were not seen, except for the strong shrinkage of 3800–2700 cm−1 band, obviously, caused by the escape of residual water from CNP samples.14) This band was continued to narrow at higher carbonization temperatures, probably, due to the breaking of intermolecular H-bonds in cellulose. At Tcar > 250°C, several changes were observed. Indeed, the peaks at 707, 899, 2840 and 2900 cm−1 became less pronounced and disappeared at 400°C with the emerging of two new peaks at 1625 cm−1 and 1710 cm−1 (Fig. 1). The anomaly related to 707, 2840 and 2900 cm−1 peaks might be due to the decomposition of H from cellulose during carbonization process.16) Known that the new peak at 1625 cm−1 is associated to the formation of C=C bonds owing to the transformation into carbon.16) Interestingly, with increasing the carbonization temperature, C–O–C could be transformed into C=C during carbonization of cellulose,16) leading to decreasing adsorption intensity of peak at 899 cm−1 and to increasing those at 1625 cm−1 (C=C bonds). It should be noted that the peaks at 1635 cm−1 (OH stretching) was not seen in the font of 1625 cm−1 peak. Finally, the small peak at 1710 cm−1 can be assigned to C=O vibrations.15) Although the ratio of number of molecules for oxygen to carbon (O/C) decreased during carbonization, the number of C=O groups might increase with increasing the number of carbon molecules.15)

Changes in FTIR spectra of CNP at different carbonization temperatures (Tcar) of cellulose.
In order to clarify the effect of carbonization on functional groups in the synthesized composite, the FTIR spectra at different carbonization temperatures are presented in Fig. 2. The results for uncarbonized CNP and pure polycrystalline TGS were added for comparison because the detail characterization has been already studied.7) For CNP/TGS composite with cellulose thermally pretreated at temperature of 120°C, FTIR spectra demonstrated almost all typical adsorption peaks and bands, and were well consistent with those reported.10) It should be noted that unlike TGS and CNP starting materials, the adsorption band of 3800–2700 cm−1 in composite was expanded due to the increase in number of intermolecular hydrogen bonds formed between CNP and TGS components.10) As for CNP, the significant changes for the composite started also from 250°C and at higher carbonization temperatures. Notably, characteristic peaks for cellulose at 2840 and 2900 cm−1 peaks cannot be observed due to the considerable expansion of 3800–2700 cm−1 band. All other characteristic peaks as analyzed above for carbonized cellulose were also detected in the case of CNP/TGS composite. Besides, a slight shift of peaks at 707 and 899 cm−1 into 708 and 898 cm−1 were obtained (Fig. 2).

Changes in FTIR spectra of CNP/TGS composite with different carbonization temperatures (Tcar) of cellulose. FTIR spectra for starting CNP and TGS are added for comparison.
The phase transition of TGS in the composite with carbonized cellulose was investigated by measuring temperature dependences of dielectric constant (Fig. 3(a)). According to the obtained results, the phase transition point shifted toward lower temperatures with increasing carbonization temperatures of the used cellulose (Fig. 3(a) and Table 1). At the same time, the values of dielectric constant increased significantly by approximately 5 times with rising of dielectric loss tangent (Fig. 3(b)). This behavior could be caused by the changes in electrical conductivity of composite samples. Indeed, the frequency dependences of conductivity σ(ω) indicated that for composite with cellulose thermally pretreated at higher 250°C, a plateau (frequency independent area) appeared and became broader (Fig. 4(a)). The presence of that can be referred to DC conductivity. As presented in Fig. 4(b) for DC – conductivity extrapolated from Fig. 4(a), the values of DC conductivity significantly increased with increasing carbonization temperatures. At lower temperatures of 240 and 120°C, the values of σ rise monotonously with frequency in relation with the reorientation of dipoles in TGS and CNP components only.7) As a result, dependence of conductivity on frequency for the composite at different carbonization temperatures of cellulose can be expressed by the following equation:
| \begin{equation} \sigma(\omega) = \sigma_{dc} + A \omega^{n} \end{equation} | (1) |
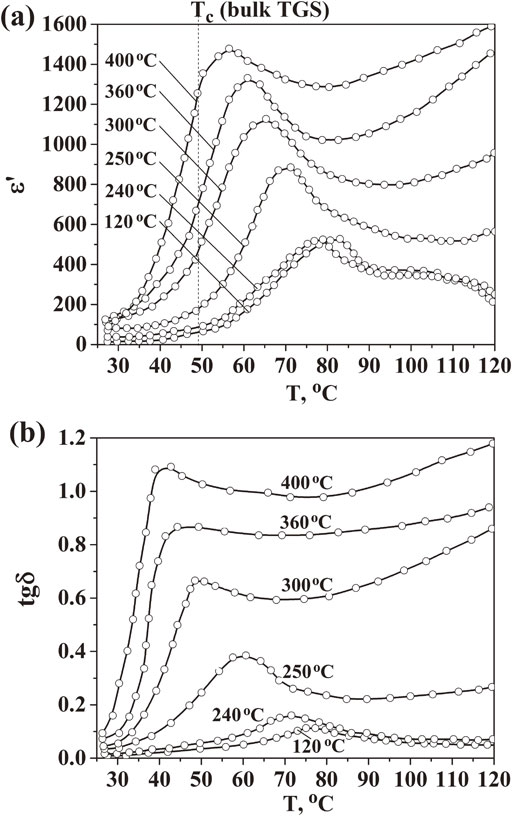
Temperature dependences of dielectric constant (a) and dielectric loss tangent (b) for CNP/TGS composite containing cellulose at different carbonization temperatures of 120°C, 240°C, 250°C, 300°C, 360°C and 400°C.

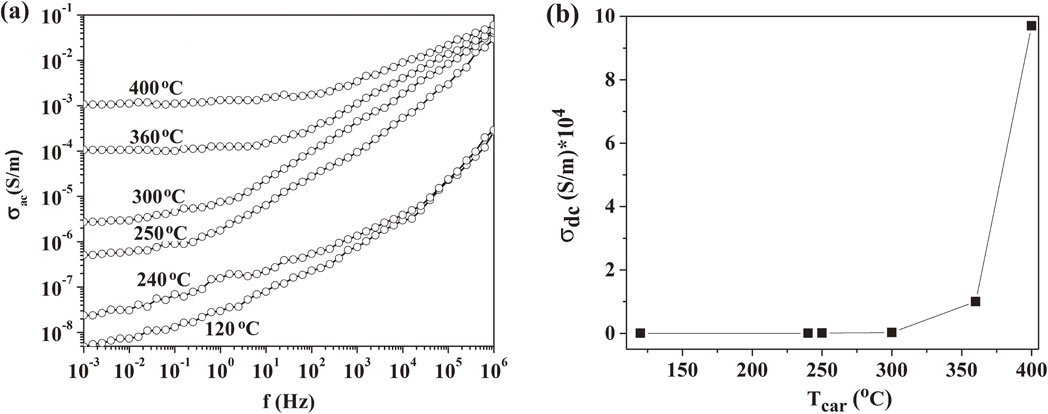
Frequency dependences of AC conductivity (a) for CNP/TGS composite containing cellulose at different carbonization temperatures of 120°C, 240°C, 250°C, 300°C, 360°C and 400°C. (b) Extrapolated plot for dependence of DC conductivity on cellulose carbonization temperature.
In order to get a deeper understanding of electrical conduction properties in the composite based on carbonized cellulose, the inversed temperature dependence of DC conductivity for CNP/TGS composite was plotted (Fig. 5). It can be seen in Fig. 5 that the natural logarithm of DC conductivity depends linearly on the inversed temperature as Ln σdc ∼ −Ea/kT, where Ea is activation energy, k – Boltzmann constant and T – measuring temperature. This behavior is consistent with those for the nanocrystals of TGS embedded into nanopores of matrix cellulose.18) However, the activation energies obtained in our case (0.92, 0.89, 0.72 0.63, 0.51 and 0.42 eV at carbonization temperatures of 120, 240, 250, 300, 360 and 400°C, respectively) (Fig. 5) are smaller than the reported one (0.96 eV).18) As seen that the increase in carbonization temperature led to the decrease of activation energies. In other words, the charge carriers seemed to move easier in carbonized CNP than raw CNP.

The inversed temperature dependence of DC conductivity for CNP/TGS composite containing cellulose carbonized at different temperatures.
The rising of electrical conductivity with increasing the carbonization temperature allows us to assume about the formation of conductive carbon clusters in CNP/TGS composite. It could be true because the ratios of number of H to C molecules (H/C) as well as of oxygen to carbon (O/C) were reduced due to dehydration and the increase in number of carbon molecules during carbonization.14) As a result, the CNP/TGS hydrogen bonds that are responsible to amplify polarity in TGS inclusion became weaker. This was also evidenced by the significant shrinkage of 3800–2700 cm−1 band as mentioned above in FTIR spectra. The carbonization process apparently reduced the ability of cellulose to form bonds with other hydrogen-containing substances. In other words, the interaction between TGS and CNP at their interfaces were looser and the ferroelectric state could be transformed into paraelectric phase at lower temperatures.
Another additional reason causing the decrease in phase transition in CNP/TGS composite containing carbonized cellulose is weakness of the interaction between TGS particles due to the shielding by charge carriers in a conductive medium. In this case, the dipoles in TGS particles cannot be oriented by the way to compensate each other. Thus, according to the Landau-Ginzburg-Devonshire theory,17) the dipole-dipole interaction energy was positive, leading to the reduction of phase transition temperature of ferroelectric particles systems.
The increase in dielectric constant at higher carbonization temperatures was obviously related to the Maxwell–Wagner–Sillars polarization as commonly reported in heterogeneous composite systems in the presence of conductivity.19–21)
The above analysis recommended an effective way to adjust the phase transition temperatures of ferroelectrics in cellulose-based composite by the change in carbonization temperature of starting cellulose. The heating pretreatment affected the ability of cellulose to form hydrogen bonds with hydrogen-containing ferroelectric of triglycine sulfate, weakening the interaction between cellulose and triglycine sulfate. In addition, the conductive medium created by carbon clusters led to the increase in dielectric constant due to the Maxwell–Wagner–Sillars polarization.