Abstract
In this paper, the Gd2O3:Eu3+ nanospheres with the ratio Eu3+/Gd3+ of 6% mol were successfully synthesized by a multi-step chemical method with the mean nanoparticles size of about 200 to 220 nm and a low standard deviation. The morphology, structure and optical behavior of as-synthesized and annealed Gd2O3:6%Eu3+ samples were investigated by field-emission scanning electron microscopy (FESEM), X-ray diffractions (XRD), and photoluminescence spectroscope (PL) The luminescence lifetime of samples was also investigated and discussed. The biomedical nanocomplexes of Gd2O3:6%Eu3+ with IgG were fabricated by glutaraldehyde linking after covering nanospheres with amino Silica. The luminescent nanocomplexes Gd2O3:6%Eu3+@Silica-NH2-IgG with different concentrations have been incubated with CEA tumor cells to investigate and evaluate the detection capacity by using a fluorescence optical microscopy for the early detection and treatment of cancer.
1. Introduction
The advent of nanotechnology and nanomaterials has opened up a wide range of new applications, especially in the field of biomedicine. Recently fluorescent materials, including organic pigments,1) nanomaterials containing rare earth ions,2–6) upconversion luminescent materials,7,8) and semiconductor quantum dots (QDs) have mainly been synthesized and applied in biomedicine.9,10)
Among the above fluorescent materials, the ones containing rare earth ions are potential candidates due to their long fluorescence lifetime, large Stokes shift, narrow spectra width, which are very useful for fluorescent labeling, transducer, sensor.11,12) Moreover, the nanomaterials containing rare earth ions are highly stable, easy to fabricate and to functionalize.12,13) They also exhibit low toxicity in the human body.14,15) Because of these outstanding properties, fluorescent nanomaterials are used as biomedical imaging sensors to detect biomedical components such as protein molecules, polypeptide, nucleic acids, or cells and viruses.16,17)
One of the most widely used oncofetal protein tumor markers is Carcinoembryonic antigen (CEA). CEA is a glycoprotein, usually made by the digestive tract tissues during pregnancy. By the time infant is born it drop to a very low level. In adult, CEA level is high in some cases of cancer, especially cancers related to the digestive system. Therefore, CEA is considered as a tumor marker in clinical findings.18,19) In medicine, the CEA test contributes to the early and clearly identification of etiologies so that appropriate and effective preventive and curative measures can be taken timely.
Currently, CEA is applied in early detection of cancer by some techniques such as ELISA, RIA and immunofluorescence.20,21) However, the ELISA or RIA methods are time-consuming, inconvenient, and expensive. Nanomaterials with small size can combine with different materials, especially with antibodies which are easily luminescent when they are excited by a suitable wavelength.20,21) The luminescent materials containing Eu3+ activator based on Gd2O3 have gained much interest in CEA detection using fluorescent immunoassay.21,22)
In our previous work, the luminescent materials containing Eu3+ activator based on Gd2O3 with various concentration ratios of Eu3+/Gd3+ have been successfully synthesized. The detailed studies on the properties of these materials were also carried out.23) Based on the obtained results, Gd2O3 with 6% mol Eu3+ has been selected for studying on detection of CEA tumor cells. In this work, we focus on the synthesis and investigation of the luminescent, functionalization and conjugation characteristics of Gd2O3:6% Eu3+ with IgG for the early detection and specification of CEA antigen in the tumor cells in vitro.
2. Experimental Procedure
2.1 Chemicals
The chemicals that were used in fabricating nanosphere materials include: Gadolinium(III) nitrate hexahydrate (Gd(NO3)3·6H2O, fine powder, 99.99%), europium(III) nitrate pentahydrate (Eu(NO3)3·5H2O, powder, 99.99%), urea (CO(NH2)2, powder, 98%), tetraethylorthosilicate (TEOS, liquid, 99%) and (3-Aminopropyl) triethoxysilane (APTES, liquid, 99%) from Sigma-Aldrich. Those chemicals were received and used without further purification. Deionized water (DI water) with electrical resistance of 16 MΩ was used for all the preparation processes. Phosphate-buffered saline (PBS buffer pH 7.4) and bicarbonate buffer (pH 9.5) were used to make an appropriate environment to conjugate with the IgG antibody and CEA. CEA tumor cells were grown and supplied by Immunology Department of Vietnam Military Medical University.
2.2 Preparation of nanocomplexes Gd2O3:6%Eu3+@Silica-NH2-IgG
As mentioned above, our efforts are directed towards continuing our previous studies on the synthesis of Gd2O3:Eu3+ materials. Gd2O3 doped with 6% mol Eu3+ with good characteristics such as narrow size distribution (low standard deviation) and good luminescence23) was selected for investigating the ability to detect CEA tumor cells.
Figure 1 shows the fabrication diagram of nanocomplexes Gd2O3:6%Eu3+@Silica-NH2-IgG. First, the Gd2O3:6%Eu3+ nanospheres have been prepared by a modified multi-step co-precipitation with the presence of urea. The resulting nanospheres were dried at 70°C for 12 h in air and then annealed by a stepwise heating process at 105°C for 5 h; 200°C for 2 h; 600°C for 2 h and 650°C for 3 h to obtain Gd2O3:6%Eu3+ as the final product.23) To further investigate the dependence of luminescent properties of the Gd2O3:6%Eu3+ nanospheres on the annealing temperature, the sample was calcinated at 750, 850 and 900°C.

For the next step, the heat-treated Gd2O3:6%Eu3+ nanospheres were coated with silica by using TEOS and Stober process. Briefly, 0.1 g Gd2O3:6%Eu3+ nanospheres were redispersed in 180 ml of ethanol and 100 ml of DI water by ultrasonication for 45 min. Next, 150 µl of TEOS dispersed in 10 ml ethanol was added dropwise into the reaction flask. Then, 1 ml of 25% NH4OH was added upon intensive stirring and the reaction solution was stirred for another 10 h. Finally, the resulting precipitate was centrifuged and washed several times with DI water and ethanol. The white precipitate Gd2O3:Eu3+@silica was dispersed in 20 ml ethanol for the next functionalization process. For the surface functionalization of Gd2O3:6%Eu3+@Silica by NH2 group, APTES was used as a coupling agent containing the NH2 group. The same process as above was carried, TEOS was replaced by APTES. The product of this process was Gd2O3:6%Eu3+@Silica-NH2, it was centrifuged and cleaned three times with PBS. The resulting products were dispered in 2 ml of sodium phosphate solution for the binding process with biological elements.
In order to link this material to the IgG antibody, glutaraldehyde (GDA) was used to form a complex between Gd2O3:6%Eu3+@silica-NH2 with IgG antibody due to the fact that it is a homobifunctional crosslinker to bridge both homogenous aldehyde groups. 2 ml of the Gd2O3:6%Eu3+@silica-NH2 solution obtained above was put into a centrifuged tube. Then 0.1 ml of glutaraldehyde was added and mixed by vorltex mixer for 1 h at room temperature in order to form a uniform suspension. 50 µl of antibody (IgG) was mixed with this solution and kept at room temperature for 2 to 4 h. Gd2O3:6%Eu3+@Silica-NH2-IgG, the product of this process, was stored at 3–8°C in a refrigerator for marking CEA tumor cells in subsequent processes.
2.3 Characterization and measurements
The morphology of these nanomaterials was investigated by field emission scanning electron microscopy (FESEM, Hitachi S4800). The structure of the materials was determined by X-ray diffraction system (EQUINOX 5000). Fluorescence and lifetime spectra of the materials were measured using a high resolution microscope (Microspec-2356), He–Cd laser with 266 nm and 405 nm excitation wavelengths. The fluorescence lifetime is calculated from the slope of the decay curve according to equation:
| \begin{equation*}
F(t) = F_{0}e^{-t/\tau}
\end{equation*}
|
where F
0 is the intensity at time
t = 0,
t is the time after the absorption, and τ is the fluorescence lifetime.
The ability to detect CEA tumor cells of the nanocomplexes is indicated by the presence of a visual emitted red light in fluorescence microscope (Carl Zeiss Primo Star).
3. Results and Discussions
3.1 The morphology of synthesized samples
The FESEM images of Gd2O3:6%Eu3+@ with molar ratios of Eu3+/Gd3+ 6% mol are presented in Fig. 2. Figure 2 shows that the fabricated nanospheres are fairly uniformly with the size in the ranges of 200–220 nm and a low standard deviation.23)
3.2 X-ray diffraction
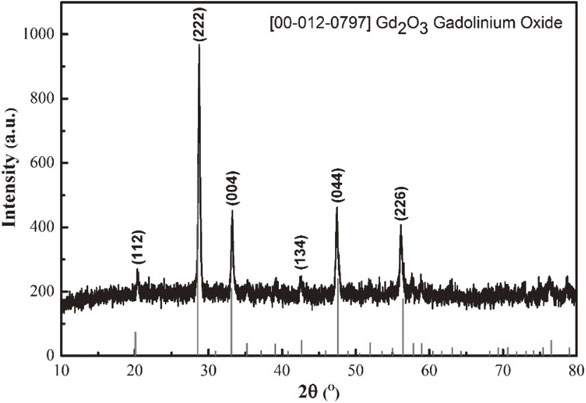
X-ray diffraction diagram of Gd2O3:6% Eu3+ nanosphere which was calcined in air at 650°C is shown in Fig. 3. All observable diffraction peaks at 2θ: 28.70; 33.10; 47.60; 56.40; and 59.10° are indexed to the standard pattern for the cubic crystal structure of Gd2O3 (JCPDS No. 00–012-0797).24)
3.3 Photoluminescence properties of Gd2O3:6%Eu3+
Figure 4 shows the excitation spectra of Gd2O3:6%Eu3+. The excitation spectrum was obtained by observing the emission of Eu3+ in 5D0 → 7F2 transition at 611 nm. It can be seen clearly that the excitation spectrum consists of a broad band with a maximum at 266 nm associated with a charge-transfer band of O2− → Eu3+.25) The presence of the Gd2O3 host band and Gd3+ excitation lines in the excitation spectrum of Eu3+ indicates that there is an energy transfer from the Gd2O3 host and Gd3+ to Eu3+. In longer wavelength regions, the transitions of Eu3+ can be observed with weaker intensities corresponding to peaks at 396, 467 and 534 nm.

Photoluminescence spectra of Gd2O3:6%Eu3+ samples after annealing at 650, 750, 850 and 900°C under excitation at 266 and 405 nm (Fig. 5) were observed at the red light region raise according to the 5D0 → 7Fn (n = 0, 1, 2, 3, 4) transitions in Eu3+ ions. Fluorescent properties of annealed samples at different temperatures present very strong luminescence. The maximum emission peaks obtained at 579, 587, 611, 651 and 707 nm wavelengths, correspond to 5D0 → 7F0, 5D0 → 7F1, 5D0 → 7F2, 5D0 → 7F3 and 5D0 → 7F4 transitions, respectively. The strongest emission peak at 611 nm which relates to the 5D0–7F2 transition of Eu3+ ions in Gd2O3:6%Eu3+ nanospheres is very sharp and strong, which exhibits the characteristic red emission of Eu3+.

Figure 6 shows photoluminescence spectra of Gd2O3:6%Eu3+, Gd2O3:6%Eu3+@Silica and Gd2O3:6%Eu3+@Silica-NH2 under excitation of 266 nm. Gd2O3:6%Eu3+ nanomaterials were first post-coated with silica and then conjugated to NH2 functional group. The final product still generates a relatively strong luminescent intensity, which indicates that Gd2O3:6%Eu3+ nanomaterial is a very promising tumor cell marker with red color recognition.
Figure 7 shows the luminescence lifetime of Gd2O3:6%Eu3+, Gd2O3:6%Eu3+@Silica and Gd2O3:6%Eu3+@Silica-NH2 under excitation at 266 nm. The results clearly show that the luminescence lifetime of all three samples is quite long and reaches over 1 ms. The lifetime of Gd2O3:6%Eu3+ nanospheres is relatively long up to 1.35 ms. It was a bit shorter 1.17 ms after functionalizing Gd2O3:6%Eu3+ nanospheres with NH2 group. This result again shows that this material has tremendous potential for biomedical marking.
3.4 Application of luminescent nanocomplexes has been associated with antibodies to detect CEA tumor cells in vitro
In order to evaluate the fabrication process of fluorescent nanoparticles, the experimental setup was conducted as follows:
Step 1: Taking 3 cell culture plates, using 2 plates with attached CEA and 1 control plate in bicarbonate buffer pH 9.5, incubating at 4°C for 12 h. Then, rinsing 3–5 times all test wells with 100 µl PBS.
Step 2: Using a solution of materials Gd2O3:Eu3+@Silica-NH2-IgG attached to antibodies with the concentration of 3 mg/100 µl (2) and 10 mg/100 µl (3) to the plate attached to CEA tumor cells, shaking well overnight at 4°C.
Step 3: Removing residual substances by washing 3–5 times with 100 µl PBS.
Step 4: Drying at 37°C for 15 min, proceeding under the fluorescent microscope Carl Zeiss Primo Star.
Figure 8 shows the images acquired with fluorescence microscope. The results show that when CEA tumor cells are incubated with different concentrations of luminescent nanocomplexes combined with rinsing in buffer solution, the red luminescent regions of nanocomplexes on the surface of cells can be clearly observed. Nanocomplexes with both low concentration of 3 and 10 mg/100 µl are detectable.
4. Conclusion
The nanospheres Gd2O3:6%Eu3+ with the mean size from 200 to 220 nm were successfully synthesized by multi-step chemical method. The strongest emission peak is observed at 611 nm, under excitation at 266 nm and 405 nm, is ascribed to the 5D0–7F2 transition of Eu3+ ions in Gd2O3:6%Eu3+ nanospheres. The luminescence lifetime of coated and uncoated silica Gd2O3:6%Eu3+ nanospheres under the UV excitation at 266 nm show that the luminescence lifetime of these samples are longer than 1 ms. The luminescent nanocomplexes Gd2O3:6%Eu3+@Silica-NH2-IgG with different concentrations were used to reveal a very low limited concentration of CEA tumor cells up to 3 mg/100 µl. There nanocomplexes have potential to be applied to detecting CEA tumor cells in vitro and are very useful in biomedical applications such as in early diagnosis and treatment.
Acknowledgments
This work is funded by Vietnam National Foundation for Science and Technology Development (NAFOSTED), Vietnam, under grant No. 103.03-2017.53 and according to Decision No. 106/QD-HDQL-NAFOSTED dated 11/1/2019 of the National Fund for Scientific and Technological Development on funding for internship and short-term research cooperation abroad (France). The authors would like to thank Laboratoire de Photonique Quantique et Moléculaire, UMR 8537, École Normale Supérieure Paris-Saclay, Centrale Supélec, CNRS, Université Paris-Saclay, 61 avenue de Président Wilson, 94235 Cachan, France facilitating the implementation of experiments and measurements.
REFERENCES
- 1) F. Wang, W.B. Tan, Y. Zhang, X. Fan and M. Wang: Nanotechnology 17 (2006) R1–R13.
- 2) H.T. Khuyen, N.T. Huong, T.T. Huong, P.T. Lien, D.T.A. Thu, N.T.A. Huong, W. Strek and L.Q. Minh: J. Rare Earths 37 (2019) 1237–1241.
- 3) N.T. Huong, N.M. Hung, P.T. Lien, N.D. Van, P.H. Nam, N.T. Binh and L.Q. Minh: J. Electron. Mater. 45 (2016) 3646–3650.
- 4) Y. Wu, X. Xu, Q. Li, R. Yang, H. Ding and Q. Xiao: J. Rare Earths 33 (2015) 529.
- 5) S. Wani, S. Majeed and S.A. Shivashankar: Indian J. Chem. 56 (2017) 1285–1292.
- 6) T.L. Phan, D.N. Chung, P.D. Thang, P.T. Huyen, T.V. Manh, T.A. Ho, T.D. Thanh, N.M. Vuong, B.W. Lee and S.C. Yu: Mater. Trans. 56 (2015) 1412–1415.
- 7) A. Gee and X. Xu: Surfaces 1 (2018) 96–121.
- 8) F. Jia, G. Li, B. Yang, B. Yu, Y. Shen and H. Cong: Nanotechnol. Rev. 8 (2019) 1–17.
- 9) E. Abbasi, T. Kafshdooz, M. Bakhtiary, N. Nikzamir, N. Nikzamir, M. Nikzamir, M. deh Mohammadian and A. Akbarzadeh: Nanomed. Biotechnol. 44 (2016) 885–891.
- 10) H. Chang and W.C. Tzeng: Mater. Trans. 49 (2008) 1467–1473.
- 11) S. Delice, M. Isik and N.M. Gasanly: Optik 158 (2018) 237–242.
- 12) B.K. Gupta, S. Singh, P. Kumar, Y. Lee, G. Kedawat, T.N. Narayanan, S.A. Vithayathil, L. Ge, X. Zhan, S. Gupta, A.A. Martí, R. Vajtai, P.M. Ajayan and B.A. Kaipparettu: Sci. Rep. 6 (2016) 32401.
- 13) G. Xing, Q. Guo, Q. Liu, Y. Li, Y. Wang, Z. Wu and G. Wu: Ceram. Int. 40 (2014) 6569–6577.
- 14) J. Shen, L.D. Sun and C.H. Yan: Dalton Trans. (2008) 5687–5697.
- 15) R.J. Palmer, J.L. Butenhoff and J.B. Stevens: Environ. Res. 43 (1987) 142–156.
- 16) B. Bohunicky and S.A. Mousa: Nanotechnol. Sci. Appl. 4 (2011) 1–10.
- 17) B.D. Malhotra, S. Kumar and C.M. Pandey: J. Phys.: Conf. Ser. 704 (2016) 012011.
- 18) L. Berkovich, B. Shpitz, R. Ghinea, I. Greemland, V. Kravtsov, D. Kidron, M. Mishaeli and S. Avital: J. Surg. Oncol. 110 (2014) 458–462.
- 19) T. Radjenovic-Petkovic, T. Pejcic, D. Nastasijević-Borovac, M. Rancic, D. Radojkovic, M. Radojkovic and I. Djordjevic: Med. Arh. 63 (2009) 141–142.
- 20) R.D. Grange, J.P. Thompson and D.G. Lambert: Br. J. Anaesth. 112 (2014) 213–216.
- 21) S.K. Vashist and J.H.T. Luong: Immunoassays: An Overview, Handbook of Immunoassay Technologies, Approaches, Performances, and Applications, (Academic Press, Cambridge, 2018).
- 22) M. Wang, C.C. Mi, W.X. Wang, Y.F. Liu, Z.R. Xu, C.B. Mao and S.K. Xu: ACS Nano 3 (2009) 1580–1586.
- 23) T.K. Anh, N.T. Huong, P.T. Lien, D.K. Tung, V.D. Tu, N.D. Van, W. Strek and L.Q. Minh: Mater. Sci. Eng. B 241 (2019) 1–8.
- 24) H. Li, S. Song, W. Wang and K. Chen: Dalton Trans. 44 (2015) 16081.
- 25) Q.B. Li, J.M. Lin, J.H. Wu, Z. Lan, J.L. Wang, Y. Wang, F.G. Peng, M.L. Huang and Y.M. Xiao: Chin. Sci. Bull. 56 (2011) 3114–3118.