Abstract
In order to clarify a guideline for designing of composition of a flux which can achieve both minimizing a refractory corrosion by the flux and maximizing of solubility of Mn oxides into the flux, corrosion tests for refractory was conducted in the air atmosphere. The basic composition of flux is Na2O–B2O3 and the refractory is Mullite (3Al2O3·2SiO2), assuming a process of melting of a copper alloy containing Mn as easily oxidized elements. Although the corrosion ratio of refractory became larger with increasing of mole fraction of Na2O in flux, the concentration of refractory’s constituents in the flux have different tendency predicted by the results of corrosion ratio. Through the corrosion test, the Na2O–B2O3 based flux has penetrated inside the refractory with Mn, and a part of that Mn has reacted with Al2O3 to form MnAl2O4. However, in the refractory/flux interface no clear formation of the compound layer could be confirmed due to the reaction between the refractory’s constituents and the flux. In addition, the relationship between the corrosion ratio and the equilibrium solubility of 3Al2O3·2SiO2 for Na2O–B2O3 flux calculated by thermodynamic database was investigated. The result shows that there are not clear relationships between them. The cause of this can be explained by the affection of corrosion inside the refractory by the penetration of the flux through the pores in the refractory. Furthermore, it was shown that the amount of Mn oxide dissolved in the flux was strongly affected by the viscosity of the flux by calculation.
Consequently, in order to design a proper composition of flux in this study, it became clear that the thermodynamic approach alone was not enough and a more detailed examinations such as the wettability between the flux and refractory, properties of flux, especially penetration phenomena was also important.
This Paper was Originally Published in Japanese in J. Japan. Inst. Met. Mater. 84 (2020) 1–10. Figures 1, 2, 4 and 7 were slightly changed. The references were also changed.
1. Introduction
1.1 Background
In high-temperature processes such as refining, melting and casting, refractory corrosion can be seen at locations in contact with portions with slags and fluxes, which reduces the lifetime of the refractory.1–5) It is important to suppress this refractory corrosion to improve the productivity of manufacturing processes.
In the case of wrought copper, particularly copper alloys containing elements that are easily oxidized in air, it has been reported that refractory corrosion is often induced by fluxes used to prevent melts from oxidizing.6) Cu–Zn–Mn and Cu–Zn–Ti are well-known examples of such copper alloys7,8) that include either Mn or Ti as an alternative to Ni, which may induce allergy, and are often used in accessories such as zippers and buttons.
For these fluxes, it is important not only to prevent the melt from oxidation but also to dissolve as much as possible of the oxides floating on the surface of the metallic melt formed by easily oxidized elements such as Mn and Ti. This is to (1) prevent the outlet of the melting furnace from being blocked by the solidified oxide when the melt is poured into the holding furnace and (2) prevent the quality of the casting from deteriorating caused by oxide inclusions. Therefore, the design of a flux with high Mn or Ti oxide solubility is necessary. However, refractory corrosion must be minimized. Consequently, it is necessary to design a flux composition that satisfies these contradictory requirements. That is, the development of a flux with both low solubilities of the oxides constituting the refractory and high solubilities of the oxides of easily oxidized elements generated in the copper melting process is required. To develop appropriate fluxes, we need an in-depth understanding of both the mechanism of refractory corrosion and the factors related to the dissolution of oxides of easily oxidized elements in the flux.
Many studies on the mechanisms of refractory corrosion have been performed, particularly for the smelting and manufacturing of glasses. These studies mainly focused on the rate-controlling step of refractory corrosion,9,10) the penetration of slag into the refractory,11) the chemical reaction between the slag and the refractory12) and improving the lifetime of the refractory.13) Many other studies on smelting and casting14) have also been performed from the standpoint of eliminating inclusions from liquid metals by using slags and fluxes; such inclusions are closely related to the dissolution of flux of solid oxides generated during the melting copper alloys.
In addition to the above studies, some approaches to evaluating the dependence of the Gibbs energy of a liquid oxide on its components and temperature have been developed, enabling the analysis of phase equilibrium for multicomponent oxides such as slags and glasses.15) In the field of copper smelting, refractory corrosion and the compounds generated by the reactions between slag and a copper alloy have been successfully predicted.1) However, in the field of wrought copper manufacturing, there have been a limited number of studies on refractory corrosion caused by slags and fluxes,16) whereas the corrosion caused by metals or oxides generated by the oxidation of liquid copper alloys has been well investigated.
Although it is empirically well known that Na2B4O7 is an appropriate flux for preventing liquid copper alloys from oxidizing,17) no systematic studies have been carried out on the relationship between the mixture ratio of Na2O/B2O3 and its ability to dissolve oxides composed of easily oxidized elements, such as Mn and Ti. Furthermore, there have been a limited number of studies,6) in which the use of thermodynamic databases was investigated in the field of wrought copper melting.
1.2 The aim of this study
The aim of this study is to provide guidelines for designing the composition of a flux to both minimize the corrosion of a refractory caused by its contact with the flux and maximize the amount of Mn oxide dissolved in the flux. To achieve this purpose, we performed a thermodynamic calculation to predict phase equilibrium and carried out dynamic corrosion tests on a refractory. In this study, we adopted a system comprising the following substances: Cu–Zn–Mn as a copper alloy that includes Mn as an easily oxidized element, Na2O–B2O3 flux and mullite (3Al2O3·2SiO2) as the refractory. For the thermodynamic calculations, FactSage7.318) developed by CRCT and GTT Technologies was used.
2. Experimental Procedure
2.1 Apparatus
Figure 1 shows a schematic diagram of the experimental method. Metals and fluxes were heated in a carbon crucible (C: 40 mass%, SiC: 45 mass%, SiO2: 7 mass%), inner diameter: φ123 mm, thickness: 12 mm, depth: 185 mm. A device for rotating the refractory was set above the crucible, whose position could be adjusted vertically. To measure the temperature of the molten copper alloy, a K-type thermocouple with a protective tube composed of Si3N4 was used. All experiments were conducted in air.
2.2 Samples
Electro copper (4N), electro zinc (4N) and Mn flakes (3N) were prepared to form copper alloy melts, and mixed so that the total amount of each melt became 5 kg. Table 1 shows the components of the five fluxes of the Na2O–B2O3 system in this study. In the table, the activities of Na2O in these fluxes calculated by FactSage7.3 are listed, where the standard state is pure liquid Na2O and $x_{\textit{Na}_{2}\textit{O}}$ represents the molar ratio of Na2O. These fluxes were prepared such that the activity of Na2O gradually increased from Flux A to Flux E.

Table 1 Components of fluxes used in this study.
Each flux was prepared using Na2CO3 and H3BO3 powders, which satisfy the requirements of JIS and were manufactured by Kanto Chemical Co., Inc. In total, 200 g of each flux was produced. A block of mullite (Al2O3: 70 mass%, SiO2: 27 mass%, other materials: 3 mass%) with dimensions of 30 mm × 30 mm × 150 mm was selected as the refractory material. The apparent porosity ratio and density were 24.1% and 2.4 g/cm3, respectively.
2.3 Procedure
The raw materials for the molten metal were placed in a graphite crucible and heated by induction heating from room temperature to 1050°C in 40 min. After the temperature of the molten metal reached 1050°C, oxides that formed on the surface of the molten metal were removed as much as possible using a ladle, then 200 g of the flux prepared in advance was added to the molten metal all at once. After the flux melted as visually confirmed, the refractory was rotated at 60 rpm and lowered to the position where about 50 mm of the refractory was immersed in the flux and molten metal. The corrosion test was carried out for 120 minutes from the time when the descent of the refractory was stopped. About 20 ml of the flux floating around the intermediate position between the rotating refractory and the inner wall of the crucible was collected using a stainless ladle.
2.4 Evaluation of corrosion ratio of refractory
Figure 2 shows a schematic diagram of the change in the shape of the refractory during the corrosion tests and the definition of corrosion ratio of the refractory in this study. The corrosion ratio δ [%] is given by
| \begin{equation}
\delta = \left(\frac{S_{\text{i}} - S_{f}}{S_{i}}\right) \times 100\ [\%]
\end{equation}
| (1) |
where
Si and
Sf are the cross-sectional areas of the refractory before and after the corrosion tests, respectively. A high δ means that the refractory is strongly corroded. To evaluate δ, the surface of the refractory was qualitatively divided into three domains depending on the object in contact with it during the corrosion tests, i.e., the regions in contact with air, the flux and the molten metal. To obtain
Si and
Sf, after the corrosion tests, the refractory was cut with a ceramic cutter, then the cross-sectional area was measured using the area measurement function implemented in a Keyence microscope.
2.5 Analysis
The microstructure in each refractory was observed using a Hitachi S-3400N scanning electron microscopy (SEM) system with an acceleration voltage of 15 kV and a probe current of 60 mA. The chemical composition was determined using an electron dispersive X-ray spectroscopy (EDS) system installed in the above SEM system, with which point analysis was performed with a spot size of 2 µm and area analysis was performed over an area of 1 mm2. To identify the crystal structure of a compound, X-ray diffraction (XRD) analysis was carried out on the refractory using a Bruker D8 DISCOVER diffractometer with CuKα radiation at an acceleration voltage of 40 kV, a current of 40 mA and a diffraction angle 2θ of 35 to 117 degrees. Inductivity coupled plasma optical emission spectrometer (ICP-AES) analysis was performed on the fluxes to quantify the metal ion concentration.
2.6 Thermodynamic calculation software and databases used
The phase equilibria for the multicomponent oxide melts were calculated using FactSage7.3 software developed by CRCT and GTT Technologies with the Phase Diagram and Equilib modules and the FACT Pure Substances, FScopp, and FACT Solution databases. The viscosity of the flux was calculated using the Viscosity module in the software.
3. Results
3.1 Relationship between corrosion ratio of refractory and composition of Na2O–B2O3 flux
Figure 3 shows the relationship between the corrosion ratio of the refractory (δ) and the initial mole fraction of Na2O in the flux ($x_{\textit{Na}_{2}\textit{O}}$).
The corrosion of the refractory was promoted with an increase in $x_{\textit{Na}_{2}\textit{O}}$, and the maximum δ was 26% at $x_{\textit{Na}_{2}\textit{O}} = 0.5$ when using Flux D.
Figure 4 shows the relationship between the concentration of each metal ion in the flux after the corrosion tests and $x_{\textit{Na}_{2}\textit{O}}$, where Fig. 4(a) shows the results for the refractory components Al and Si and Fig. 4(b) shows those for the liquid metal components Mn and Zn of the copper alloy.

As $x_{\textit{Na}_{2}\textit{O}}$ increased, the concentrations of Al and Si in the flux also increased, which may have been caused by refractory corrosion. The Si in the flux may have come from not only the refractory but also the graphite crucible and protective tube of the thermocouple, because their corrosion may have increased the Si concentration in the flux. However, as the tendency of Si concentration in Fig. 4(a) is similar to that of the corrosion ratio (see Fig. 3), the increase in Si concentration is considered to mainly be due to the dissolution of the refractory. On the other hand, the Al concentration is constant at about 1 to 2 mass%, in contrast to the monotonic increase in corrosion ratio with $x_{\textit{Na}_{2}\textit{O}}$ in Fig. 3. The reason why the Al and Si concentrations had different trends with respect to $x_{\textit{Na}_{2}\textit{O}}$ is discussed in detail in section 4.2.2.
As shown in Fig. 4(b), similarly to the tendencies of Al and Si concentrations, the concentrations of Mn and Zn in the flux tended to increase with $x_{\textit{Na}_{2}\textit{O}}$. Although the Zn concentration increased to a maximum of about 7 mass% for Flux E, the Mn concentration was as high as about 40 mass% when using Flux D and Flux E. This difference in concentration was caused by the difference in their affinity with oxygen because the standard Gibbs energy change in the oxidation reaction is more negative for Mn than for Zn.19)
3.2 Observations of interior of refractory after corrosion test
Figure 5 shows SEM BSE micrographs and the results of EDX analysis of each section of the refractory after the corrosion tests using Flux D, which had the maximum corrosion ratio, for the parts in contact with (a) air and (b) the flux. The part in contact with air has an appearance identical to its initial state, indicating that it was negligibly corroded in the tests (see Fig. 5(a)-1). On the other hand, the part in contact with the flux changed its color and decreased in size as compared with the initial state, indicating that this part was corroded in the tests (see Fig. 5(b)-1).

From Figs. 5(a)-2 and (a)-3, it was confirmed that the part in contact with air is mullite, mainly composed of Al, Si and O, with particles of about 200 to 300 µm diameters and a binder layer consisting of fine particles filling the gaps. Note that the chemical composition shown in the figure is only one such example; the molar ratio of Al to Si at the part in contact with air analyzed by EDX widely varied in the range of 1.7 to 3.4 depending on the analyzed positions.
According to the microstructures shown in Figs. 5(b)-2 and (b)-3, the area in contact with the flux included two morphologies distinguished from the matrix; an interconnected morphology with dark contrast indicating the existence of light elements, and several particles with bright contrasts indicating the existence of heavy elements. Figure 6 shows the result of EDX mapping of the region shown in Fig. 5(b)-2; it appears that there is Na in the dark contrast and Mn in the bright contrasts.

Figure 7 shows SEM BSE micrographs of the cross section of the refractory after the corrosion tests using Flux D and the results of XRD analysis of the compound observed in the part with a high Mn concentration. From this figure, it appears that a flux of the liquid state flowed out of the pores and then solidified. In addition, many particles with octahedral shape were observed, where the compositions were almost identical to MnAl2O4. From the above, it was found that the Na2O–B2O3 flux penetrated into the interior of the refractory containing Mn, which reacted with Al2O3 to form MnAl2O4 in the interior of the refractory.
3.3 Observations of interface between refractory and flux
As MnAl2O4 was found to form in the interior of the refractory, it may have also formed at the refractory/flux interface. If this is the case, it is expected that MnAl2O4 will accumulate at the interface to form a compound layer. The understanding of the reaction process in terms of whether a compound layer was formed at the refractory/flux interface is critically important for designing an appropriate flux. Thus, the refractory/flux interface was observed.
Figure 8 shows the result of EDS mapping of the cross section of the refractory shown in Fig. 5. From this figure, it was found that no compound layer formed at the interface since no Mn or Al was detected.
4. Discussion
4.1 Approach to designing appropriate flux for this system
As mentioned above, to design an appropriate flux, it is important not only to prevent the metallic melt from oxidizing but also to dissolve as much as possible of the Mn oxide that forms on the surface of the melt. Since such a designed flux may also dissolve oxides constituting the refractory, it is necessary to design the composition of the flux that satisfies these contradictory requirements. To achieve this, it is important to understand the factors affecting refractory corrosion and the dissolution of Mn oxide in the flux.
In sections 4.2 and 4.3, the factors affecting refractory corrosion and the dissolution of Mn oxide are discussed, respectively, then in section 4.4, design guidelines for the flux composition necessary for this system are discussed.
4.2 Factors affecting refractory corrosion
It has been reported that the use of a thermodynamic database of a multicomponent oxide solution is effective for predicting the refractory corrosion by a flux.1) In addition, it has been reported that the corrosion in the interior of the refractory should also be taken into account9) because of the penetration of the flux into the refractory through its micropores generated by capillary action. The experimental results of refractory corrosion in this study were analyzed from these two viewpoints.
4.2.1 Relationship between thermodynamic solubility of refractory in flux and corrosion rate of refractory
Figure 9 shows the phase diagram of the Al2O3–SiO2–Na2O–B2O3 pseudo-quaternary system with the mass fraction at 1000°C calculated by FactSage7.3, which is sectioned by the plane of Al2O3:SiO2 = 3:2 with the molar ratio. Although the equilibrium calculation was performed for 1050°C, the temperature at which the experiments were conducted, the calculation did not converge in part of the Na2O-rich liquid phase region; therefore, this calculation was replaced with the calculation for 1000°C.
Using this figure, one can determine the thermodynamic solubility of mullite (Al6Si2O13) for each flux from the length of the lines drawn in the liquid phase connecting each composition of flux with Al6Si2O13 at an edge point. When the system reaches the equilibrium state, it is expected that the higher the thermodynamic solubility, the more strongly the refractory will be corroded.
According to the figure, the relationship between thermodynamic solubility and $x_{\textit{Na}_{2}\textit{O}}$ appears to deviate from that between the corrosion ratio of the refractory δ and $x_{\textit{Na}_{2}\textit{O}}$ in Fig. 3, which indicates that δ monotonically increases with $x_{\textit{Na}_{2}\textit{O}}$. Therefore, it was found that the refractory corrosion in this system is not explained only by the thermodynamic solubility of mullite in the Na2O–B2O3 melt.
4.2.2 Corrosion in interior of refractory by flux that penetrated
We now consider the corrosion in the interior of the refractory by the flux that penetrated in terms of the surface tension and viscosity of the flux. Equation (2) represents the horizontal distance a liquid moved as it penetrates a single capillary tube,7) where l is the distance of liquid penetration, γ is the surface tension of the liquid, η is the viscosity of the liquid, r is the radius of the capillary tube corresponding to the average radius of the pores in the refractory, θ is the contact angle between the liquid and the solid, and t is time.
| \begin{equation}
l^{2}=(r\cos\theta)\cdot(\gamma/\eta)\cdot t
\end{equation}
| (2) |
As is evident from eq. (2), a high surface tension and a low viscosity can facilitate the penetration of flux into the interior of the refractory through the pores. This is based on the assumptions that the pore radius r is the same throughout the refractory and that cos θ is equal to 1 regardless of the flux composition because a system comprising solid and liquid oxides has good wettability. Generally, when the concentration of Na2O in liquid oxides increases, its surface tension also increases.20) Similarly, Mn also has the same effect of increasing the surface tension.20) As shown in Fig. 4(b), the higher the concentration of Na2O, the higher the Mn concentration after corrosion tests. It is believed that the penetration into the interior of the refractory is likely due to a synergistic effect of increased Na and Mn contents, which increase the surface tension.
Furthermore, when the concentration of Na2O in the flux is high, the driving force for the capillary action is expected to be further enhanced because the viscosity of the flux decreases owing to the breaking of the network structure of the liquid oxide by Na2O. When the flux penetrates into the interior of the refractory, the contact area becomes sufficiently large for refractory corrosion to be promoted strongly.
The validity of the above consideration is confirmed by the following reason. As the concentration of Al shown in Fig. 4(a) remained around 1–2 mass% independent of the Na2O content, Al that dissolved as a result of refractory corrosion may not only existed in the bulk of the flux but also accumulated in the interior of the refractory. Therefore, the MnAl2O4 found in the interior of the refractory shown in Fig. 7 appears to have been formed by a process in which Al with locally high concentrations in the interior of the refractory reacted with Mn in flux that penetrated into the refractory. As stated in section 3.1, the reason why the Al and Si concentrations have different trends with respect to $x_{\textit{Na}_{2}\textit{O}}$ can be explained as follows. Si diffuses into the bulk of the flux owing to the corrosion of the refractory, whereas Al reacts with Mn in the flux that penetrated in to the refractory to form MnAl2O4, which accumulates in the interior of the refractory rather than diffuses into the bulk of the flux, resulting in their concentrations in the flux having different tendencies.
Figure 10 shows a schematic diagram summarizing the mechanism of refractory corrosion in this system, in which stages (a), (b) and (c) occur in this order as follows:

-
(a)
Corrosion proceeds from the outer surface of the refractory via contact its with the flux, then the refractory components Al and Si dissolve in the flux. At the same time, Mn in the molten metal dissolves in the flux through its oxidation. Zn in the molten metal also dissolves in the flux by the same process, but the Mn dissolution precedes because Mn oxidizes more easily than Zn.
-
(b)
The flux containing Mn penetrates into the interior of the refractory by capillary action, and the corrosion inside the refractory progresses. At this time, the higher the surface tension of the flux and the lower the viscosity, the more easily the penetration progresses so that the refractory corrosion inside is strongly promoted.
-
(c)
As a result of the corrosion in the interior of the refractory, the reaction of locally concentrated Al with Mn in the flux that penetrated forms MnAl2O4.
Consequently, it is found that the refractory corrosion in this system involves not only the corrosion induced by the thermodynamic driving force, but also the corrosion in the interior of the refractory caused by the flux that penetrated into the refractory. The latter is strongly related to the wettability between the flux and the refractory and, in particular, the surface tension and viscosity of the flux.
4.3 Evaluation of ability of flux to dissolve Mn oxide
As mentioned above, for a flux to prevent a melt from oxidizing, it is important both to prevent the refractory from corroding and to dissolve as much as possible of the oxides formed on the surface of the molten metal in the flux. For this purpose, it is necessary to design a flux that can dissolve a large amount of oxide composed of easily oxidized elements.
Generally, the higher the thermodynamic solubility of Mn oxide in a flux, the more solute can be dissolved in the flux. Therefore, by determining the solubility from thermodynamic databases, we can evaluate the ability of a flux to dissolve Mn oxide. However, since the corrosion tests in this study were conducted under a time constraint of 120 min, corresponding to real batch operations, evaluation not only from a thermodynamic viewpoint but also from a mass transfer viewpoint is important. The ability of the flux to dissolve Mn oxide is next discussed from these two viewpoints.
4.3.1 Relationship between thermodynamic solubility of Mn oxide in flux and amount of Mn dissolved in flux
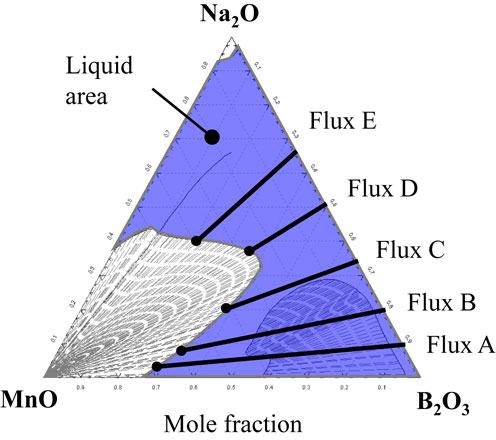
Figure 11 shows the phase diagram of the MnO–Na2O–B2O3 pseudo-ternary system at 1050°C calculated by FactSage7.3. The reason for using MnO as the Mn oxide in the calculation is that MnO is the first oxide formed when Mn and oxygen react in air. Similar to that observed in Fig. 9, the thermodynamic solubility of Mn for each flux can be estimated from the length of the lines drawn in the liquid phase.
Figure 12 shows the relationship between the calculated concentration of Mn in the flux equilibrated with solid MnO at 1050°C (X-axis) and the Mn concentration in the flux after the corrosion tests (Y-axis).
It is clear from this figure that the Mn concentration observed in the experiments markedly deviates from that determined from the equilibrium states. Therefore, it is suggested that the viewpoint of mass transfer, which controls the mobility of Mn ions in the flux, is more important than that of thermodynamic equilibrium in this study. However, note that the assessments of the Na2O–B2O3 and MnO–B2O3 systems in the database were well performed, but that of MnO–Na2O has not been well assessed in the Fact Oxide database in FactSage7.3.
4.3.2 Relationship between viscosity of flux and amount of Mn dissolved in flux
In general, a basic oxide such as Mn oxide normally decomposes into metal and oxygen ions in an oxide melt, and the mass transfer of these metal ions strongly depends on the flow speed of the oxide melt. When a constant shear stress in the oxide melt, which is caused by, for example, the rotation of the refractory, the lower the viscosity of the oxide melt is, the greater the flow speed of the flux can be obtained. Therefore, the viscosity of a flux appears to be an important factor in evaluating the ability of the flux to dissolve Mn oxide from the viewpoint of mass transfer.
Figure 13 shows the relationship between the Mn concentration in the flux after the corrosion tests and the viscosity of each flux at 1050°C calculated by the Viscosity module of FactSage7.3. As can be seen from the figure, the Mn concentration in the flux after the corrosion tests tends to be inversely proportional to the viscosity η of the flux; therefore, it strongly depends on the mass transfer of Mn ions in the flux. The Mn ions appear to dissolve in the flux after metallic Mn is oxidized by oxygen in air or in the flux.

From the above consideration, the tendency of the Mn concentration to monotonically increase with $x_{\textit{Na}_{2}\textit{O}}$ (Fig. 4(b)) can be explained as follows. When the mole fraction of Na2O in the flux increases, the viscosity of the flux decreases owing to the breaking of the network structure in the molten Na2O–B2O3 flux. This facilitates a large flow of flux to be obtained under the constant shear stress induced by the surface of the rotating refractory, and the mass transfer of Mn in the flux is promoted. Therefore, the Mn concentration in the flux increased monotonically with $x_{\textit{Na}_{2}\textit{O}}$.
4.4 Guidelines for designing composition of flux in this system
From the above considerations, some guidelines for designing the appropriate composition of the flux in this system are given here. In terms of minimizing the refractory corrosion, it is important not only to reduce the thermodynamic solubility of the refractory in the flux but also to suppress the penetration of the flux into the interior of the refractory. On the other hand, to maximize the amount of Mn oxide dissolved in the flux under the time constraint of 120 min, reducing the viscosity of the flux is more important than reducing the thermodynamic solubility of Mn oxide in the flux.
Therefore, to design an appropriate flux in this study, we found that further investigation of the wettability between the flux and the refractory, the properties of the flux, particularly the penetration ability of the flux is critically important as well as the thermodynamic solubility.
5. Conclusion
The aim of this study was to provide guidelines for designing the composition of the flux to both minimize refractory corrosion caused by contact with the flux and maximize the solubility of Mn oxide in the flux in the melting of Cu–Zn–Mn in air. The conclusions are as follows.
-
(1)
Although the corrosion ratio of the refractory increased with the mole fraction of Na2O in the flux, the concentration of Al in the flux, one of the refractory constituents, exhibited a different tendency from the corrosion ratio.
-
(2)
Through the corrosion tests, we found that the Na2O–B2O3–based flux penetrated into the refractory, and part of Mn in the flux reacted with Al2O3 to form MnAl2O4. However, a compound layer at the refractory/flux interface induced by the reaction between the constituents of the flux was not confirmed.
-
(3)
The relationship between the corrosion ratio and the equilibrium solubility of 3Al2O3·2SiO2 for Na2O–B2O3 flux was investigated by thermodynamic calculation. Not clear relationship was observed between them. This can be explained by the effect of corrosion inside the refractory caused by the penetration of the flux through its pores, which is strongly related to the wettability between the flux and the refractory, particularly the surface tension and viscosity of the flux.
-
(4)
The Mn concentration in the flux after the corrosion tests considerably differed from that determined from the equilibrium states. On the other hand, it strongly correlated with the viscosity of the flux, which is related to the mass transfer of Mn ions in the flux.
-
(5)
To design an appropriate composition of the flux in this study, we clarified that the thermodynamic approach alone is insufficient, and further investigation, for example, the wettability between the flux and the refractory, and the properties of the flux, particularly those associated with the penetration phenomenon is required.
REFERENCES
- 1) A. Malfliet, S. Lotfian, L. Scheunis, V. Petkov, L. Pandelaers, P.T. Jones and B. Blanpain: J. Eur. Ceram. Soc. 34 (2014) 849–876.
- 2) L. Chen, S. Li, P.T. Jones, M. Guo, B. Blanpain and A. Malfliet: J. Eur. Ceram. Soc. 36 (2016) 2119–2132.
- 3) S. Taira, K. Nakashima and K. Mori: ISIJ Int. 33 (1993) 116–123.
- 4) Y. Lei, Y. Uchida, T. Yoshikawa, C.Q. Jia and K. Morita: ISIJ Int. 54 (2014) 1218–1221.
- 5) K. Mukai, J.M. Toguri and J. Yoshitomi: Can. Metall. Quart. 25 (1986) 265.
- 6) I. Hasegawa, T. Koizumi, M. Suzuki and T. Tanaka: Collected Abstracts of the 2017 Autumn Meeting of Japan Inst. of Copper, (2017) p. 99.
- 7) Y. Yoshimura, K. Kita, T. Koizumi: Nickel–free white copper alloy and its method of production, Japan Patent JP3915889B2, 2007-02-16.
- 8) Y. Sugimoto, T. Fukuyama: Copper alloy for excellent slide fastener having continuous castability, Japan Patent JP3713233B2, 2005-08-26.
- 9) W.E. Lee and S. Zhang: Int. Mater. Rev. 44 (1999) 77–104.
- 10) K.H. Sandhage and G.J. Yurek: J. Am. Ceram. Soc. 73 (1990) 3643–3649.
- 11) Z. Yu, K. Mukai, K. Kawasaki and I. Furusato: J. Ceram. Soc. Jpn. 101 (1993) 533–539.
- 12) S. Zhang and W.E. Lee: Int. Mater. Rev. 45 (2000) 41–58.
- 13) Chemical Reaction of Ceramics, (The Technical Association of Refractories, Tokyo, 2009) p. 139.
- 14) K. Strauss: Applied Science in the Casting of Metals, (Pergamon Press, Oxford, 1970) pp. 159–309.
- 15) A.D. Pelton and M. Blander: Metall. Trans. B 17 (1986) 805–815.
- 16) Z.A. Foroulis and W.W. Smeltzer: Metal–Slag–Gas Reactions and Processes, (The Electrochemical Society, Princeton, New Jersey, 1975) pp. 784–806.
- 17) D.V. Neff: AFS Trans. 97 (1989) 439–450.
- 18) C.W. Bale, A.D. Pelton, W.T. Thompson and G. Eriksson: FactSage, Ecole Poly-technique, Montreal (2001) http://www.crct.polymtl.ca. (Accessed on 30 May, 2019).
- 19) O. Knacke, O. Kubaschewski and K. Hesselmann: Thermochemical Properties of Inorganic Substances, 2nd ed., (Springer-Verlag, Verlag Stahleisen, 1991).
- 20) R.E. Boni and D. Derge: Trans. Met. Soc. AIME 206 (1956) 53–59.