Abstract
We investigated the microstructural changes in carburized steel due to high stress rolling contact fatigue (RCF) in this study. The changes consisted of the formation of white bands (WBs), including the low angle bands (LABs) and high angle bands (HABs), following the formation of a dark etching area (DEA) in the bearing steels below the contact surface. Although several studies have analyzed the characteristics of WBs, their formation mechanism has not been sufficiently elucidated. We analyzed the orientation of the crystal constituting the WBs and investigated their relationship with the direction of the shear stress generated by the rolling contact. The morphology of the WBs as a function of depth from the surface was studied using an optical microscope, and the crystal orientation was analyzed using scanning electron microscopy–electron backscattering diffraction. It was found that the LABs and HABs respectively formed at a depth where the principal and orthogonal shear stresses were at their maximum. The results of the crystal orientation analysis revealed that the crystal were rotated under the principal shear stress at a specific depth, resulting in the formation of textures such as {111}⟨211⟩ and {122}⟨411⟩ in LABs and HABs, respectively. Thus, the WBs were revealed to be a type of shear band. The WB formation behaviors of the specimens with varying amounts of initially retained austenite (γR) were compared to elucidate the sub-surface initiated spalling life improvement mechanism of the γR. However, the WB formation behavior showed no difference regardless of the amount of initial γR. This suggested that the WB formation was not directly related to the sub-surface initiated spalling life.
This Paper was Originally Published in Japanese in J. Japan Inst. Met. Mater. 83 (2019) 388–397. The captions of Fig. 1–10, 12–16 are slightly changed.
1. Introduction
Rolling bearings are mechanical parts that support loads by a point or line contact. A high-contact stress level of several GPa acts locally on the rolling contact surface. Therefore, high-strength steels are used for fabricating races and rolling elements, which are components of rolling bearings. In recent years, awareness regarding the protection of the environment has increased globally; a reduction in size and weight of the rolling bearings would contribute significantly to energy and resource conservation. As a result, the contact condition between the race and rolling element is crucial; the dark etching area (DEA), dark etching constituent (DEC), and dark etching region (DER)1–13) are more likely to occur in a high-stress region under the rolling track, owing to rolling contact fatigue (RCF). When the number of fatigue cycles increases, characteristic microstructures appear, such as the white band (WB) or white etching band (WEB),7–20) which elongate into a specific angle relative to the rolling direction and are regularly aligned. WBs are classified as low angle bands (LABs) or high angle bands (HABs) when the elongating angle with respect to the rolling direction is 20–35° or 65–85°, respectively. These bands can be evidently distinguished from the irregularly shaped white etching area (WEA),21) which forms when vibrations or slips between the race and rolling element occur, resulting in a hydrogen intrusion into the steel. Furthermore, WBs are a type of shear band, and several studies considering detailed observations of their morphology have been reported.
According to previous studies, LABs are characterized based on their light contrast structure under an optical microscope when etched with nital, and appear in high stress regions below the rolling contact surface. Swahn et al.8) reported that each LAB consists of a disk morphology with a diameter and thickness of approximately 5–30 µm and 0.1–0.5 µm, respectively, and is estimated to be aligned at intervals of 0.5–10 µm. Conversely, Voskamp et al.11) reported that the thickness of the LABs is approximately 2 µm. Thus, the shape is considered to vary depending on the rolling contact conditions. LABs are composed of ferrite, which has a carbon concentration lower than that of the matrix. The carbon precipitates along each LAB band as lenticular carbides.20,22,23) However, each band is harder than the surrounding matrix for reasons that have not been explained. Furthermore, LABs have been reported to consist of fine ferrites based on the detailed microstructural analysis using transmission electron microscopy (TEM).10,14,20) HABs, another type of WBs, are also characterized by their light contrast structure using nital etching. HABs form at a subsurface depth similar to LABs, but are confirmed at a depth closer to the surface than that of the LABs and a higher formation angle with respect to the rolling direction. Swahn et al.8) reported that an HAB is a band that is approximately 100 and 10 µm in length and thickness, respectively, and is aligned at 5–50 µm intervals. Furthermore, TEM observations revealed that the HABs consist of significant plastic deformed ferrites with cell sizes of approximately 0.2 µm. Mitamura et al.16) reported that DEA is generated due to the repeated plastic deformation of lath martensite followed by the formation of dislocated cells. This results in the appearance of locally refined HABs as it progresses. These two types of WBs have been reported to be preceded by the LABs;8,19,24) however, there have been cases where the HABs precede when the contact stress is high.16,25) Therefore, the order of their appearance was considered to depend on the operating conditions of the bearing.
The morphology of WBs was clarified using microstructural analysis, while the mechanism of their formation was explained in terms of dynamics. For instance, Johnson26) concluded that both WBs were shear bands formed using local shear deformation, and the angles of the elongated bands were determined by the principal shear stress at the depth of each generated band. If WBs are shear bands, the constituent grains may have a specific crystal orientation. Voskamp et al.6) and Šmeļova et al.27) reported the results of the crystal orientation caused by the rolling contact. Voskamp et al.6) were the first group to discover the formation of a texture caused by rolling contact. However, since X-ray diffraction (XRD) was used for the texture investigation, which is suitable to measure the average crystal information in a wide area, it was not possible to identify the exclusive crystal orientations in the LABs and HABs. Recently, Šmeļova et al.27) succeeded in measuring the crystal orientations of LABs and HABs using electron backscattering diffraction (EBSD). They reported that both the LABs and HABs consist of a mixed texture of ND // ⟨111⟩ γ-fiber and {001}⟨110⟩, which is a part of the RD // ⟨110⟩ α-fiber and usually found in the cold-rolled textures of α-Fe. Here, ND and RD were the normal directions of the rolling surface and rolling direction, respectively. However, no evident difference was observed between the characteristics of both WBs. Therefore, the origin of the LAB and HAB formation remains unclear. Although the crystal orientation analysis has been conducted as described above, there has been no study that clarifies the shear direction of each WB, and the experimental clarification has been insufficient to compare to that of the theoretical prediction by Johnson.26)
Previous studies have checked for sub-surface initiated spalling or cases involving damage of the bearings in the market; however, there are only a limited number of examples where WB has led to spalling; most of them were initiated by non-metallic inclusions. However, the initiation and propagation of cracks from non-metallic inclusions are expected to relate to microstructural fatigue, that is, the appearance of WBs or microscopic shear deformation, which is the driving force of the WB. Therefore, if these can be suppressed, the sub-surface initiated spalling life of the rolling bearing can be improved. However, although several studies have analyzed the morphology of WBs as described above, only a few studies considered the mechanism of their formation. Therefore, it is necessary to first understand the basic mechanism of these formations to consider measures to suppress microstructural fatigue during rolling contact.
In this study, we aimed to elucidate the formation mechanism of LABs and HABs. These WBs are types of shear band, and specific shear stress was assumed to contribute to their formation. An effective analysis of their crystal orientation is crucial to clarify the formation mechanism of WBs. Therefore, we analyzed the crystal orientation of the microstructure and WBs using the EBSD method to measure the crystal orientation in the microscopic region. In addition, previous studies have reported28) that the sub-surface initiated spalling life can be improved by increasing the amount of retained austenite (γR) at the maximum orthogonal shear stress depth. An assumption of its mechanism implies that γR transforms to martensite during the rolling contact, and this fresh fine hard martensite disperses in the microstructure, thereby suppressing the microscopic plastic deformation of the entire microstructure. Therefore, another objective of our study was to consider the life improvement mechanism using γR through the evaluation of the effect of γR on the microscopic shear deformation and WB formation.
2. Experimental Procedure
2.1 Specimens
A SAE4320 hot-rolled steel bar (26 mm in diameter) was fabricated using actual production equipment. It was cut and heat treated as described below, and then finished to obtain a cylindrical shape of 20 and 36 mm in diameter and width, respectively, following the grinding and super finishing. The chemical composition of the steel used is presented in Table 1. The heat treatment of the specimens included carburizing, quenching, and subsequent tempering. First, the above cylindrical specimens were carburized at 960°C in a carburizing atmosphere for 26 h in order for the carbon concentration in the surface layer to be approximately 1.1%. This was followed by heating the cooled specimens to 820°C, which was maintained for 70 min, and oil quenching them at 80°C. Finally, tempering was performed by maintaining the steel at 180°C for 2 h. The specimen prepared comprised of tempered martensite as the basic microstructure, with γR and cementite. To clarify the effect of γR on microstructural changes (such as WB formation), specimens with reduced γR were obtained using subzero treatment. The specimens were maintained at −196°C for 1 h between quenching and tempering. The aforementioned specimens were the same as those used in the previous report.28) The value of γR measured using XRD was used as a subscript, the specimen which was not subjected to subzero treatment was called S39, and the specimen subjected to the subzero treatment was S6. In a previous study,28) the L10 life, which denotes a 10% probability of failure and was evaluated using the RCF test shown in the next section, was determined to be equal to 120.0 × 10⁶ and 1.9 × 10⁶ cycles for S39 and S6, respectively.

Table 1 Chemical composition of steel used (mass%).
The machine schematic used for the RCF test is shown in Fig. 1. This test machine was used to rotate one specimen (20 and 36 mm in diameter and width, respectively) against two JIS-SUJ2 steel balls (31.75 mm in diameter) supported by three guide rollers. The lubricating oil was applied to the specimen surface through a driving roll. The test conditions are listed in Table 2. The test load was set such that the Hertzian maximum pressure to be 5.8 GPa, and the depth z0 at which the orthogonal shear stress, which affects the sub-surface initiated spalling life, had a maximum value was 0.24 mm. The RCF test of the specimens described in the previous section was performed; the test was stopped at an arbitrary number of cycles until spalling occurred. The specimens were subjected to microstructure analysis.
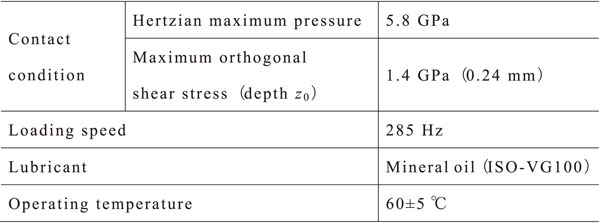
Table 2 Rolling contact fatigue test conditions.
To elucidate the changes in the microstructure and crystal orientation due to RCF, microstructural observation with an optical microscope, and phase and crystal orientation analysis using EBSD was performed. The microstructural observation was carried out on a fatigued specimen cut in a plane parallel to the rolling direction at the center of the rolling contact surface. The specimens were mirror polished and etched with nital (95% methanol and 5% nitric acid). The phase and crystal orientations were measured using an EBSD data collection system (TSL OIM) attached to a field emission-scanning electron microscopy (FE-SEM) with an acceleration voltage of 15 kV, working distance of 15 mm, and step size of 40 nm. The measurement was performed on a cross-section obtained by cutting a sample in the same manner as in the optical microstructure observation, followed by mirror polishing using colloidal silica. In addition, some samples were measured at a step size of 20 nm to analyze the fine microstructure in detail. Measurement points with CI (Confidence Index) values of less than 0.1 and crystal orientation differences with adjacent pixels of 5° or more were excluded from the data processing analysis.
3. Experimental Results
3.1 Changes in microstructure due to RCF
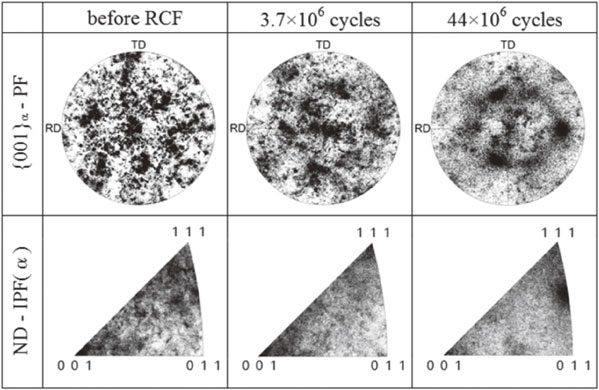
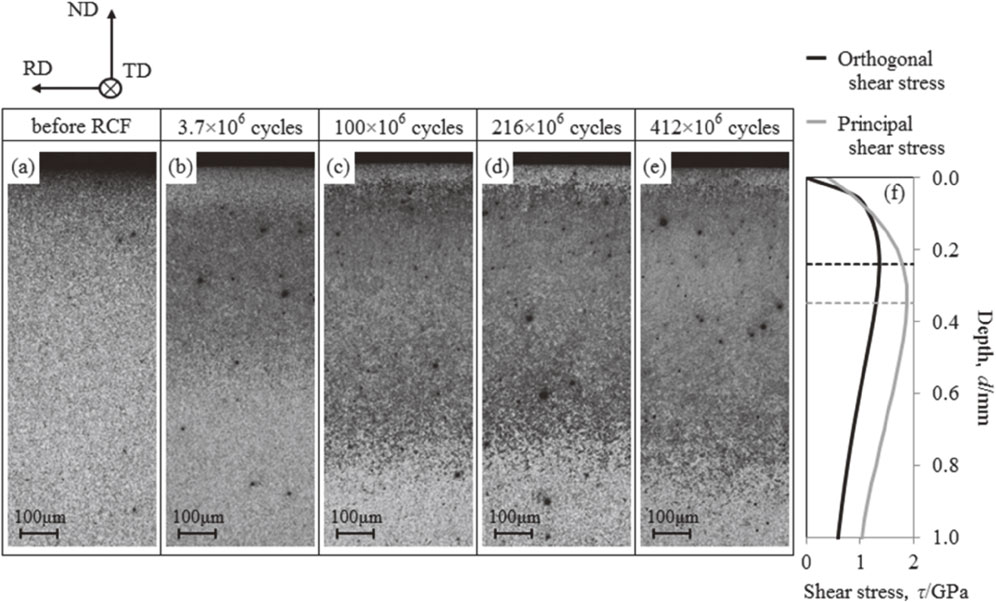
To elucidate the microstructural changes due to RCF, the microstructure of S39, which has a long sub-surface initiated spalling life and can be traced to large stress cycles, was investigated with an optical microscope. The microstructural observations were made before RCF and after stress cycles of 3.7 × 10⁶, 100 × 106, 216 × 106, and 412 × 106. The results are shown in Fig. 2, which denotes the rolling direction (RD), rolling surface transverse direction (TD), and rolling surface normal direction (ND) of the specimen. The direction of the load (ball) movement was opposite to that of the RD during the rolling process. First, the DEA was observed to be centering at an approximate depth of 0.24 mm below the rolling contact surface (depth z0) at 3.7 × 10⁶ cycles (Fig. 2(b)). The region expanded by 100 × 106 cycles (Fig. 2(c)). The black spots in the DEA were observed to be voids formed due to the removal of non-metallic inclusions during the preparation of the cross-sectional observation samples.29) Furthermore, the microstructural changes described below were observed at 216 × 106 (Fig. 2(d)) and 412 × 106 cycles (Fig. 2(e)). Figure 3 shows the results of the high-magnification observation of the region where these microstructural changes occurred. Although it cannot be clearly confirmed from Figs. 2(d) and (e) of the low magnification observations, the WBs previously reported7–20) can be evidently observed at a high magnification. Considering the direction of the elongated microstructures with the white contrast relative to the RD, they were identified as the HABs (Figs. 3(a), (b), (d) and (e)) and LABs (Figs. 3(e) and (f)), respectively. As shown in Figs. 3(a) and (f), the formation angle with respect to the RD was 75 and 20° for the HABs and LABs, respectively. Furthermore, after the HABs appeared at a depth of 0.24–0.35 mm, the LABs appeared at a depth of 0.35–0.45 mm, and the microstructural changes were confirmed to occur in the order of DEA, HABs, and LABs. Mitamura et al.16) reported that the HABs appeared prior to LABs when the Hertzian contact stress was 4.6 GPa or higher. In this study, the Hertzian contact stress was 5.8 GPa, which was consistent with their result. Furthermore, Johnson26) predicted that the HABs and LABs appeared at the maximum orthogonal and principal shear stress depths, respectively, as determined from the Hertzian contact theory. In this study, the maximum orthogonal and principal shear stress depths were calculated to be 0.24 and 0.35 mm, respectively, as shown in Fig. 2(f). These values approximately coincided with the depth where the HABs and LABs appeared in Fig. 3. As described above, the microstructural changes previously reported were reproduced in this study.
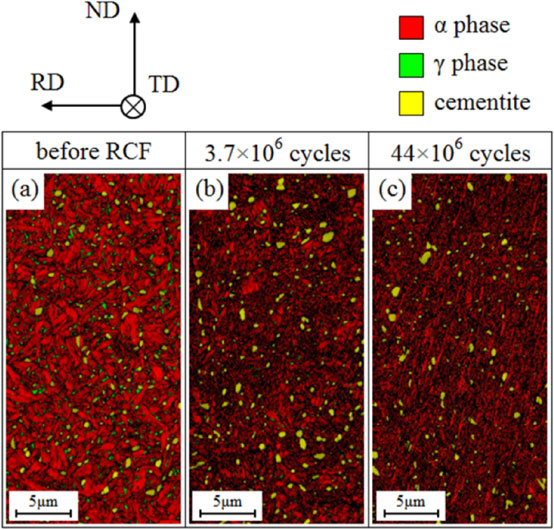
For an in-depth understanding of the two types of WBs investigated using the optical microstructure observation, a microstructure analysis of S39 was performed using EBSD. Figure 4 shows the phase map overlaid on an IQ (Image Quality) map measured at a depth of 0.24 mm at the maximum orthogonal shear stress depth. The EBSD was performed before RCF and after the stress cycles of 3.7 × 10⁶, 44 × 106, 216 × 106, and 412 × 106. Figure 4(a) reveals that the α phase, which corresponds to the tempered martensite, and the γ phase, which corresponds to the γR, and cementite were present before RCF. In Fig. 4, γR evidently decreased with increasing number of cycles. Furthermore, the bands elongated in a specific direction and became more apparent up to 216 × 106 cycles, but became unclear as the number of cycles increased. These elongated bands were considered to be the HABs because they have an angle of approximately 75° with respect to the RD, as shown in Fig. 4(d). These HABs had a high IQ value, which is an index of crystallinity suggesting that the amount of strain, that is, dislocation density, inside the structure was qualitatively lower than that of the surrounding matrix. In addition, the HABs were composed of an α phase, which supported the results of the previous studies.8,10,14) Furthermore, regarding the number of cycles it takes for the HABs to appear, very minute HABs appeared even at 3.7 × 10⁶ cycles as shown by the arrows in Fig. 4(b). These number of cycles were significantly less than the number of cycles confirmed with both an optical microscope in this study (between 100 × 106 and 216 × 106 cycles) and the previous studies (107–108 cycles or more).8,19,24) The HABs, which have been thought to appear at the end of RCF, may have already formed as micro nuclei in the early stage of RCF.

Figure 5 shows the phase map overlaid on an IQ map measured at a depth of 0.45 mm at the maximum principal shear stress depth. Here, to exclusively analyze the LABs, the measurement was conducted at a depth of 0.45 mm, where the principal shear stress was large and an HAB was rarely observed. This is because HABs and LABs were mixed at a depth of 0.35 mm at the maximum principal shear stress depth, as shown in Fig. 3. In this region, similar to the results at the depth of 0.24 mm, tempered martensite, γR, and cementite existed before RCF, and γR tended to decrease with an increasing number of RCF cycles. In addition, as the number of cycles increased, LABs elongated in the direction of approximately 25° with respect to the RD as indicated by the arrows in Fig. 5(d). The LABs and HABs were confirmed to be composed of an α phase; however, the IQ value of LABs were not as high as that of HABs, indicating a high dislocation density. Furthermore, the LABs appeared later than HABs and remained at least up to 412 × 106 cycles.

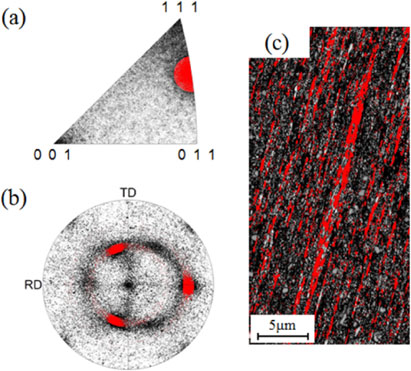
To determine the mechanism of the WB formation, the changes in the crystal orientation due to RCF were analyzed. Figure 6 shows the {001}α pole figures and the ND inverse pole figures of an α phase obtained at a depth of 0.24 mm. These results indicated that textures develop due to RCF; specifically, the increase in ND // ⟨001⟩, ND // ⟨111⟩ and ND // ⟨122⟩-⟨233⟩ for which the orientation slightly changes with an increasing number of cycles, was confirmed. In this study, the expression {hkl}⟨uvw⟩ was used, where {hkl} is the crystallographic plane parallel to the rolling contact plane and ⟨uvw⟩ is the crystallographic direction parallel to the rolling direction. Here, ND // ⟨001⟩ denoted a texture with a predominant orientation of {001}⟨110⟩ from the pole figures. Thus, it was considered to be part of the texture similar to the α-fiber in the cold-rolled bcc-Fe. Furthermore, ND // ⟨111⟩ denoted a texture with a predominant orientation of {111}⟨211⟩ from the pole figures. Thus, it was considered to be part of the texture similar to that of the γ-fiber. As describe above, texture similar to the cold-rolled type were likely to form in the RCF. Conversely, ND // ⟨122⟩-⟨233⟩, which had the largest intensity, has not been confirmed in the cold-rolled textures. Therefore, this texture was considered to be specific to RCF. To clarify the distribution of this texture in the microstructure, ND // ⟨122⟩ was colored in red with a tolerance angle of 5° in the ND inverse pole figure of α at 216 × 106 cycles, as shown in Fig. 7(a). Moreover, the data points colored in red in the ND inverse pole figure of α were linked to the {001}α pole figure (Fig. 7(b)) and IQ map (Fig. 7(c)). Based on Fig. 7(b), this texture consisted of a crystal orientation close to that of {122}⟨411⟩. Furthermore, it can be inferred from Fig. 7(c) that the HABs had {122}⟨411⟩ orientation by superimposing the {122}⟨411⟩ oriented area in the IQ map. Though it is not possible with XRD,6) the exploitation of EBSD has aided in determining the orientation of HABs. In this study, it was clarified that the textures of {001}⟨110⟩, {111}⟨211⟩, and {122}⟨411⟩ developed during rolling contact. These were identical to the three types of textures reported by Voskamp et al.6) using XRD analysis.


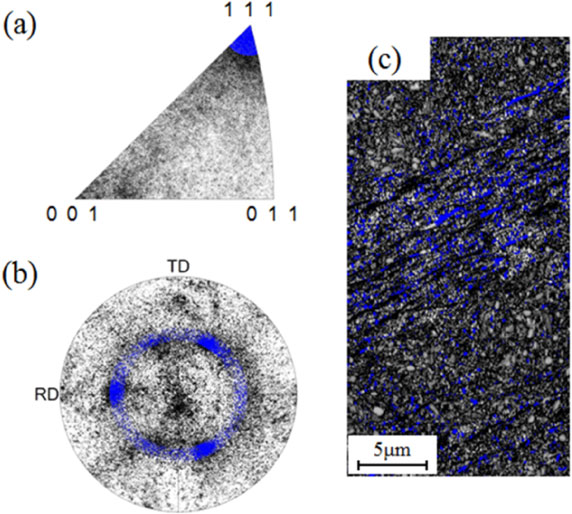
Considering the discussion of LABs, Fig. 8 shows the {001}α pole figures and the ND inverse pole figures of the α phase obtained at the depth of 0.45 mm. These results indicated that textures developed due to RCF in the depth of 0.45 mm as well as 0.24 mm. However, ND // ⟨122⟩-⟨233⟩, which was determined to be a feature of RCF, was not confirmed at the depth of 0.45 mm. Conversely, ND // ⟨111⟩ was more apparent than that at the depth of 0.24 mm. To clarify the distribution of ND // ⟨111⟩ in the microstructure, ND // ⟨111⟩ was colored in blue with a tolerance angle of 5° in the ND inverse pole figure of α at 412 × 106 cycles as shown in Fig. 9(a). Moreover, the data points colored in blue in the ND inverse pole figure of α were linked to the {001}α pole figure (Fig. 9(b)) and IQ map (Fig. 9(c)). Figures 9(b) and (c) noticeably demonstrate that the LABs predominantly had {111}⟨211⟩ orientations.
4. Discussion
4.1 Formation mechanism of WB
4.1.1 HAB
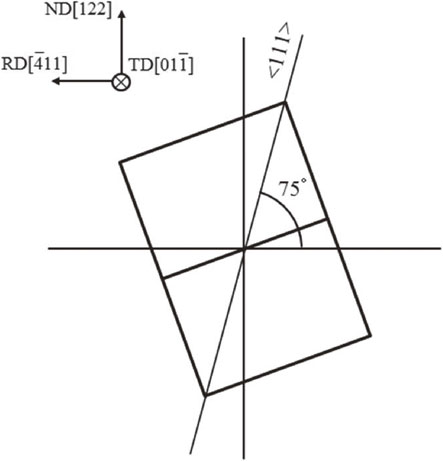
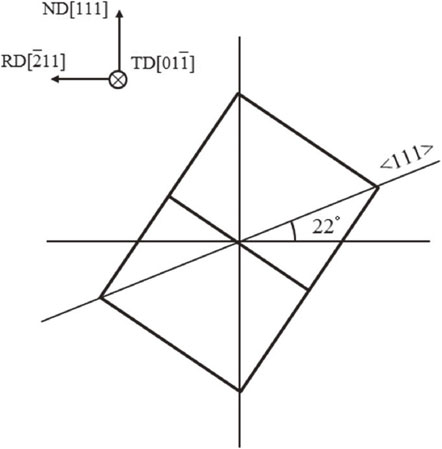
HABs appeared near the maximum orthogonal shear stress depth. Furthermore, the direction of the elongated band was assumed to be determined by the orthogonal shear stress. In addition, the HABs have a specific crystal orientation, which suggested that they are microstructures formed by shear deformation. However, a bcc crystal generally has 12 slip systems; thus, it is not possible to specify the slip plane and direction that causes the formation of HABs using the EBSD analysis. Therefore, we attempted to determine them by considering the state of internal stress during the rolling contact process as predicted by Johnson.26) He explained that HABs and LABs were formed by the principal shear stresses at each depth. Therefore, the planes on which the principal shear stress acts, which changes with depth, is assumed to determine the directions of the characteristic elongated HABs and LABs. The planes, where the principal shear stress acts, were expected to make a 45° angle with respect to the RD at the depth where its magnitude was at its maximum. However, the angle was predicted to change with depth. In particular, at the maximum orthogonal shear stress depth, the angle was calculated to have rotated to approximately 65° (when the residual stress of RD was 0 MPa). In addition, when compressive residual stress was applied to the RD during the rolling contact process, the angle further rotated to a 90° angle (ND) depending on the magnitude. Here, the angle of the plane in which the principal shear stress acted was determined using ρ/p0 as a parameter, where p0 is the Hertzian maximum pressure and ρ is the 2compressive residual stress of RD. The angle was approximately 80° and in the range of −0.10 ≦ ρ/p0 ≦ −0.05. In this study (p0 = 5800 MPa), ρ was approximately −600 MPa as shown in the previous report.28) Therefore, ρ/p0 was about −0.1, and the planes where the principal shear stress acted were estimated to rotate to approximately 80° with respect to RD. Figure 10 schematically shows the crystal orientation of {122}⟨411⟩ that constitutes the HABs. In the orientation of {122}⟨411⟩, the direction ⟨111⟩, which was the slip direction of the {011} slip plane of the bcc crystal, had an angle of approximately 75° with respect to RD. Therefore, the {122}⟨411⟩ orientation was confirmed to make the approximate predicted angle of planes where the principal shear stress acted.26) In addition, this orientation was consistent with the angle of the elongated HABs as shown in Figs. 3(a) and 4(d). In conclusion, the EBSD analysis of the HABs clarified that the principal shear stress acting in the direction of approximately 80° with respect to the RD determined not only the elongated direction, but also the crystal orientation of the HABs.
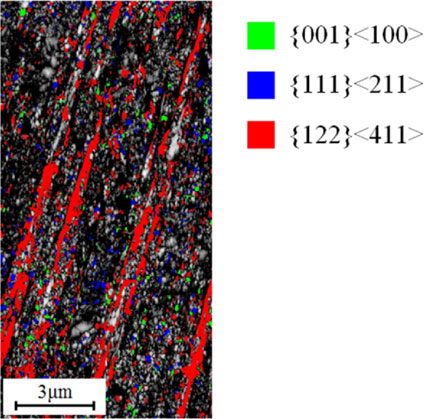
The appearance of {122}⟨411⟩ was first reported by Voskamp et al.6) using a pole figure measured by XRD. However, they explained that {122}⟨411⟩ was caused by the twin deformation of {001}⟨110⟩, which was initially formed. We also verified this possibility in this study. Figure 11 shows the IQ map of the α phase obtained from the EBSD data measured at a step size of 20 nm for a sample with 216 × 106 cycles. The grains colored in green, blue, and red with a tolerance angle of 5° on the IQ map were {001}⟨110⟩, {111}⟨211⟩, and {122}⟨411⟩, respectively. Thus, the locations of {001}⟨110⟩ and {122}⟨411⟩ in the IQ map was observed not to be adjacent to each other. Therefore, {122}⟨411⟩ was considered to be formed by the principal shear stress, as discussed in this section, not by twin deformation in {001}⟨110⟩.
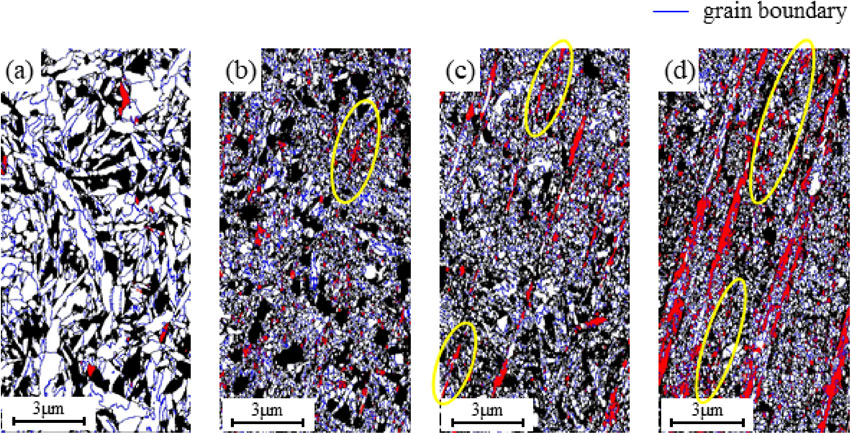
A detailed analysis of the HABs structure can allow us to obtain new insights on the formation mechanism of HABs. Figure 12 shows the grain boundary map of the α phase obtained from the EBSD data measured at a step size of 20 nm. The grain boundary was defined as the boundary where the misorientation angle between the adjacent measurement pixels was 5° or more. The measurements were performed before RCF and after stress cycles of 3.7 × 10⁶, 44 × 106 and 216 × 106. Here, the regions shown in red were the grains with {122}⟨411⟩ with a tolerance angle of 5°. In the region surrounded by the solid yellow line in Fig. 12(d), the small {122}⟨411⟩ grains were confirmed to align in the same direction as that of the HABs. These aligned {122}⟨411⟩ small grains appeared at 3.7 × 10⁶ cycles, and the length and width was observed to increase with increasing number of cycles (Figs. 12(b) and (c)). Therefore, the {122}⟨411⟩ oriented band was assumed to first form as minute nuclei, and then form large HABs via repeated growth and coalescence in the direction of 75° with respect to RD due to RCF. The formed HABs were composed of coarse grains with low dislocation density, which had a small orientation change within the bands and relatively high IQ values. As reported by Swahn et al.,8) this was qualitatively consistent with the fact that the cell size in the HABs was approximately 0.2 µm, which was relatively larger than that of the WEA described below. The WEA, observed in the rolling bearings used for alternators of automobiles and gearboxes of wind power generators, is formed near the depth where the orthogonal shear stress is maximized. The WEA is characterized by its light contrast structure when etched with nital under an optical microscope, which is similar to that of the HABs in the present study. However, since it does not have a specific inclination with respect to RD and occurs when the contact stress is low, it is considered to have a different formation mechanism than that of HABs. Different studies have analyzed the microstructural differences between the HABs and WEA. In the studies focusing on the cell size inside the microstructure, the cell size of WEA was reported to be approximately 20–30 nm (maximum 300 nm), using TEM analysis,30–32) which was finer than that of HABs. In addition, it has been reported that the microstructure of WEAs has been refined to such an extent that the crystal orientation cannot be evidently analyzed using EBSD.33) Compared to these reports, the HABs revealed in this study were confirmed to have different characteristics from WEAs because HABs consist of coarse grains with a relatively low dislocation density and have the specific crystal orientation of {122}⟨411⟩.
In this section, the formation mechanism of LABs was considered. The preferred crystal orientation composed of LABs was {111}⟨211⟩, which was different from HABs; however, the internal principal shear stress during the rolling contact process had a significant role in the mechanism. Johnson26) reported the stress state at the depth where LABs appear prominently; that is, the depth where the principal shear stress was at its maximum. When the residual stress (ρ) of the RD was 0 MPa, the planes where the principal shear stress acted had a 45° angle with respect to the RD. However, as in the previous discussion, when compressive residual stress was applied in the RD as a result of rolling contact, the angle further rotated to the 0° direction (RD) depending on the magnitude of the residual stress. Thus, in the range of approximately −0.125 ≦ ρ/p0 ≦ −0.09, the planes where the principal shear stress acted had an angle of approximately 30° with respect to the RD. In this study, ρ was approximately −700 MPa at the depth where the LABs were formed based on a previous report;28) thus, ρ/p0 was approximately −0.12. In this case, the angle was calculated to be approximately 25° with respect to the RD according to the Johnson model.26) Figure 13 schematically shows the crystal orientation of {111}⟨211⟩ composing LABs. In the orientation of {111}⟨211⟩, the ⟨111⟩ direction, which was the slip direction on the {011} slip plane of the bcc crystal, had an angle of approximately 22° with respect to the RD. This was approximately consistent with the predicted angle of the plane where the principal shear stress acted.26) In addition, although there was a difference of approximately 5° between the result of the optical microscope (Fig. 3(f)) and EBSD (Fig. 5(d)), the LAB angle was in good agreement with the prediction.26) Therefore, the analysis of the crystal orientation of LAB using EBSD concluded that the principal shear stress acting in the direction of approximately 25° with respect to the RD not only determined the elongated direction, but also the crystal orientation of the LABs.
The microstructural changes due to RCF were clarified as described above. In this study, the microstructural changes developed when the Hertzian maximum pressure was 5.8 GPa. However, as previously reported,8,24) a similar change may occur under the condition of approximately 3 GPa or more. The sub-surface initiated spalling caused by RCF occurs from non-metallic inclusions in the steel, but it is possible that the state of the surrounding matrix affects the initiation or propagation behavior of the cracks. In our previous study,28) an increase in the amount of γR in the sub-surface layer improved the sub-surface initiated spalling life. The mechanism was presumed to be caused by the suppression of plastic deformation during RCF due to the dispersion of fine and hard deformation-induced martensites, which transformed from γR. Thus, we evaluated the effect of γR on the formation behavior of WB or the development of {122}⟨411⟩ and {111}⟨211⟩ textures as precursors of WB.
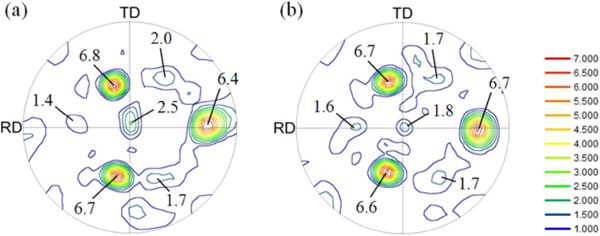
First, a microstructure analysis was performed for S6, which had a smaller amount of γR than that of S39. Figure 14 shows the result of the phase map overlaid on the IQ map measured at a 0.24 mm depth, where the orthogonal shear stress was at its maximum. The measurements were performed before RCF and after the 3.7 × 10⁶ and 44 × 106 stress cycles. Because S6 has a short sub-surface initiated spalling life, it was not possible to measure the microstructures after 44 × 106 cycles. Based on Fig. 14(a), the tempered martensite (α phase) and cementite can be confirmed as initial microstructures before RCF. However, the fractional area of γR was small compared to that of S39 (Fig. 4(a)). The α phase changed in a manner similar to S39 (Figs. 4(b) and (c)), and the HAB precursor structure became evident as the number of cycles increased. However, the HAB was not confirmed as S39 using an optical microscope at 44 × 106 number of cycles. To clarify the textural development during RCF, we measured the {001}α pole figures and the ND inverse pole figures of α corresponding to Fig. 14. Figure 15 shows these results. Similar to S39 (Fig. 6), the textures of {001}⟨110⟩, {111}⟨211⟩, and {122}⟨411⟩ gradually evolved with RCF. To clarify the effect of the amount of the initial γR on the formation of the texture, the {001}α pole figures of S39 and S6 after the same number of cycles (44 × 106) were presented in Fig. 16. The intensities of each texture are shown for comparison. The intensities of {122}⟨411⟩ and {111}⟨211⟩, which were precursor structures of the HAB and LAB, were evidently not different between the two specimens, that is, texture development was found to be equivalent. Therefore, the deformation-induced martensitic transformation of γR during the rolling contact was clarified to not significantly affect the formation of WBs as well as their precursor structures. Namely, the improvement of sub-surface initiated spalling life due to an increase in γR was assumed to be caused by effects other than the suppression of micro shear deformation of the α phase.
5. Conclusions
A rolling contact fatigue test was performed on carburized, quenched, and tempered SAE4320 steel; the microstructure and texture changes with RCF were analyzed in detail using an optical microscope and SEM-EBSD. The following conclusions were obtained:
-
(1)
Microstructural changes appeared in the order of DEA, HABs, and LABs as the number of cycles increased. The HABs appeared near the maximum orthogonal shear stress depth, whereas the LABs appeared near the maximum principal shear stress depth.
-
(2)
The HABs and LABs corresponded to the band structures with {122}⟨411⟩ and {111}⟨211⟩ crystal orientations, respectively. The planes where the principal shear stress acted at the depth where each WB appeared coincided with the ⟨111⟩ slip direction on the {011} slip plane of the corresponding texture. Therefore, it was assumed that both WBs were shear bands and the principal shear stress was the dominant factor forming WB.
-
(3)
Regarding the development of {122}⟨411⟩ and {111}⟨211⟩ oriented WBs for samples with different initial γR values using subzero treatment, no clear difference was observed. Therefore, the improvement of sub-surface initiated spalling life due to an increase of γR was assumed to be caused by effects other than the suppression of micro shear deformation of the α phase.
REFERENCES
- 1) A.B. Jones: Steel 119 (1946) 68–70.
- 2) K. Sugino, K. Miyamoto, M. Nagumo and K. Aoki: Trans. ISIJ 10 (1970) 98–111.
- 3) S. Shiko, K. Okamoto and S. Watanabe: Tetsu-to-Hagané 54 (1968) 1353–1366.
- 4) M. Kuroda: Trans. Jpn. Soc. Mech. Eng. 26 (1960) 1258–1271.
- 5) H. Muro and N. Tsushima: Wear 15 (1970) 309–330.
- 6) A.P. Voskamp and E.J. Mittemeijer: Metall. Mater. Trans. A 27 (1996) 3445–3465.
- 7) A.B. Jones: Forty-ninth Annual Meeting, (American Society for Testing Materials, ASTM International, New York, 1946) pp. 35–52.
- 8) H. Swahn, P.C. Becker and O. Vingsbo: Metall. Trans. A 7 (1976) 1099–1110.
- 9) J.J. Bush, G.L. Grude and G.H. Robinson: Trans ASM 54 (1962) 390–412.
- 10) R. Österlund and O. Vingsbo: Metall. Trans. A 11 (1980) 701–707.
- 11) A.P. Voskamp: J. Tribol. 107 (1985) 359–364.
- 12) J.H. Kang, B. Hosseinkhani and P.E.J. Rivera-Díaz-del-Castillo: Mater. Sci. Technol. 28 (2012) 44–49.
- 13) A. Warhadpande, F. Sadeghi and R.D. Evans: Tribol. Trans. 56 (2013) 349–358.
- 14) J.A. Martin, S.F. Borgese and A.D. Eberhardt: J. Basic Eng. 88 (1966) 555–565.
- 15) J.L. O’Brien and A.H. King: J. Basic Eng. 88 (1966) 568–571.
- 16) N. Mitamura, H. Hidaka and S. Takaki: Mater. Sci. Forum 539–543 (2007) 4255–4260.
- 17) A.P. Voskamp, R. Österlund, P.C. Becker and O. Vingsbo: Met. Technol. 7 (1980) 14–21.
- 18) I. Polonsky and L. Keer: J. Mech. Phys. Solids 43 (1995) 637–669.
- 19) M.E. Laithy, L. Wang, T.J. Harvey, B. Vierneusel, M. Correns and T. Blass: Extended Abstracts of STLE Annual Meeting, (Society of Tribologists and Lubrication Engineers, Park Ridge, Illinois, 2019) Available from: https://www.stle.org/images/pdf/STLE_ORG/AM2019%20Presentations/Rolling%20Element%20Bearings/STLE2019_Rolling%20Element%20Bearings%20II_Session%206A_The%20Evolution%20of%20Dark%20Etching%20Regions%20and%20White%20Etching%20Bands.pdf.
- 20) H. Fu and P.E.J. Rivera-Díaz-del-Castillo: Metals 9 (2019) 491–504.
- 21) For example, J. Gegner: Tribological Aspects of Rolling Bearing Failures, Tribology – Lubricants and Lubrication, ed. by Dr. C.-H. Kuo, (InTech, 2011) ISBN: 978-953-307-371-2, Available from: https://www.intechopen.com/books/tribology-lubricants-and-lubrication/tribological-aspects-of-rolling-bearing-failures.
- 22) S. Okita, H. Takemura and Y. Murakami: CAMP-ISIJ 12 (1999) 351–354.
- 23) J.M. Beswick: Pract. Metallogr. 12 (1975) 200–206.
- 24) H. Takemura and Y. Murakami: CAMP-ISIJ 10 (1997) 544.
- 25) K. Hiraoka: Tetsu-to-Hagané 94 (2008) 636–643.
- 26) K.L. Johnson: Technical report CUED/C-MECH/TR.42, (Department of Engineering, University of Cambridge, 1988).
- 27) V. Šmeļova, A. Schwedt, L. Wang, W. Holweger and J. Mayer: Int. J. Fatigue 98 (2017) 142–154.
- 28) K. Kanetani, T. Mikami and K. Ushioda: ISIJ Int. 60 (2020) 1774–1783.
- 29) H. Tanaka: Ph. D. thesis, Kyushu University, (2017) 70.
- 30) H. Harada, T. Mikami, M. Shibata, D. Sokai, A. Yamamoto and H. Tsubakino: ISIJ Int. 45 (2005) 1897–1902.
- 31) M.H. Evans, J.C. Walker, C. Ma, L. Wang and R.J.K. Wood: Mater. Sci. Eng. A 570 (2013) 127–134.
- 32) J.H. Kang, B. Hosseinkhani, C.A. Williams, M.P. Moody, P.A.J. Bagot and P.E.J. Rivera-Díaz-del-Castillo: Scr. Mater. 69 (2013) 630–633.
- 33) V. Šmeļova, A. Schwedt, L. Wang, W. Holweger and J. Mayer: Int. J. Fatigue 100 (2017) 148–158.