Abstract
A drop in compressive stress in the plateau region is one of the issues in compressive behavior of porous metals since it has a negative effect on energy absorption efficiency. The compressive deformation behavior of porous aluminum with irregular unidirectional pores was investigated to clarify the mechanism of the drop. Compression tests of cubic specimens with various irregular circular pore geometries were performed. Digital image correlation and finite element analysis were also conducted to obtain strain and stress distribution of the surface perpendicular to the pores. Fracture of the cell walls was observed when the drop occurred. The results show that pore geometry has an effect on the number and the amount of drop in compressive stress. Measurement of an area of two nearest pores of the fractured cell walls suggests that the amount of drop in compressive stress increases as the area increases. Also, a calculation of normalized critical stress for the plastic collapse of the cell walls shows that the fractured cell walls tend to be geometrically weak. Furthermore, stress concentration occurred around the fractured cell walls, which resulted in a secondary fracture of the cell walls.

1. Introduction
Light energy-absorbing materials are highly demanded, especially in the car industry due to a growing request for lightness and safety. Porous metals are suitable for that purpose since it has good energy absorption capability and lightness.1) The energy absorption characteristic is based on a plateau region, where the compressive stress stays constant while compaction proceeds. Energy absorption efficiency is defined in ISO 13314:20112) to evaluate the characteristics. Since a denominator of the efficiency is a rectangle area in the stress-strain curve, the ideal plateau region has to have no initial peak stress, no drastic drop in stress, which means constant stress with a long strain duration.3) Otherwise, high stress will be transmitted to the target of protection, and energy absorption efficiency will decrease. Plateau stress, plateau end, and some other definitions that characterize porous metals are defined in the ISO standards.2) However, the theoretical background of deformation behavior has yet to be clarified since they are empirically determined.4)
Various studies have been conducted to characterize the compressive behavior of porous metals. In particular, directional porous metals have been widely investigated for a while since there are a variety of possible applications.5–8) It is known that directional porous metals such as lotus-type porous metals have anisotropic compressive behavior. Therefore, deformation modes differ according to the angle between longitudinal direction of pores and compressive direction.9,10) Ichitsubo et al. revealed that Young’s modulus of lotus copper linearly decreases with the increase of porosity in the compression with parallel to the pores, and decreases drastically in the compression with perpendicular to the pores.11) Similarly, Ide et al. found that the yield stress of lotus stainless steel has the same characteristics.9) These results suggest that the specific strength of lotus-type porous metals is constant, while that of many other types of porous metals decreases. However, Hyun et al. concluded that the slope of the stress-strain curve decreases with the increase of porosity and angle between the pores and compressive direction.12) Hence, it is difficult to achieve a flat plateau region with the compression in parallel to the pores. Yoshida et al. applied equal-channel angular extrusion to the porous aluminum alloy with unidirectional pores to resolve that issue.13) As a consequence, energy absorption efficiency was improved by introducing work hardening. Lotus-type porous metals have relatively small porosity, but other porous metals that have relatively thin cell walls have also been investigated. Honeycomb materials are also referred to as cellular materials. Deformation model of transversely crushed honeycombs had been developed.14,15) Ruan et al. revealed that deformation modes vary by impact velocity in in-plane compression of honeycomb metals.16)
Despite all the results above, many types of porous metals including lotus-type porous metals, often have complex and irregular pore geometries which makes it difficult to do modeling of the structure. In situ observation of the pores is also difficult for many porous metals. A particular study focusing on each cell wall is needed to clarify the deformation behavior in detail. Tamai et al. then fabricated a porous specimen with aligned unidirectional pores in order to simplify the deformation behavior and be able to do an in situ observation of the pores.17) They revealed that the plateau region is initiated due to the plastic collapse of the cell walls by constructing a new model of cell walls, which is based on the deformation model of Gibson and Ashby.18) They also observed a sudden drop in compressive stress in the plateau region with some relative thicknesses. This phenomenon is one of the causes of lowering energy absorption efficiency. Therefore, a detailed investigation is needed to clarify the mechanism of the drop. Furthermore, the effect of cell walls on each other must be considered because every cell wall had the same shape in regular pore geometry.
Regular pore geometry is sometimes used since it is suitable for studying deformation behavior in detail. On the other hand, Yue et al. revealed that oscillations of the stress-strain curve occurred by macroscopic shear band deformation in titanium foams with different unit cell geometries.19) Also, Papka et al. reported that there were shear bands in the in-plane compression of honeycomb metals.15) Such shear bands are commonly observed in the porous metals with regular pore geometries and relatively thin cell walls. Energy absorption efficiency will be decreased by the shear bands since stress decreases drastically. Thus, using irregular pore geometry will help to avoid the macroscopic shear band.
The objective of this research was to clarify how the drop in compressive stress occurs in the plateau region. Specimens with unidirectional pores were used for simplification and to do in situ observation. Compression tests were conducted with irregular pore geometries in order to investigate the effects on the drop. A6061 was chosen for the material since it is lightweight and has good formability. Finite element analyses (FEA) were also conducted to investigate multiple pore geometries effectively.
2. Methods
2.1 Experimental method
Table 1 shows the chemical compositions of the A6061 alloy that was used to fabricate the specimens. It was annealed at 415 °C for 2.5 h and then slowly cooled. Electrical discharge machining was used to fabricate cubic specimens with edge length 25 mm, and n = 27 cylindrical pores. Two porous specimens with different pore geometry were prepared. Pores were randomly displaced in the x-z plane from the regular base geometry which is shown in Fig. 1(a). The base geometry had pores of 3 mm in diameter, which were hexagonally aligned with a distance of 4.8 mm between the centers of two pores. Twenty-seven random values were generated for each axis, x and z, to decide the displacement of center of the i-th pore di. Each set of values was generated by specifying a standard deviation of 0.2 mm and 0.4 mm for two specimens, respectively. The values of the standard deviation were selected with consideration of the maximum displacement in order to prevent the overlap of the pores. Moreover, root mean square of displacements of pore centers R was defined to name the specimens. The determination method of R is shown in Fig. 1(c) and eq. (1). The values of R for two specimens were 0.2581 mm and 0.5150 mm, and named R0.2581 and R0.5150, respectively.
| \begin{equation}
R = \sqrt{\frac{1}{n} \sum_{i = 1}^{n}d_{\text{i}}{}^{2}}
\end{equation}
| (1) |

Table 1 Chemical compositions of A6061 alloy that was used in this study. (mass%)
Compression tests were conducted in the perpendicular direction to the pores at the strain rate of 0.1 min−1 in accordance with ISO 13314:2011.2) The surfaces of the upper and lower specimen were lubricated by molybdenum disulfide. Photos of the x-z plane were taken every second. Speckle pattern was added to the x-z plane in order to track the surface and analyze it by digital image correlation (DIC). Distribution of equivalent plastic strain $\overline{\varepsilon ^{\text{p}}}$ on the x-z plane was obtained by using DIC software GOM Correlate (GOM GmbH).
A compression test of a non-porous specimen was also conducted in order to obtain base material properties. The cylindrical specimen had 15 mm in height and 15 mm in diameter. Chemical compositions and the heat treatment were the same for the porous specimens. Apparent Young’s modulus Eapp and the relation between the true stress and the plastic strain were obtained to perform the FEA.
2.2 Analytical method
FEA was done to effectively analyze specimens with different pore geometries using the finite element code Abaqus/Explicit 2018 (Dassault Systèmes S.A.). First, a numerical model was built in order to replicate the experimental result of the specimen with R0.5150. The model had 0.3 mm in thickness in order to reduce the calculation cost. The plane stress state was assumed for the model to allow deformation in the y-axis, which was also confirmed by experimental compression tests of the specimen. Moreover, the compression surfaces of the specimens were lubricated by molybdenum disulfide in the experiments, which also encourages the specimens to uniformly deform in the y-axis. The model was compressed by upper and lower rigid plates. The friction coefficient between specimen and plates was determined as 0.08 in accordance with the research of the effect of molybdenum disulfide on the friction coefficient by Tanaka et al.20) Apparent Young’s modulus Eapp and the relation between true stress and plastic strain were obtained by the compression test of the non-porous specimen. This relation was used to define the piecewise linear plasticity model. Damage initiation criteria for ductile material is described with equivalent plastic strain, stress triaxiality, and equivalent plastic strain rate at that moment. Aluminum is known for its relatively low sensitivity to strain rate;21) thus, we assumed that there is no strain rate sensitivity in damage criteria. Then we adjusted the relationship between equivalent plastic strain and stress triaxiality to match the stress-strain curve of FEA to the experiment. Obtained values are shown in Table 2. Compression was applied until 60% in compressive strain εz unless some elements penetrated the neighboring elements, which resulted in termination. Remeshing was not performed because the pores were barely remaining, and the specimen could be considered as non-porous material at the time of the termination. The time period of compression from 0 to 60% was 0.01 s hence we used explicit solver for simulation of the quasi-static experiment. Our previous research employed an implicit solver for similar compression tests of porous metals with unidirectional pores. However, we found that the solver was able to converge only up to approximately 15% in compressive strain due to extremely large local deformation.17) Therefore, an explicit solver was employed for this study to account also for large deformation, since the focus of this study is the deformation behavior in the plateau region, which exceeds 15% in compressive strain. Using the settings above, we proceeded with the FEA of the other specimen R0.2581 and newly added five different pore geometries. In these five geometries, pores were manually and extensively displaced, but the porosity remained the same as that of R0.5150. Porosity p was calculated based on the designed drawings. It was defined as the area of pores in the x-z plane divided by the area of a square with an edge length of 25 mm, as shown in Fig. 1(b). Table 3 shows R and p of seven pore geometries.
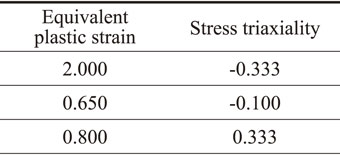
Table 2 Damage initiation criteria.

Table 3 Properties of porous specimens.
3. Results
3.1 Validation of FEA
The experimental result of the compression test of the non-porous specimen is shown in Fig. 2(a). Apparent Young’s modulus Eapp was obtained to be 4.48 GPa as the inclination in the low-stress region. Thus, the relationship between the true stress and the plastic strain was obtained as shown in Fig. 2(b). These results were input to all FE models to define the piecewise linear plasticity.

Stress-strain curves, which were obtained by experiments and FEA, are shown in Fig. 3. The overall behavior of R0.5150 by FEA is in good agreement with that of the experiment, especially in high compressive strain. This can also be confirmed for R0.2581. In the middle of the compression, a notable drop in compressive stress was observed in each curve. The amount of drop can be determined as the difference in compressive stress between when it started to decrease and when it had a relative minimum. Although relative minimum differs by region of interest, we focus on a broad perspective. Thus, the small fluctuations of compressive stress were neglected. We could also confirm that the fracture of the cell walls was occurring at this point. The behavior of fracture in FEA was more brittle than in the experiment; this results in the number and amount of the drop in compressive stress. In FEA it was larger than in the experiment.

Figure 4 shows the x-z plane and equivalent plastic strain distribution from DIC and FEA. Overall appearance and shape of each pore in FEA accurately replicate those of the experiment in a wide range of compressive strain. Furthermore, the distribution of $\overline{\varepsilon ^{\text{p}}}$ from FEA corresponds well to the results from DIC, especially in low compressive strain. DIC could not continue to track the surface at a bigger area at relatively large compressive strain since the local deformation becomes significant and deformation along the y-axis started to take effect. These agreements were confirmed in both results of R0.2581 and R0.5150.
Therefore, the finite element model, which we used reproduces the actual experiments appropriately.
3.2 Various pore geometries
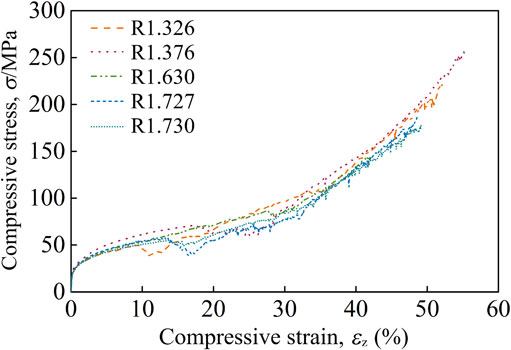
Stress-strain curves of five different pore geometries defined by FEA are shown in Fig. 5. These pore geometries have much higher values of R than that of experimentally compressed geometry. However, the value of R only shows how much the pores were displaced from regular geometry, and it does not mean that the deformation behavior is sensitive to the change of R. Meanwhile, porosity and pore size, which are generally considered to be dominant for mechanical properties, were designed to be same among all geometries.18) Also, Kovačič et al. revealed that the deformation behavior heavily depends on porosity by confirming a very good agreement between the computational results of indirectly reconstructed pore geometry and the experimental results.22) Therefore, the results of those five geometries are also considered as valid along with R0.2581 and R0.5150. The global behavior of the stress-strain curves does not differ substantially between each other. The major difference is the number and amount of drop in σ. The stress-strain curve of R1.326 showed a drop at εz = 9%, which is the smallest strain from all samples. On the other hand, R1.630 experienced it at 28%, which is the largest strain. Moreover, there is also a difference in the change of angle of the curves. The stress-strain curve of R1.376 maintains a relatively small angle of the curve up to 30%, while the stress of R1.630 continues to increase without a considerable drop in compressive stress.
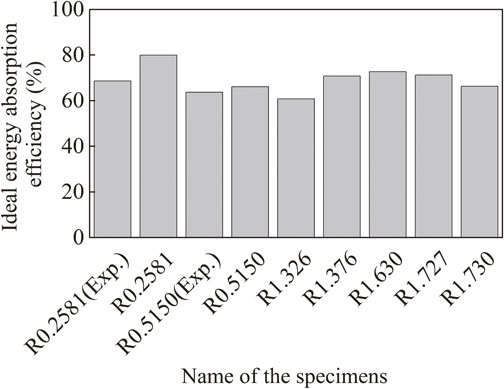
The energy absorption efficiency was calculated from the stress-strain curve of each specimen. ISO 13314:2011 recommends that the upper limit of the compressive strain when calculating the energy absorption efficiency is set to 50% or plateau end strain.2) However, most of the pores in the specimens that we used were already closed at such strain because of the relatively low porosity of the specimens. Ideally, porosity should be 0% as the εz reaches the value of porosity if the cross-sectional area of the specimen does not change during compression. Therefore, we defined ideal energy absorption efficiency, which has the upper limit of εz of the same value as porosity. The detailed calculation process is as follows. The numerator was an integrated area of the stress-strain curve until its strain value was equal to porosity, and the denominator was a product of the strain and compressive stress at the end of integral. Figure 6 shows the ideal energy absorption efficiency of the specimens. R0.2581 (FEA) had the highest efficiency, but it is because of a large drop in compressive stress just before the end of the rectangle, which makes the denominator incorrectly smaller. Thus, the efficiency of R0.2581 is overestimated. For the same reason, the efficiency of R1.630 is also overestimated.
4. Discussion
Good energy-absorbing materials should have a steep slope (high stiffness) at the beginning and a flat plateau region (low stiffness) in the stress-strain curve; therefore, the ideal curve is a boxy shape. From that perspective, R1.376 is showing good result in the stress-strain curve because the stress rises rapidly at the beginning of the compression and then continues with a relatively small drop in stress. Furthermore, R1.376 also has good energy absorption efficiency since R0.2581 and R1.630 are overestimated. Therefore, the R1.376 was chosen as a representative specimen from FEA and the following discussion compares it with experiments.
4.1 Relation between fracture of the cell walls and drop in compressive stress
There is a drop in compressive stress in the result of R0.2581 as shown in Fig. 7(a). The stress had a relative minimum at εz = 15.7% in the experiment. Distribution of $\overline{\varepsilon ^{\text{p}}}$ from DIC at this point is shown on the specimen in Fig. 7(b). Similarly, compressive stress has a relative minimum at εz = 11.1% in the experimental result of R0.5150 (Fig. 8(a)), and Fig. 8(b) shows the distribution of $\overline{\varepsilon ^{\text{p}}}$ from DIC at this point. Also, there is a relative minimum at εz = 25.1% in the computational result of R1.376 (Fig. 9(a)). Figures 7(c), 8(c), and 9(b) show the distribution of $\overline{\varepsilon ^{\text{p}}}$ obtained by FEA at those compressive strain. The results of DIC and FEA have a good agreement in the distribution of $\overline{\varepsilon ^{\text{p}}}$. Strain tends to concentrate at the cell walls that have a relatively large angle to the z-axis in every specimen. Furthermore, fracture of the cell walls can be related to the drop in σ since they were observed mostly during the drops.


Therefore, an area of two nearest pores of the fractured cell walls was measured. If the area is small enough to be considered as non-porous material, σ will not be able to decrease when fractures occur drastically. On the other hand, there has to be a sufficient amount of the area around the fractured cell walls to result in the drop in σ. The results of FEA were used to measure the area because it is difficult to know exactly when the fracture starts/ends from the experimental images. An effective strain duration was defined for each fracture as it starts when an element of the cell wall begins to disappear, and it ends when the cell wall completely fractures into two pieces. Each fracture duration is shown as a bar between two symbols. Furthermore, the area is treated as constant within each duration. The value was chosen as the area when the duration starts. Since the fractures often occur simultaneously in one specimen, the sum of pore areas around the fractured cell walls S was calculated for every strain and shown in Figs. 7(a), 8(a), and 9(a). As the change of S clearly shows, the areas tend to have a peak when σ drops. In contrast, the areas will be relatively small when σ increases. Moreover, σ drops drastically with a sharp peak of the area in R0.2581, but a small drop in σ occurs several times, while the areas maintain without a sharp peak in R1.376. The areas will instantly have a peak if multiple fractures occur simultaneously. These results suggest that the drop in σ will increase if a fracture of the cell walls occurs simultaneously and its nearest pore area is relatively large. Furthermore, energy absorption efficiency will decrease if there is a large amount of drop since the ideal plateau stress is constant. For this reason, the area should also be constant in order to avoid a drop in σ. Therefore, it is suggested that the sequentially occurred fracture of the cell walls will lead to achieving better energy absorption efficiency.
4.2 Evaluation of each cell wall
Tamai et al. calculated critical stress for the plastic collapse of the cell walls σpc by considering their bending moment, shear force, and axial force.17) This approach evaluates the geometric and material strength of the cell walls before compression. Therefore, it can be also applied to evaluate various shapes of the cell walls in this study. First, Voronoi tessellation was applied to the x-z plane of the specimens to determine each cell wall. Then normalized critical stress for the plastic collapse of a cell wall σpc′ was calculated as shown in eq. (2). The critical stress for the plastic collapse was divided by the yield stress of the non-porous material σY in order to evaluate only the geometry of the cell walls. Figure 10 shows the results of tessellation. Length l was measured as the length of the line segment, thickness t was measured as the length of the metallic part on the line between two nearest pore centers, and θ was measured as the angle of the line segment to the horizontal line. Position x′ was considered as l/2 for simplification.
| \begin{align}
&\sigma_{\text{pc}}{}' = \frac{\sigma_{\text{pc}}}{\sigma_{\text{Y}}} = \frac{t}{l}\left[\left\{2\cos^{2}\theta \cdot \frac{x' - l/2}{t} + \sqrt{4\cos^{4}\theta \cdot \frac{(x' - l/2)^{2}}{t^{2}} + \sin^{2}\theta \cos^{2}\theta} \right\}^{2} {}+ \frac{27}{4}\cos^{4}\theta \right]^{-\frac{1}{2}}
\end{align}
| (2) |

σpc′ was calculated for every cell wall in R0.2581, R0.5150, and R1.376. The values were sorted in ascending order as shown in Fig. 11(a). Each plot in Fig. 11(b) represents σpc′ of each cell wall. Vertical axis shows the rank of σpc′ out of 62 cell walls in the same geometry. The σpc′ values in over 40 cell walls were under 1 in each geometry, whereas some of them had significantly large values close to 100. Fractured cell walls are also shown in Fig. 11 as outline symbols. Most of them had relatively low σpc′, hence the fracture initiation location of the cell walls is considered to depend on the initial geometry of the pores. At the same time, a few of them had slightly larger σpc′ than others, which is shown in three individual plots. This suggests that there are also other influencing parameters, e.g. properties of neighboring cell walls. Additionally, the prediction of fracture location will be possible by calculating and defining the cell walls with relatively low σpc′ even before performing experimental tests or computational simulations.
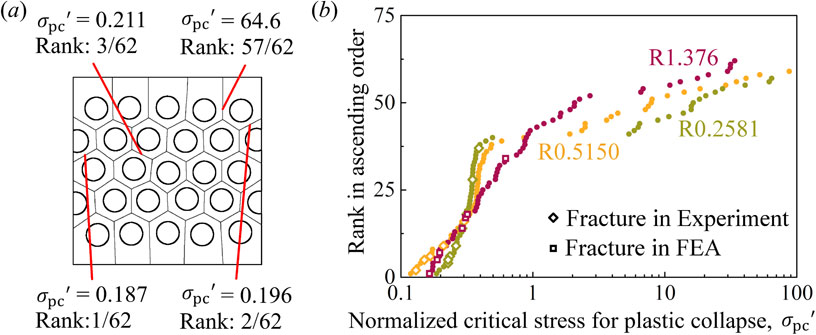
Figure 12 shows the distribution of von Mises stress, when σ has a relative minimum in the results of FEA, which is εz = 16.8% for R0.2581, εz = 13.6% for R0.5150, and εz = 25.1% for R1.376. These results show that stress concentrates at nearby cell walls of the fractured and locally deformed cell walls. As a consequence, fracture of the cell walls occurs sequentially because surrounding cell walls will experience high stress when one cell wall fractures. Basically, concentration is considered to occur at horizontally neighboring cell walls since the displacement of the upper and bottom edge of the specimen is fixed. However, it is not necessarily because the strength of its surrounding cell walls will also take effect. We believe this is one of the reasons that not all fractured cell walls have small σpc′. Other possible reasons are the effect of the cell walls on each other, and the effect that geometry continuously changes as the compression proceeds. Tamai et al. revealed that pores deform sequentially row by row from central row to upper and lower rows in aligned unidirectional porous metal.17) However, the specimens in this research do not deform as that of an aligned one. First, deformation occurs at the cell wall, which has relatively small σpc′, then it spreads to its surrounding. This is a major difference between aligned and irregular unidirectional porous metals.

5. Conclusion
The drop in compressive stress during the plateau region was investigated in porous metals with irregular unidirectional pores. The following conclusions were obtained by compression tests and finite element analysis.
-
(1)
Fractured cell walls had relatively low normalized critical stress for the plastic collapse of a cell wall σpc′, hence where the fracture of the cell walls occurs depends on the initial pore geometries. They are considered to be predictable at some level by calculating σpc′.
-
(2)
Fracture of the cell walls often occurs sequentially because fracture causes stress concentration at surrounding cell walls. These series of local deformation do not occur layer by layer, unlike regularly aligned unidirectional porous metals do.
-
(3)
The drop in compressive stress was related in detail with the fractures of the cell walls by numerical and experimental analysis. The amount of drop in compressive stress will be large if the fracture of multiple cell walls occurs simultaneously and their two nearest pore areas are relatively large.
Acknowledgments
The material that we used in this study was provided by UACJ Corporation. This study was supported by a grand-in-aid from The Light Metal Educational Foundation, Inc. and Overseas Research Travel Grant Program for Master’s/Doctoral Course Students, Waseda University. The authors acknowledge the financial support of the Research Core Funding (No. P2-0063) from the Slovenian Research Agency.
REFERENCES
- 1) J. Banhart: Prog. Mater. Sci. 46 (2001) 559–632.
- 2) International Organization for Standardization: ISO13314:2011, (2011).
- 3) M.F. Ashby, A.G. Evans, N.A. Fleck, L.J. Gibson, J.W. Hutchinson and H.N.G. Wadley: Metal Foams: A Design Guide, (Butterworth-Heinemann, Oxford, 2000).
- 4) S. Suzuki, M. Kobashi, F. Ono and N. Kanetake: Proc. The 9th Pacific Rim International Conference on Advanced Materials and Processing, (The Japan Institute of Metals and Materials, 2016) pp. 268–271.
- 5) H. Nakajima: Prog. Mater. Sci. 52 (2007) 1091–1173.
- 6) H. Nakajima: Mater. Trans. 60 (2019) 2481–2489.
- 7) K. Hokamoto, M. Vesenjak and Z. Ren: Mater. Lett. 137 (2014) 323–327.
- 8) K. Hokamoto, K. Shimomiya, M. Nishi, L. Krstulović-Opara, M. Vesenjak and Z. Ren: J. Mater. Process. Technol. 251 (2018) 262–266.
- 9) T. Ide, M. Tane, T. Ikeda, S.-K. Hyun and H. Nakajima: J. Mater. Res. 21 (2006) 185–193.
- 10) M. Vesenjak, K. Hokamoto, M. Sakamoto, T. Nishi, L. Krstulović-Opara and Z. Ren: Mater. Des. 90 (2016) 867–880.
- 11) T. Ichitsubo, M. Tane, H. Ogi, M. Hirao, T. Ikeda and H. Nakajima: Acta Mater. 50 (2002) 4105–4115.
- 12) S.-K. Hyun and H. Nakajima: Mater. Sci. Eng. A 340 (2003) 258–264.
- 13) T. Yoshida, D. Muto, T. Tamai and S. Suzuki: Metall. Mater. Trans. A 49 (2018) 2463–2470.
- 14) J.W. Klintworth and W.J. Stronge: Int. J. Mech. Sci. 30 (1988) 273–292.
- 15) S.D. Papka and S. Kyriakides: J. Mech. Phys. Solids 42 (1994) 1499–1532.
- 16) D. Ruan, G. Lu, B. Wang and T.X. Yu: Int. J. Impact Eng. 28 (2003) 161–182.
- 17) T. Tamai, D. Muto, T. Yoshida, M. Sawada, S. Suzuki, M. Vesenjak and Z. Ren: Metall. Mater. Trans. A 50 (2019) 2189–2200.
- 18) L.J. Gibson and M.F. Ashby: Cellular Solids: Structure and Properties, 2nd ed., (Cambridge University Press, Cambridge, 1997).
- 19) X.-Z. Yue, K. Matsuo and K. Kitazono: Mater. Trans. 58 (2017) 1587–1592.
- 20) E. Tanaka, S. Semoto and Y. Suzuki: J. Japan Inst. Met. Mater. 28 (1964) 228–236.
- 21) J.D. Campbell: Mater. Sci. Eng. 12 (1973) 3–21.
- 22) A. Kovačič, M. Borovinšek, M. Vesenjak and Z. Ren: Materials 11 (2018) 193.
Appendices
Appendix
List of symbols:
-
Displacement of center of the i-th pore, di/mm
-
Apparent Young’s modulus, Eapp/GPa
-
Plastic strain, εp
-
True strain, εt
-
Compressive strain, εz (%)
-
Equivalent plastic strain, $\overline{\varepsilon ^{\text{p}}}$
-
Length of a cell wall, l/mm
-
Porosity, p (%)
-
Angle of a cell wall, θ (deg)
-
Root mean square of displacements of pore centers, R/mm
-
Sum of pore areas around the fractured cell walls, S/mm2
-
Compressive stress, σ/MPa
-
Critical stress for plastic collapse, σpc/MPa
-
Normalized critical stress for plastic collapse, σpc′
-
True stress, σt/MPa
-
Yield stress of non-porous material, σY/MPa
-
Thickness of a cell wall, t/mm
-
Position in cell wall, x′/mm

