Abstract
3104 aluminum alloy hard sheets are widely used for aluminum beverage can body stock (CBS) mainly because of their high ironing formability. The CBS has large anisotropy of r-value (Lankford value) and n-value (work hardening exponent), however, the effect of such anisotropy on the ironing formability remains unclear. In this study, cup and DI forming behavior was investigated using cold-rolled 3104 aluminum alloy hard sheets with different anisotropy of r and n-values. Magnitude of the anisotropy changes during drawing and ironing. Ironing fracture tests reveal that fracture occurs at angles between 10 and 20° in the can circumferential direction. From the strain distribution measurement of the can wall, it is found that the axial strain of the can wall at the fracture angle is larger. A theoretical analysis method of ironing stress introducing r and n-value anisotropy is devised based on the Hill’s anisotropic plasticity theory (quadratic yield function). The devised analysis reveals that as the anisotropy of r-value in the can wall becomes smaller, (1) the fracture is less likely occur, (2) the margin of stress which calculated from the ratio of the can axial tensile stress to fracture stress is larger.
This Paper was Originally Published in Japanese in J. JILM 70 (2020) 422–428. Synopsis and keywords were slightly modified. Titles of Table 2 and Table 3 were slightly modified. Annotation in Table 1 was added. Annotation in Fig. 3 and Fig. 4 were slightly modified. Table 3, Fig. 3, Fig. 5, Fig. 11, Fig. 12 and Fig. 13 were slightly modified.
1. Introduction
AA3104 (or 3004) aluminum alloy hard sheets are widely used for aluminum beverage can body stock (CBS). Can body is made of cold-rolled aluminum coils, and the manufacturing process is called “DI process”, consisting of drawing, re-drawing, and three ironing processes (1st, 2nd and 3rd). The thinnest part of the can wall after 3rd ironing is about 0.1 mm. The ironing ratio of the original material is extraordinarily large, thus it is important to ensure the ironing formability (prevention of fracture during ironing) for the stable production of the can body. In the previous study on the ironing formability of aluminum alloy sheets, Usui et al.1) evaluated the limit ironing ratio of AA1100, 3004, 5052 alloys at various tempers (H18, H24, O). They clarified that the 3004 hard sheets (3004-H18 sheets) have the highest limit ironing ratio.
It is known that such 3104, 3004 alloy hard sheets have large in-plane anisotropy of both r-value (Lankford value) and n-value (work hardening exponent). Regarding the effect of such plastic anisotropy on the can body forming, for example, Tsuchida et al.2) investigated the effect of r-value on the wall thickness distribution of a drawn cup. They revealed that the r-value obtained by a tensile test in a certain direction with an angle to the rolling direction affects the cup wall thickness of the part with an angle of 90° rotation to the tensile test direction. Abe et al.3) reported numerical calculation results of ironing with taking account of r and n-values (both in-plane isotropic). They concluded that larger r-value and smaller n-value result in the greater limit ironing ratio. Usui et al.1) also reported that smaller n-value of 3004 alloy hard sheets results in the superior formability in multi-step ironing. However, in-plane anisotropy of both r and n-values are not considered in the previous studies. The influence of such plastic anisotropy on the ironing formability also remains unclear, even though it is an important property for the CBS. In this study, we investigate the effect of plastic anisotropy on ironing formability by examining can wall strength and strain introduced by drawing, re-drawing and ironing, using 3104 aluminum alloy hard sheets with in-plane anisotropy of r and n-values.
2. Experimental Procedure
Three kinds of cold-rolled 3104 aluminum alloy hard sheets with a thickness of 0.3 mm were used. Table 1 shows chemical compositions of alloys and applied processes. After industrial DC casting, homogenization heat treatment and hot rolling, three different processes were applied to change anisotropy of r and n-values as shown in Table 1. The obtained cold-rolled sheets were 0.3 mm in thickness. Then, ϕ10 mm scribed circles were printed on these sheets by electrolytic etching. Subsequently, the drawing, re-drawing and ironing were applied to the sheets to prepare each processed sample. The schematic of re-drawing and ironing are shown in Fig. 1. Drawing, re-drawing and ironing conditions are shown in Table 2 and Table 3, respectively.

Table 1 Chemical compositions of 3104 alloys and applied processes.

Table 2 Drawing conditions.

Table 3 Re-drawing and ironing conditions.
Strain distribution of the processed samples was measured as follows. For the drawn cup and re-drawn can, the axial strain was calculated based on the change in the scribed circle diameter before and after forming. In addition, the thickness strain was calculated by measuring the wall thickness. Then, the can circumferential strain was calculated based on the assumption of constant volume. For the 2nd and 3rd ironed cans, the thickness strain was calculated by measuring the wall thickness. The can axial strain was calculated based on the assumption of plane strain deformation (i.e. can circumferential strain equals 0) and constant volume. JIS No. 5 specimens were prepared from the cold-rolled sheets. JIS No. 13B specimens were prepared from the wall of 2nd and 3rd ironed can, and the gauge lengths were set at 20 mm and 25 mm depending on the can wall height. The specimens of the cold-rolled sheets were tested in the longitudinal direction from 0° to 90° with respect to the rolling direction at 22.5° intervals. Longitudinal directions of the specimens of the 2nd ironed can were the can axial and circumferential directions. The direction of the specimens of the 3rd ironed can was the can axial direction. As shown in Fig. 2, the center between gauge marks of the specimen was the can circumferential direction angles α = 0° to 90° (22.5° interval, rolling direction is 0°). Tensile test speed was fixed at 5 mm/min of the cross head displacement. Furthermore, ironing fracture tests were performed changing the 2nd ironing die diameter with the constant 3rd ironing die diameter, that is, changing the 3rd ironing ratio. Forming conditions are shown in Table 3.

3. Experimental Results
3.1 Mechanical properties, r and n-value distributions
Figure 3 shows in-plane distributions of proof stress σ0.2α, r-value rα, and n-value $n_{\alpha }^{sheet}$ (α: angle to the rolling direction) of the cold-rolled sheets. Here, r-values were calculated at nominal strain of 0.01 to 0.03, and n-values were calculated using the Hollomon’s law at nominal strain of 0.01 to 0.03.
| \begin{equation}
\sigma_{\alpha} = F_{\alpha} \cdot \varepsilon_{\alpha}{}^{n_{\alpha}^{\text{sheet}}}
\end{equation}
| (1) |
In
eq. (1), σ
α,
Fα and ε
α are true stress, coefficient and true strain, respectively.
Figure 3 shows that the cold-rolled sheets have in-plane anisotropy in r and n-values. The magnitude of the anisotropy is different among specimens. Figure 4 shows the axial and circumferential r-value distributions of the 2nd ironed can (the horizontal axis is plotted as the can circumferential direction angle of the can). The r-values of the can wall were calculated at nominal strain of 0.008 to 0.015. Comparing the r-values in the can axial direction with those of the cold-rolled sheets shown in Fig. 3, the r-value distribution is found to be changed. The r-values in the can circumferential direction showed different distribution from those in the can axial direction. The values at circumferential angle α = 22.5° were maximum for all the specimens.

The n-values $n_{\alpha }^{\text{can}}$ in the high strain regions from the cold-rolled sheet to the can wall are calculated as follows. Uniaxial proof stresses σ0.2α of the cold-rolled sheets, can axial directions of the 2nd and 3rd ironed cans were defined as the equivalent stress σeqα (α: angle to the rolling direction or can circumferential direction. In the latter case the can wall in the rolling direction was 0°). The equivalent plastic strain εeqα was defined by the following equation based on the Hill’s anisotropic plastic theory (quadratic yield function4)).
Drawn Cup and re-drawn can (Tri-axial strain)
| \begin{equation}
\left.
\begin{array}{c}
\varepsilon_{\text{eq${\alpha}$}}^{\text{draw}} = \sqrt{\dfrac{2}{3}} \cdot \dfrac{X_{1}}{X_{2}} \cdot \sqrt{X_{3} + X_{4} + X_{5}}\\
X_{1} = \sqrt{\dfrac{r_{\alpha} + r_{\alpha + 90} + r_{\alpha}r_{\alpha + 90}}{r_{\alpha}}}\\
X_{2} = \dfrac{r_{\alpha + 90}}{r_{\alpha}}(1 + r_{\alpha} + r_{\alpha + 90})\\
X_{3} = r_{\alpha + 90}\left(\varepsilon_{l\alpha}-\dfrac{r_{\alpha + 90}}{r_{\alpha}}\varepsilon_{\theta\alpha}\right)^{2}\\
X_{4} = \left(\dfrac{r_{\alpha + 90}}{r_{\alpha}}\right)^{2}(\varepsilon_{\theta\alpha} - r_{\alpha}\varepsilon_{t\alpha})^{2}\\
X_{5} = \dfrac{r_{\alpha + 90}}{r_{\alpha}}(r_{\alpha + 90}\varepsilon_{t\alpha} - \varepsilon_{l\alpha})^{2}
\end{array}
\right\}
\end{equation}
| (2) |
2nd and 3rd ironed can (Plane strain)
| \begin{equation}
\left.
\begin{array}{l}
\varepsilon_{\text{eq${\alpha}$}}^{\text{iron}} = \sqrt{\dfrac{2}{3} \cdot \dfrac{(1 + r_{l\alpha})(r_{l\alpha} + r_{\theta\alpha} + r_{l\alpha}r_{\theta\alpha})}{r_{\theta\alpha}(1 + r_{l\alpha} + r_{\theta\alpha})}}\cdot\varepsilon_{l\alpha}\\
\quad = R'_{\alpha} \cdot \ln \left(\dfrac{t_{i}}{t_{o}}\right)\\
R'_{\alpha} = \sqrt{\dfrac{2}{3} \cdot \dfrac{(1 + r_{l\alpha})(r_{l\alpha} + r_{\theta\alpha} + r_{l\alpha}r_{\theta\alpha})}{r_{\theta\alpha}(1 + r_{l\alpha} + r_{\theta\alpha})}}
\end{array}
\right\}
\end{equation}
| (3) |
| \begin{equation}
\varepsilon_{\text{eq${\alpha}$}} = \varepsilon_{\text{eq${\alpha}$}}^{\text{draw}} + \varepsilon_{\text{eq${\alpha}$}}^{\text{iron}}
\end{equation}
| (4) |
Where, ε
lα: can axial strain at the can circumferential angle α,
-
εθα: can circumferential strain,
-
εtα: can wall thickness strain,
-
rlα: r-value obtained by the can axial tensile test,
-
rθα: r-value obtained by the can circumferential tensile test,
-
ti, to: wall thickness before and after forming in each process.
Note that ε
eqα corresponding to σ
eqα (proof stress) of the can wall of the 2nd and 3rd ironed cans was calculated from the strain values at the sampling positions of the can axial tensile test (2nd ironed can: 35 mm height, 3rd ironed can: 60 mm height). To give an example in the 3rd ironed can, scribed circle was used to identify the position at post-drawing, re-drawing and ironing corresponding to the height of 60 mm at the 3rd ironed can. Then, the strains introduced by each process were calculated. The strain values differ in the can circumferential direction due to the influence of the anisotropy (see
Fig. 9 below), and the values of ε
eqα corresponding to σ
eqα of the 2nd and 3rd ironed cans were in the ranges of 0.62 to 0.88 and 1.20 to 1.62, respectively.
The values of $n_{\alpha }^{\text{can}}$ were calculated by approximating the relation between σeqα and equivalent plastic strain εeqα at three points of the cold-rolled sheet, 2nd and 3rd ironed can wall, by the following eq. (5).
| \begin{equation}
\sigma_{\text{eq${\alpha}$}} = F_{\text{eq${\alpha}$}} \cdot \varepsilon_{\text{eq${\alpha}$}}{}^{n_{\alpha}^{\text{can}}}
\end{equation}
| (5) |
Where,
Feqα is coefficient.
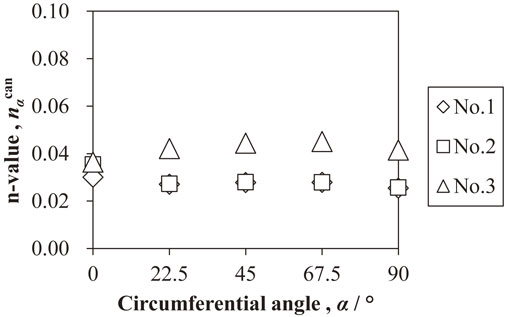
Figure 5 shows the distribution of
$n_{\alpha }^{\text{can}}$.
Figure 5 shows that the n-values are smaller than those of the cold-rolled sheet (see
Fig. 3) in the case of the high strain region from the cold-rolled sheet to the 3rd ironed can wall. The differences between maximum and minimum values of r and n-values in
Fig. 3,
Fig. 4 and
Fig. 5 are defined as r
max.-min. and n
max.-min., respectively.
Table 4 shows the summarized results.
Table 4 shows that the tendency of r
max.-min. and n
max.-min. for each material differs between the cold-rolled sheet and can wall. The anisotropy of the r and n-values is found to be changed by drawing and ironing. These results show that when considering multiple forming processes, it is necessary to consider the r and n-values in each process accordingly. The specimen No. 3 has the smallest r
max.-min. in the can wall, while the specimen No. 1 has the smallest n
max.-min..

Table 4 Anisotropy of r and n-values.
Figure 6 shows the distributions of proof stress in the can axial direction of the 2nd and 3rd ironed cans. The proof stress of the 2nd ironed can increased from α = 90° to 0° for all materials. The proof stress of the 3rd ironed can is maximum at α = 90° and minimum at 22.5° in the specimens No. 1 and 2, while maximum at α = 0° and minimum at 45° in the specimen No. 3. The difference in the proof stress distribution between the cold-rolled sheet (see Fig. 3) and 3rd ironed can is attributed to the anisotropy of the n-value. In the 3rd ironed can, the difference in the values between tensile strength and proof stress was as small as about 10 MPa regardless of the material and can circumferential angle, thus, the proof stress was regarded as fracture stress in this study. Therefore, the anisotropy of the proof stress mentioned above (equivalent stress in this study) can be regarded as the anisotropy of the fracture stress.
3.2 Ironing fracture test
Ironing was performed changing the 3rd ironing ratio and it was examined whether fracture occurred during the forming. Table 5 shows the results of the ironing fracture test. Figure 7 shows the fracture sample. In all specimens, the fracture occurred at the height of about 22 mm (just below the thinnest wall part) in the 3rd ironed can as shown in Fig. 7. The wall thickness in the can circumferential direction (22.5° interval) was measured on the can upper side of the sample separated by the fracture. The maximum wall thickness difference in the can circumferential direction was calculated. And plotted as a function of the ironing fracture angle in Fig. 8. It is found that the fracture occurred near α = 10 to 20°, except the cans with a large circumferential wall thickness difference (0.005 mm or more in Fig. 8), which are assumed to be fractured due to forming factors. It is also found that No. 3 is least likely to fracture in the vicinity of α = 10 to 20° and is excellent in the ironing formability. As described above, the material No. 3, with the excellent ironing formability, has the smallest r-value anisotropy of the can wall (see Table 4).

Table 5 Results of ironing fracture test.
Figure 9 shows the axial strain distribution of the re-drawn can, 2nd ironed can and 3rd ironed can at the positions corresponding to the height of 22 mm of the 3rd ironed can, where fracture occurred. Note that the strain values in Fig. 9 are total strain introduced in the subsequent forming process after cold-rolled sheet. As the forming proceeded, the strain anisotropy became remarkable. In the 3rd ironed can, the strain increased in all materials as the can circumferential angle α approaches 0° from 90°, and the maximum value was obtained at α = 0° or 22.5°. The distribution is similar to the r-value distribution in the can circumferential direction shown in Fig. 4. The anisotropy of the r-value seems to affect the strain distribution. Considering the results in Fig. 8, the strain in the can axial direction is larger at the angle where fracture occurs easily (α = 22.5° in Fig. 9).
4. Theoretical Analysis
Based on the above results, a theoretical analysis of the ironing was carried out to quantitatively evaluate the resistance to fracture. The equation considering anisotropy was derived by introducing the term of r-value to the equation used in the previous studies with the assumption of isotropy by Fukui5) and Okamoto et al.6)
4.1 Equivalent stress
From the Hill’s anisotropic plastic theory (quadratic yield function4)), the equivalent stress σeqα was defined as follows.
| \begin{equation}
\left.
\begin{array}{l}
\sigma_{\text{eq${\alpha}$}} = \sqrt{\dfrac{3}{2} \cdot \dfrac{X_{6} + X_{7} + X_{8}}{r_{l\alpha} + r_{\theta\alpha} + r_{l\alpha}r_{\theta\alpha}}}\\
X_{6} = r_{l\alpha}r_{\theta\alpha}(\sigma_{l\alpha} - \sigma_{\theta\alpha})^{2}\\
X_{7} = r_{l\alpha}(\sigma_{\theta\alpha} - \sigma_{t\alpha})^{2}\\
X_{8} = r_{\theta\alpha}(\sigma_{t\alpha} - \sigma_{l\alpha})^{2}
\end{array}
\right\}
\end{equation}
| (6) |
Where, σ
lα, σ
θα, and σ
tα are the stress in the can axial direction, circumferential direction and thickness direction, respectively, during ironing on the can wall at the circumferential direction angle α. In
eq. (6), the effect of shear stress is ignored.
Since ironing can be assumed to be proportional deformation, the equation was derived below by applying the total strain theory. The relation between true stress and plastic strain is as follows when eq. (6) is regarded as plastic potential.4)
| \begin{equation}
\begin{split}
& \frac{r_{l\alpha} \cdot \varepsilon_{l\alpha}}{r_{l\alpha}r_{\theta \alpha}(\sigma_{l\alpha} - \sigma_{\theta\alpha}) + r_{\theta\alpha}(\sigma_{l\alpha} - \sigma_{t\alpha})}\\
&\quad = \frac{\varepsilon_{\theta\alpha}}{r_{\theta\alpha}(\sigma_{\theta\alpha} - \sigma_{l\alpha}) + (\sigma_{\theta\alpha} - \sigma_{t\alpha})}\\
&\quad = \frac{r_{l\alpha} \cdot \varepsilon_{t\alpha}}{r_{\theta\alpha}(\sigma_{t\alpha} - \sigma_{l\alpha}) + r_{l\alpha}(\sigma_{t\alpha} - \sigma_{\theta\alpha})}
\end{split}
\end{equation}
| (7) |
Assuming the ironing is plane strain deformation (εθα = 0), the following equations are obtained under the assumption of a constant volume and eq. (7).
| \begin{equation}
\sigma_{\theta\alpha} = \frac{r_{\theta\alpha} \cdot \sigma_{l\alpha} + \sigma _{t\alpha}}{1 + r_{\theta\alpha}}
\end{equation}
| (8) |
| \begin{equation}
\sigma_{l\alpha} - \sigma_{\theta\alpha} = \frac{\sigma_{l\alpha} - \sigma_{t\alpha}}{1 + r_{\theta\alpha}}
\end{equation}
| (9) |
| \begin{equation}
\sigma_{\theta\alpha} - \sigma_{t\alpha} = \frac{r_{\theta\alpha}(\sigma_{l\alpha} - \sigma_{t\alpha})}{1 + r_{\theta\alpha}}
\end{equation}
| (10) |
From
eqs. (6) to
(10), the equivalent stress σ
eqα on the can wall during ironing is as follows.
| \begin{align}
\sigma_{\text{eq${\alpha}$}} &= \sqrt{\frac{3}{2} \cdot \frac{r_{\theta\alpha}(1 + r_{l\alpha} + r_{l\alpha}r_{\theta\alpha})}{(1 + r_{\theta\alpha})(r_{l\alpha} + r_{\theta\alpha} + r_{l\alpha}r_{\theta\alpha})}} \cdot (\sigma_{l\alpha} - \sigma_{t\alpha})\\
& = R''_{\alpha} \cdot (\sigma_{l\alpha} - \sigma_{t\alpha}) = F_{\text{eq${\alpha}$}} \cdot \varepsilon_{\text{eq${\alpha}$}}{}^{n_{\alpha}^{\text{can}}}
\end{align}
| (11) |
The last equality in
eq. (11) is on the assumption of
eq. (5). From
eqs. (11),
(3) and
(4), the following equation is obtained.
| \begin{align}
\sigma_{t\alpha} & = \sigma_{l\alpha} - \frac{F_{\text{eq${\alpha}$}}}{R''_{\alpha}} \cdot \varepsilon_{\text{eq${\alpha}$}}{}^{n_{\alpha}^{\text{can}}}\\
& = \sigma_{l\alpha} - \frac{F_{\text{eq${\alpha}$}}}{R''_{\alpha}} \cdot \left\{\varepsilon_{\text{eq${\alpha}$}}^{\text{draw}} + R'_{\alpha} \cdot \ln\left(\frac{t_{i}}{t_{o}}\right)\right\}^{n_{\alpha}^{\text{can}}}
\end{align}
| (12) |
Based on the method by Fukui,5) Okamoto et al.,6) the can axial tensile stress σlα during the 3rd ironing was calculated. Figure 10 shows the stress state in the ironing cross section. The conditions for the equilibrium forces to the l direction (the ironing direction) in the minute area (the dl part) is as follows.
| \begin{equation}
td\sigma_{l\alpha} - \sigma_{l\alpha}dt - (\mu_{d} - \mu_{p})\sigma_{t\alpha}dl - \sigma_{t\alpha}Adl = 0
\end{equation}
| (13) |
Where,
t: can wall thickness at an arbitrary cross section during ironing,
-
μd: coefficient of friction between the die and material,
-
μp: coefficient of friction between the punch and material,
-
A: die entrance semi-angle.
The approximations of sin
A ≒
A and cos
A ≒ 1 was used to derive
eq. (13). By setting
dl = −(
dt/
A), substituting
eq. (12) into
eq. (13) and dividing the whole by
tdt, the following
eq. (14) is obtained.
| \begin{align}
\frac{d\sigma_{l\alpha}}{dt} & = \frac{1}{t} \cdot \biggl[\frac{\mu_{p} - \mu_{d}}{A} \cdot \sigma_{l\alpha} + \left(1 - \frac{\mu_{p} - \mu_{d}}{A}\right) \cdot \frac{F_{\text{eq${\alpha}$}}}{R''_{\alpha}}\\
&\quad \cdot \left\{\varepsilon_{\text{eq${\alpha}$}}^{\text{draw}} + R'_{\alpha} \cdot \ln\left(\frac{t_{i}}{t_{o}}\right)\right\}^{n_{\alpha}^{\text{can}}}\biggr]
\end{align}
| (14) |
Where,
ti and
to are wall thickness before the 3rd ironing (the 2nd ironed can) and after the 3rd ironing, respectively.
Equation (14) is the differential equation related to the can axial tensile stress during ironing. In addition to terms of the can wall thickness, friction coefficient, die entrance semi-angle, work hardening exponent in the conventional equations,
5,6) the r-value term was newly introduced.
Substituting the characteristic values of the 2nd ironed can and μd = 0.30, μp = 0.10, A = 8° into eq. (14), σlα was calculated using the fourth-order Runge-Kutta method. The calculation was performed in each of 5 directions at 22.5° intervals from α = 0° to 90°. In addition to the above calculation, the value of Δεlα was defined as contribution of stress anisotropy to the can axial strain based on the method by Yoon et al.7)
| \begin{equation}
\Delta\varepsilon_{l\alpha} = \beta \cdot \ln\left(\frac{\sigma_{\text{ref}}}{\sigma_{l\alpha}}\right)
\end{equation}
| (15) |
| \begin{equation}
\sigma_{\text{ref}} = \frac{1}{8}\{\sigma_{l0} + 2(\sigma_{l22.5} + \sigma_{l45} + \sigma_{l67.5}) + \sigma_{l90}\}
\end{equation}
| (16) |
From
eqs. (15) and
(16), Δε
lα increases as the value of σ
lα decreases with respect to the reference stress σ
ref, which is average of stress at every 22.5°. β in
eq. (15) is a coefficient, and β = 0.5 was used in the analysis of drawing process by Yoon
et al.7) Since the can wall is always constrained by the punch and die during the ironing in this study, the contribution of the stress anisotropy to the can axial strain is considered to be not as great as that in the drawing process. Then, β was set to 0.1 in this study. The solution of the differential
eq. (14), σ
lα, with added stress increment corresponding to Δε
lα, was used as the final solution of the can axial tensile stress.
As an example, Fig. 11 shows the calculation results of σlα for the sample No. 1. Figure 11 also shows the value of the can wall fracture strength σplaneα. Assuming the plane strain state, σplaneα was calculated from proof stress in uniaxial tension, that is, equivalent stress σeqα (which is regarded as the fracture strength in this study, as described above) and r-value of the 2nd ironed can. Here, the method by Kuwabara et al.8) is referred.
| \begin{equation}
\left.
\begin{array}{l}
\sigma_{\text{plane${\alpha}$}} = \sqrt{\dfrac{r_{\theta\alpha} + r_{l\alpha}B^{2} + r_{l\alpha}r_{\theta\alpha}(1 - B)^{2}}{r_{l\alpha}(1 + r_{l\alpha})}}\cdot \sigma_{eq\alpha}\\
\qquad B = \dfrac{r_{\theta\alpha}}{1 + r_{\theta\alpha}}
\end{array}
\right\}
\end{equation}
| (17) |
White circles in
Fig. 11 are “true ironing ratio” corresponding to the height of 22 mm in the 3rd ironed can, where fracture occurred under the processed sample preparation conditions.
Figure 11 shows that σ
lα increases as the ironing ratio increases, and that the true ironing ratio and stress state are different for each angle.
In Fig. 11, assuming that the fracture occurs when σlα exceeds σplaneα, “margin of stress” was defined, when σlα is lower than σplaneα, as the ratio of the difference between the two stresses to σplaneα.
| \begin{equation}
\text{Margin of stress} = \left(1 - \frac{\sigma_{l\alpha}}{\sigma_{\text{plane${\alpha}$}}}\right)\times 100\ [\%]
\end{equation}
| (18) |
shows the margin of stress during the 3rd ironing under the processed sample preparation conditions. The margin of stress at the “true ironing ratio” (see white circles in
Fig. 11) at the height of 22 mm of the 3rd ironed can is plotted in
Fig. 12 and
Fig. 13, which will be described later. The margin of stress becomes the smallest at α = 22.5° for the specimens No. 1 and 2, and at α = 45° for No. 3, respectively. From these results, it can be understood that fracture tends to occur around α = 22.5°. The tendency generally corresponds to the result of the ironing fracture test described above, that is, the fracture easily occurs around α = 10 to 20°. In addition, the margin of stress at α = 22.5° is large in order of No. 3, 1, and 2 and this also corresponds to the fracture test results mentioned above. In summary, the smaller the r-value anisotropy of the can wall is, the smaller the anisotropy of the margin of stress and the larger the absolute value at α = 0 to 22.5° is.

As a reference, the calculation results using the formula in the previous studies by Fukui5) and Okamoto et al.,6) which do not consider r-value, that is, calculation assuming rlα = rθα = 1, are shown in Fig. 13. Figure 13 shows that there is almost no difference in the margin of stress either by the angles or by the materials. From the above results, the influence of the r-value is particularly large on the anisotropy of the margin of stress, that is, the anisotropy of the resistance to fracture. It is considered that the fracture limit at α = 22.5° will increase when the anisotropy of the r-value is decreased.
The effect of the plastic anisotropy on the ironing formability of the 3104 aluminum alloy hard sheets can be summarized as follows. The strain in the can axial direction at angles of 0 to 22.5° increases due to the anisotropy of r-value, and the fracture strength near 22.5° is minimized due to the anisotropy of n-value and proof stress. These mechanisms explain the tendency to fracture at around 22.5° during ironing. Finally, it should be noted the test specimens used in this study were prepared for the comparative evaluation under different conditions of proof stress, r and n-values. The quantitative influence of absolute values and anisotropy of these parameters alone on ironing formability remains unclear, thus we will further examine details.
5. Conclusions
We investigate the effect of plastic anisotropy on the ironing formability using 3104 aluminum alloy hard sheets, which are widely used for aluminum beverage can body stock. The conclusions are summarized below.
-
(1)
Magnitude of the anisotropy of r and n-values changes by drawing and ironing process.
-
(2)
Fracture during ironing occurs at the specific can circumferential angle (10 to 20°, where the can wall in the rolling direction is 0°).
-
(3)
The specimen with smaller r-value anisotropy in the can circumferential direction of the can wall shows less fracture during ironing.
-
(4)
A theoretical analysis of ironing where r and n-value anisotropy of the can wall is considered, reveals that the margin of stress to cause fracture is the smallest at the can circumferential angle of 22.5°. This corresponds well to the results of ironing fracture test.
-
(5)
The influence of r-value is particularly large on the anisotropy of the margin of stress, that is, the anisotropy of the resistance to fracture. When the anisotropy of r-value is decreased, the fracture limit of 22.5° is increased.
REFERENCES
- 1) E. Usui and T. Inaba: J. JILM 34 (1984) 317–324.
- 2) S. Tsuchida and K. Ito: Sumitomo Light Metal Technical Report 49 (2008) 65–71.
- 3) H. Abe, K. Kitamura, K. Nakagawa and H. Kuguminato: Kawasaki Steel Technical Report 8 (1976) 42–59.
- 4) M. Oyane, K. Osakada, I. Tamura, Y. Tozawa, T. Hirai and S. Miura: Sosei-kakougaku, (CORONA Publishing Co., Ltd., Tokyo, 1980) pp. 236–250.
- 5) S. Fukui: J. JSTP 12 (1971) 701–709.
- 6) S. Okamoto and S. Tsuchida: Sumitomo Light Metal Technical Report 20 (1979) 23–29.
- 7) J.W. Yoon, R.E. Dick and F. Barlat: Int. J. Plast. 27 (2011) 1165–1184.
- 8) T. Kuwabara and S. Ikeda: Tetsu-to-Hagané 88 (2002) 334–339.