Abstract
This study aims to evaluate the effective thermal conductivity of graphite flake/aluminum composites using two-dimensional (2D) image simulations. However, the effective thermal conductivity calculated from the two-dimensional microstructure images may not be equivalent to that measured using the experimental methods. The reason is that the two-dimensional microstructure image cannot reveal depth information based on the observation surface, which leads to the orientation difference between the graphite flakes in the 2D microstructure image and the experimental sample. Here, the orientation of the graphite flakes relative to heat flow direction was characterized by the angle between the graphite flake basal plane and the heat flow direction. The relationship between the angles in the 2D cross-sections extracted from three-dimensional (3D) models, angles in the 3D models, and aspect ratios of graphite flakes displayed in the 2D cross-sections were studied by computer simulation. We found that the angle in the 2D cross-section was larger than that in the corresponding 3D model, and the difference between the angles can result in a thermal conductivity error of up to 840 W m−1 K−1. In addition, all the angles and aspect ratios were distributed on a curved surface, and the curved surface function could convert the angle in the cross-section into the corresponding angle in the 3D model. Finally, the effective thermal conductivity of the graphite flake/aluminum composite with 10 vol% graphite flakes was determined using a 2D image simulation, and the interfacial thermal conductance was calculated by the reversed method.
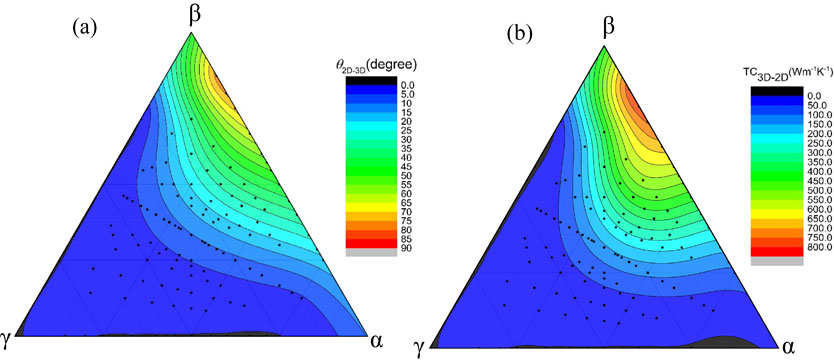
Fig. 5 Orientation difference between the GFs in the 2D cross-sections and in the 3D models (a); TC difference between the GFs in the 2D cross-sections and in the 3D models (b).
Fullsize Image

