2. Procedure
2.1 Overview of the thermal fatigue life calculation method
The following procedure was used to calculate the thermal fatigue life of solder joints in a BGA package by incorporating the decrease in creep strength due to microstructural coarsening of the solder alloy.
First, a low cycle test was conducted using a miniature solder joint specimen that mimics the real BGA solder joint in the package. Morrow’s law for fatigue life prediction using the inelastic strain energy density range Win was then set up. Since life prediction by Morrow’s law is relatively insensitive to microstructure, it was assumed that the life prediction law is not dependent on the microstructure of solder. However, microstructural dependence is taken into account since the creep constitutive equation is sensitive to microstructure. Sn–Ag–Cu alloys are dispersion-strengthened alloys, and their creep strength is assumed to be controlled by the particle size of intermetallic compounds. The growth of the particles is described by the strain-enhanced growth model, which is then incorporated into the creep constitutive equation. The creep constitutive equation is updated at each given cycle to perform thermal stress analysis of the BGA package by FEM. Through these processes, changes in Win associated with the progress of cycling are obtained. This relationship is substituted into the fatigue life prediction law to calculate the thermal fatigue life.
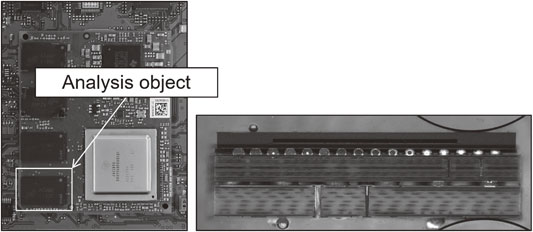
The white frame in Fig. 1 shows the BGA package that was analyzed. The BGA package is composed of a mold resin, FR-4, Si, solder, and copper wiring layers. The solder bumps consist of Sn–3.0 mass%Ag–0.5 mass%Cu (hereinafter, mass% is omitted). The microstructure of the solder bump is shown in Fig. 2 and the dimensions of the package are shown in Table 1.

Table 1 Dimensions of BGA semiconductor package.
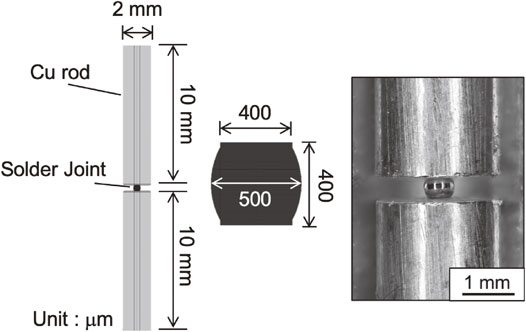
The micro solder joint specimen used in this study consisted of two cylindrical copper rods connected by a solder ball of diameter 500 µm (Fig. 3).7) The cylindrical copper rods had a length of 10 mm and a diameter of 2 mm. The specimen was made such that the shape of the solder joint became the same as the BGA package solder joint, which is described later. Soldering was performed in air with RMA (rosin, mildly activated) flux at 518 K.
A displacement-controlled low-cycle shear fatigue test was conducted. The test temperature was 358 K, which is the highest temperature used in accelerated tests. One of the temperature profiles used for thermal stress analysis of the BGA package is described later. The control wave was a symmetrical triangle waveform. The nominal strain rate was 10−3/s. The fatigue testing machine (LMH207-20: SAGINOMIYA SEISAKUSHO, INC) shown in Fig. 4 was used. This testing machine uses a piezo stage with a displacement-enlarging mechanism as its actuator, with a maximum stroke of ±250 µm and a load cell capacity of ±40 N. The fatigue life was defined as the number of cycles at which the initial load measured during the testing decreased by 50%. The inelastic strain energy density range ΔWin calculated by FEM was used as a parameter for evaluating fatigue life. As an additional note, ΔWin was the volume average of element solutions in the white frame in Fig. 5 equivalent to the crack length at the time when the fatigue life was reached. The calculation formula of ΔWin is given by
| \begin{equation}
\Delta W_{\text{in}} = \frac{\displaystyle\sum \Delta W_{\text{in}}^{\text{element}}\cdot V^{\text{element}}}{\displaystyle\sum V^{\text{element}}}
\end{equation}
| (1) |
where Δ
Winelement is the element solution of inelastic strain energy density range, and
Velement is the volume of the element. The nonlinear kinematic hardening rule (Chaboche model) was used for the strain hardening of solder and the constant was determined from the low cycle fatigue testing by inverse-analysis. Morrow’s fatigue life law as shown in
eq. (2) was then determined from the relationship between Δ
Win calculated by FEM analysis and fatigue life.
8)
| \begin{equation}
\Delta W_{\text{in}}\cdot N_{\text{f}}^{\beta} = C
\end{equation}
| (2) |
Here, Δ
Win is the inelastic strain energy density range,
Nf is the fatigue life, and β and
C are the material constants.
2.3 Stress relaxation test for creep constitutive equation
The creep constitutive equation was determined by the data obtained from stress relaxation testing which was performed at multiple temperatures using a miniature solder joint specimen.9) The miniature solder joint specimen was created by using two solder balls to join two copper rods. The size of the copper rods was 2 × 10 mm. The soldering conditions were the same as the fatigue test specimen. The specimen and initial microstructure are shown in Figs. 6 and 7. The testing machine was the same as the one used in the low cycle testing. The multi-temperature stress relaxation test procedure was as follows. First, a shear displacement was continuously applied to the specimen at the test temperature of 398 K until steady-state stress appeared. Next, the displacement was held, and the first stress relaxation test was carried out. After the decrease in stress is mostly relieved, the test temperature was set to 348 K and the shear displacement and stress relaxation measurements were again performed. Finally, the temperature was set to 298 K and the third stress relaxation test was performed. Equation (4) was obtained by curve-fitting to the relaxation curve on the assumption that the stress relaxation part of the load-time curve at each temperature would obey Norton’s law shown in eq. (3) for the creep at each individual temperature.
| \begin{equation}
\dot{\varepsilon} = A\sigma^{n}
\end{equation}
| (3) |
| \begin{equation}
\frac{1}{\sigma^{n-1}} - \frac{1}{\sigma_{\text{i}}^{n-1}} = (n-1)AEt
\end{equation}
| (4) |
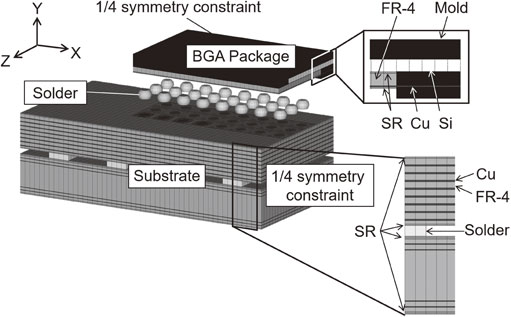
Figure 8 shows the FEM model of the BGA package. The FEM model was 1/4 symmetry of the structure in which the BGA package was joined on the FR-4 substrates. The two substrates were connected by solder bumps. The element was a solid 20-node hexahedral and the model scale was 560000 nodes. For the material properties, the solder alloy was treated as an elastic creep body, the mold resin and FR-4 substrates were treated as viscoelastic bodies, and the other constituent materials were treated as elastic bodies. Table 2 shows the material properties of the individual constituent materials. The generalized Maxwell model in eq. (5) was applied to the viscoelastic constitutive equation.
| \begin{equation}
E(t) = E_{\text{e}} + \sum_{\text{i=1}}^{n} E_{\text{i}}\exp \left(-\frac{t}{\tau_{\text{i}}}\right)
\end{equation}
| (5) |
where
E(t) is the relaxation modulus,
Ee is the long-term elastic modulus,
n is the Prony series term,
Ei and τ
i are Prony series approximation coefficients, and
t is the relaxation time. Furthermore, fine element meshing was provided to the solder balls at the corners that were most subjected to loads. The temperature cycling conditions used in the FEM analysis were three levels of an accelerated test (233 K
$ \leftrightarrows $ 358 K) and two temperature profiles to simulate the field environment (298 K
$ \leftrightarrows $ 348 K). JEITA ET7407-B
10) was used as a reference for the temperature profiles.
Figure 9 shows the temperature profiles for each condition. The parameter used for evaluating the thermal fatigue life was the same Δ
Win as that in the low cycle fatigue testing and Δ
Win per cycle was obtained for the solder bump in which Δ
Win was maximum. Δ
Win which is obtained from the areas shown in
Fig. 10 was the volume average of the element solutions in these areas. Additionally, the element sizes were the same for both the solder bumps in the BGA package and the solder joint in the specimen used in the low cycle fatigue testing. The solver used was a general-purpose code ANSYS ver 18.1.

Table 2 Material properties.
3. Results and Discussion
3.1 Creep constitutive equation incorporating the microstructural coarsening effect
Figure 11 shows the relationship between the temperature compensated strain rate factor and stress. The relationship between the temperature compensated strain rate factor and the log-log plots of stress became hyperbolic and the generalized Garofalo law in eq. (6) held.
| \begin{equation}
\dot{\varepsilon} = A_{1} [\sinh (\alpha \sigma)]^{n}\exp \left(-\frac{Q}{RT}\right)
\end{equation}
| (6) |
where
$\dot{\varepsilon }$ is the steady-strain rate,
A1, n, and α are the material constants,
Q is the apparent activation energy,
R is the gas constant, and
T is temperature.
A1,
n, α, and
Q were 5.75 × 10
6, 7.8, 0.03, and 70 kJ/mol, respectively. The stress exponent was 7 or more and the strengthening mechanism in Sn–Ag–Cu alloys used in the study was dispersion strengthening by Ag
3Sn.
11–14)
The steady-state creep constitutive equation for metals is commonly represented by the following eq. (7) for all deformation mechanisms.15,16)
| \begin{equation}
\dot{\varepsilon} = \dot{\varepsilon}_{0}\frac{G\varOmega}{kT} \left(\frac{b}{d_{\text{g}}}\right)^{p} \left(\frac{\sigma}{G}\right)^{n}\frac{D}{b^{2}}
\end{equation}
| (7) |
where
$\dot{\varepsilon }$ is the strain rate,
$\dot{\varepsilon }_{0}$ is the material constant,
G is the rigidity,
Ω is the atomic volume,
k is Boltzmann’s constant,
T is temperature,
b is the Burgers vector,
dg is the crystalline particle diameter,
p is the grain diameter exponent, σ is the stress,
n is the stress exponent, and
D is the diffusion coefficient. In the dislocation creep, the grain diameter exponent
p in
eq. (7) becomes zero, and the constitutive equation is expressed by
eq. (8).
| \begin{equation}
\dot{\varepsilon} = \dot{\varepsilon}_{0}\frac{G\varOmega}{kT} \left(\frac{\sigma}{G}\right)^{n}\frac{D_{\text{eff}}}{b^{2}}
\end{equation}
| (8) |
where
Deff is the effective diffusion coefficient. The stress exponent is 7 or more in the study, which indicates that the precipitation or dispersion strengthening mechanism is working as a creep deformation mechanism and the creep strength is controlled by the interparticle spacing between dispersoids of Ag
3Sn. Since it is known that dispersoids become coarse by heat diffusion and mechanical strain in long-term use under service conditions,
7) a constitutive equation in which the interparticle spacing is incorporated is required.
Equation (8) is regarded as hyperbolic
17) and furthermore when the interparticle spacing is incorporated into the constitutive equation, this gives
eq. (9).
| \begin{equation}
\dot{\varepsilon} = A_{2}\frac{Gb}{kT}\left(\frac{\lambda^{2}}{d_{\text{p}}}\right)\left[\sinh \left(\frac{\alpha \sigma}{G}\right) \right]^{n}D_{\text{eff}}
\end{equation}
| (9) |
where
A2 is the material constant, λ is the interparticle spacing between dispersoids, and
dp is the diameter of dispersoid.
| \begin{equation}
\frac{\lambda^{2}}{d_{\text{p}}} = A_{3}\frac{r}{V_{\text{f}}^{2/3}} = A_{4}r
\end{equation}
| (10) |
The interparticle spacing λ and the diameter of dispersoid
dp in
eq. (9) were converted into the particle radius
r by using the solid volume ratio
Vf in
eq. (10) to obtain the creep constitutive equation
eq. (11) incorporating the growth of dispersoids.
| \begin{equation}
\dot{\varepsilon} = A_{5}\frac{Gb}{kT}r\left[\sinh \left(\frac{\alpha \sigma}{G}\right)\right]^{n}D_{\text{eff}}
\end{equation}
| (11) |
It has been reported in previous studies of Sn–Ag–Cu alloys that an increase in the creep strain rate accompanied by the growth of dispersoids can be expressed by
eq. (11).
18–20) Equation (11) was also employed for the creep constitutive equation in the study.
As described above, dispersoids grow due to thermal and strain loads during long-term use. First, the growth of dispersoids is assumed to obey the Lifshitz-Slyozov21)-Wagner22) theory of eq. (12).
| \begin{equation}
r(t) = Kt^{1/m}
\end{equation}
| (12) |
where
K is the rate constant,
t is the time, and
m is the growth exponent.
Equation (12) represents the growth of dispersoids by thermal diffusion. Since growth of dispersoids in a thermal fatigue environment is caused by thermal and strain,
eq. (13) which incorporates strain enhancement into
eq. (12) is proposed for the growth of dispersoids.
23,24)
| \begin{equation}
r = \left\{\left[ K_{1}\exp \left(-\frac{Q}{RT}\right) (t+K_{2}\varepsilon_{\text{in}}N) + r_{0}^{3}\right]^{1/m}\right\}
\end{equation}
| (13) |
where
K1,
K2, and N are constants,
Q is the activation energy,
R is the gas constant,
T is the average temperature of thermal profiles,
t is the time, ε
in is the inelastic strain, and
r0 is the radius of dispersoids in the initial microstructure. In
eq. (13),
m represents the growth mechanism, where
m = 2 when the diffusion mechanism of particle growth is the diffusion of interface between particles and the matrix phase,
m = 3 for volume diffusion, and
m = 4 for boundary diffusion.
25) Based on the assumption that particle growth is controlled by volume diffusion,
m = 3 is used in the study. In the study, t is the total time over which the temperature is above 298 K and
T is the integral average of one cycle.
K1,
K2, and
Q are determined based on the results of the past study by the author
et al.
26) The individual constants are shown in
Table 3. The relationship between the radii of dispersoids at 348 K and 398 K and the aging times is shown in
Fig. 12. The apparent activation energy and
K1 were obtained from the relationship. The activation energy for volume diffusion of Ag in the matrix phase of Sn is approximately 50–70 kJ/mol,
27,28) and the results in
Fig. 12 indicate the growth of Ag
3Sn. The relationship between the strain-enhanced growth of Ag
3Sn and cumulative equivalent inelastic strain is shown in
Fig. 13. The straight line in
Fig. 13 is the result of fitting to
eq. (13) and the slope of the line represents the constant
K2. From
Fig. 13,
K2 was determined to be 30000. Theoretically,
K1 is given by
eq. (14).
| \begin{equation}
K_{1} = \frac{B\gamma_{\text{s}}V_{\text{m}}CD_{0}}{RT}
\end{equation}
| (14) |
where
B is the constant, γ
s is the interface energy between the dispersoids and the matrix phase interfaces,
Vm is the molar volume,
C is the equilibrium solute concentration, and
D0 is the frequency factor. Although
K1 has temperature dependence associated with the equilibrium concentration and diffusion,
K1 was determined in this study by treating these dependencies as being contained in
Q in
eq. (13).
The combination of eq. (11) and eq. (13) gives the degradation of creep strength caused by the growth of dispersoid during thermal cycles. In eq. (11), the creep strain rate is proportional to the radius of dispersoid. When the radius of dispersoid grows to r at a given cycle time from r0 in the initial microstructure, the creep strain rate becomes r/r0 times. Thus, eq. (15) which is the result of multiplication of the creep constitutive equation obtained from the stress relaxation test by r/r0 gives the creep constitutive equation at a given cycle time.
| \begin{equation}
\dot{\varepsilon} = A_{1}\frac{r}{r_{0}}\left[ \sinh(\alpha \sigma) \right]^{n}\exp \left(-\frac{Q}{RT}\right)
\end{equation}
| (15) |
Individual material constants are the same as in eq. (6). However, the radius of dispersoid r0 of the specimen for the stress relaxation test is slightly smaller than the radius of dispersoids of the solder joint in the BGA package. Therefore, A1 which was offset by the ratio of the radius of dispersoid in the stress relaxation test specimen to that in the solder joint of the BGA package is used for the creep constitutive equation of the initial microstructure. The value of r0 at the time was 0.15 µm and A1 was 8.63 × 10⁶.
The procedure for performing thermal fatigue analysis of the solder joints in the BGA package is as follows. First, three cycles of temperature cycling were performed by the constitutive equation of the initial microstructure (r/r0 = 1), and then the inelastic strain per cycle in each solder bump (the average of nodal solutions in the area of 60 µm from the top surface of solder bump) was found, and then the creep constitutive equation was updated by the radius r which is calculated at a given cycle by the cycle jump method29–32) by using eq. (13). The analysis continues using the updated creep constitutive equation to find ΔWin after a given cycle. Thereafter, the creep constitutive equation after a given cycle is updated again and ΔWin is determined. This process is repeated to find the relationship between the number of cycles and ΔWin for the calculation of thermal fatigue life using the damage law obtained by the low cycle fatigue test which is described later. Strictly speaking, the radius r should be calculated by an incremental calculation approach. However, because of difficulty in FEM analysis, r was calculated at each given cycle in this study, for the sake of simplicity.
3.2 Relationship between ΔWin and radius of dispersoids during thermal cycles
Figure 14 shows the relationship between the radius of dispersoid in each temperature profile and the number of cycles. In Fig. 14, the effects of thermal diffusion and strain-enhancement on the growth of the dispersoids are shown separately. The radius of dispersoids increased as the number of cycles increased and the increase in Field 2 was significant. As shown in Fig. 14, the growth of dispersoids by thermal diffusion was dominant in the study. Since the average temperature in eq. (13) was calculated by the integral average, the average temperature in Field 2 having the longest dwell time was the highest and the growth of dispersions in Field 2 is the largest compared to the other conditions.

Figure 15 shows the relationship between ΔWin in each temperature profile and the number of cycles. As the number of cycles increased, ΔWin increased. This was because the decrease in creep strength accompanied by the growth of dispersoids reduced the deformation resistance of the solder bumps. In particular, the increase in ΔWin during temperature cycling under the field conditions is large, so the effects of microstructural coarsening in the prediction of fatigue life should not be ignored. The relationship between ΔWin shown in Fig. 15 and the number of cycles was described using the power law and its relationship was eq. (16), eq. (17) and eq. (18).
| \begin{equation}
\text{Accelerated test} \quad \Delta W_{\text{in}} = 0.219N^{0.0222}
\end{equation}
| (16) |
| \begin{equation}
\text{Field 1} \qquad \Delta W_{\text{in}} = 0.0463N^{0.0683}
\end{equation}
| (17) |
| \begin{equation}
\text{Field 2} \qquad \Delta W_{\text{in}} = 0.0377N^{0.0666}
\end{equation}
| (18) |
Figure 16 shows the results of the low cycle fatigue test. The vertical axis indicates the inelastic strain energy density range calculated using the FEM analysis and the horizontal axis indicates fatigue life. Morrow’s law holds as given by eq. (19).
| \begin{equation}
\Delta W_{\text{in}}\cdot N_{\text{f}}^{0.8} = 78
\end{equation}
| (19) |
where the unit of Δ
Win is MJ m
−3. The fatigue exponent of the law was 0.8. It has been reported in structural materials that the fatigue exponent approaches 1 at temperatures where creep deformation is dominant.
33) The test temperature in this study was 0.73
Tm, and therefore the fatigue exponent exhibited a value close to 1.
Since ΔWin depends on the number of cycles, the thermal fatigue life of the solder joint in the BGA package was calculated by using the damage law by converting eq. (19) into eq. (20).
| \begin{equation}
\int_{1}^{N_{\text{f}}} \left(\frac{78}{\Delta W_{\text{in}}(N)}\right)^{-\frac{1}{0.8}} {}= 1
\end{equation}
| (20) |
where Δ
Win (
N) is a function of the cycle dependence of Δ
Win as shown in
Fig. 15. The number of cycles
Nf that satisfy this equation is the thermal fatigue life of the solder joint in the BGA package. It has been reported that Manson-Coffin’s law for solder alloys describes the relationship to the dependence on microstructure.
7) For heat resisting steels, it has been reported that the fatigue life is predictable in specimens with different levels of strength processed under different thermal treatments by using Morrow’s laws.
34) Since the inelastic strain energy density calculated by integrating stress with strain is used in Morrow’s fatigue life laws, the fatigue life is considered insensitive to changes in the strength of the specimen. It was assumed in the study that the fatigue life law of Sn–3.0Ag–0.5Cu alloy was insensitive to microstructural changes.
3.4 Estimation of thermal fatigue life of BGA joint
Figure 17 shows the results of thermal fatigue prediction of the solder joint in the BGA package. Table 3 shows the results of calculating the acceleration factor. The thermal fatigue life calculated by taking into account microstructural coarsening decreased by 13% in the accelerated test, by 40% in Field 1, and by 46% in Field 2 compared to the fatigue life without the microstructural coarsening effect. A major contributor to the decreased strength of Sn–Ag–Cu alloys is thermal diffusion, so the thermal fatigue life under the field conditions with a long dwell time at high temperature is strongly affected by microstructural coarsening. The effects are particularly noticeable in Field 2. However, the decrease in fatigue life caused by microstructural coarsening is small in the accelerated test conditions compared with the field conditions. As Fig. 15 indicates, ΔWin under the accelerated conditions is an order larger than in the field conditions. In the study, when the dependence of ΔWin on the number of cycles was substituted into eq. (20), the number of cycles at which the integral value reaches one is the thermal fatigue life. In the accelerated test with a large ΔWin, the number of cycles that satisfy eq. (20) is very short compared with that in the field and the life cycle is attained before the coarsening effects appear. This means that under loading conditions where ΔWin is large and the fatigue life is short, the decrease in the fatigue life due to microstructural changes is small. This affects the calculation of acceleration factors. When the microstructural coarsening effect was taken into account, the acceleration factors decreased by about 32% in Field 1 and about 39% in Field 2 as shown in Table 4.


Table 4 Acceleration factor under field conditions.