Materials Processing
Microstructural Observation of Dendrite and Its Surrounding Regions Formed during Solidification of Gray Cast Iron
2021 Volume 62 Issue 3 Pages 442-447

Details
2021 Volume 62 Issue 3 Pages 442-447
Molten metal for hypoeutectic gray cast irons was poured into a top-open-type sand mold with furan resin. Unsolidified molten metal was discharged from the mold before the molten metal completely solidified. This resulted in the formation of artificial defects on the solid–liquid phase boundary. Dendrites and other microstructures were observed to be formed near the artificial defects. Sharp dendrite stalks with periodic protrusions around the periphery were observed in macroscopic images. This observation confirmed that the dendrites were growing toward the center of the hole formed by the discharge of the unsolidified molten metal. These results corresponded to the observations made using a scanning electron microscope. Graphite flakes formed parallel to the dendrite branches were observed on the cross-sectional microstructures near the solid–liquid phase boundary. Scanning electron microscopy showed that perlite colonies segmented the dendrite stalk. The area around the dendrite, namely the region formed by eutectic solidification, was composed of perlite, ferrite, and graphite flakes.
This Paper was Originally Published in Japanese in J. JFS 92 (2020) 333–338.
In the process of solidification in cast irons, molten metal expands due to the crystallization of graphite and shrinks due to the crystallization of austenite. When the amount of shrinkage and expansion are in balance, cast irons are not expected to exhibit any overall shrinkage.1,2) It is known that the degree of shrinkage in cast irons is related to the amount of crystalized graphite present during the solidification process. That is, the degree of expansion increases as the amount of crystallized graphite present increases. Therefore, the degree of shrinkage in spheroidal graphite cast iron is less than that in gray cast iron. However, manufacturers believe that shrinkage occurs more readily in spheroidal graphite cast iron than in gray cast iron.3)
The optical microstructures of hypoeutectic gray cast irons obtained by adding different amounts of inoculant and by using ingates of different cross-sectional areas have previously been investigated with regard to shrinkage.3) When eutectic solidification occurs in the unsolidified regions surrounded by proeutectic austenite (dendrite), shrinkage and expansion due to the crystallization of graphite and austenite, respectively, occurs simultaneously. Micro shrinkage pores form at the eutectic cell boundaries unless the amount of shrinkage and expansion are in balance. On the basis the above, we propose a solidification model for hypoeutectic gray cast irons in the paper.3) However, the relationship between the dendrites and eutectic microstructures is still not clear.
It is well known that dendrites can be observed at corner parts and thin wall parts of castings where the cooling rate is faster; at the solid–liquid phase boundary, due to, for example, micro shrinkage pores; and in other regions. Nakae et al.1,4,5) used microscopy to observe microstructures that were obtained by quenching cast iron at various points in the solidification process. Their work showed dendrites crystallize during the solidification process and are present in the microstructure. Their work also showed that dendrites were embraced in the eutectic cells at the eutectic reaction. Therefore, we believe that the dendrites in the gray cast irons that are manufactured by an ordinal process cannot be clearly identified under optical microscopy.
Sugiyama et al.6–8) and Yamane et al.9) carried out in-situ observations of the solidification sequence of a cast iron using time-resolved X-ray imaging with synchrotron radiation. The solidification sequence of hypoeutectic gray cast iron (carbon equivalent (CE) = 4.1) reported by Sugiyama et al.8) is as follows: dendrites form initially as the primary phase; graphite grains appear; the graphite grains immediately transform into graphite flakes; and finally eutectic microstructures centered on the graphite flakes form. The results reported by Sugiyama et al.6–8) and Yamane et al.9) are not in agreement with the accepted solidification process of industrially produced gray cast irons. This is because their results were obtained with a limited volume (sample size: about 10 mm × 10 mm × 0.1 mm) and a non-inoculated molten metal. However, their suggestive results are important when considering the solidification process of gray cast irons.
In this paper, the hypoeutectic gray cast iron, which included the artificial defects formed on the solid–liquid phase boundary, was prepared by the forcible discharge of unsolidified molten metal during the solidification process. The observation of the defects and the surrounding regions will contribute to the understanding of the formation processes occurring during the proeutectic phase (dendrite) and the eutectic phase (austenite and graphite). Dendrites and the surrounding microstructures that formed on the artificial defects were observed and the solidification process of the iron is discussed on the basis of these observations.
Figure 1 shows the procedure for making the test material, a hypoeutectic gray cast iron (equivalent to JIS FC250, 3.50%C–2.03%Si–0.61%Mn–0.031%P–0.018%S) with artificial defects. The sand molds bound with a furan resin (cavity size: 200 mm × 200 mm × 200 mm), which were enclosed by steel frames, were stacked and the cavities formed in each of the molds were connected by a channel with a diameter of 80 mm. The molds were not preheated. Molten metal containing an added inoculation agent was poured onto the top-open part of the upper mold. The pouring temperature as measured using a thermocouple was 1633 K. When the pouring was completed and the temperature on the top surface of the casting was about 973 K, the frame for the upper mold was stripped down. The bottom of the upper mold collapsed due to the external force generated during the above stripping down process. Upon collapsing, a small amount of the unsolidified molten metal was discharged from the bottom of the upper mold. The discharge occurred because the region in the vicinity of the connection between the bottom of the upper ingot and the channel was broken. This resulted in the formation of an ingot with artificial defects that grew from the bottom surface of the ingot to the inside of the ingot. Although the three-dimensional shape of the artificial defects was not observed, the tip of the defects reached a position about 100 mm from the bottom of the ingot (almost the center of the ingot). The approximate dimension of the ingot with the artificial defects was 200 mm × 200 mm × 200 mm. Figure 1 also shows a specimen with artificial defects and the surrounding region. The specimen and surrounding region were extracted by cutting them from the ingot. The solidification process of the hypoeutectic gray cast iron is discussed on the basis of observations of the dendrites and the surrounding microstructures that formed on the artificial defects along the solid–liquid phase boundary.
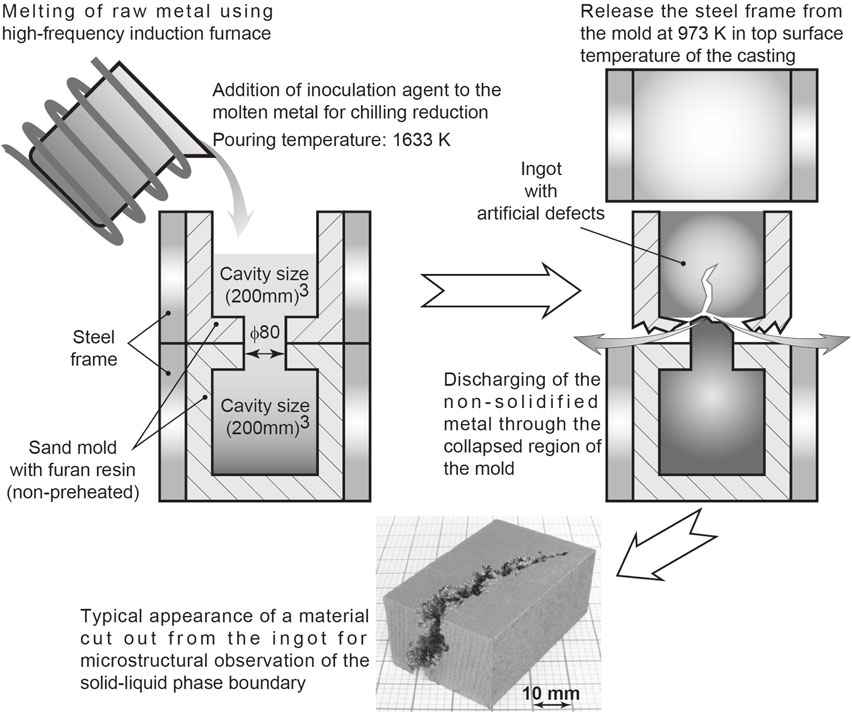
Process of producing test material for the observation of the solid–liquid phase boundary of gray cast irons.
The macroscopic and microscopic features of the solid–liquid phase boundary were observed using a digital camera and a scanning electron microscope equipped with a field emission electron gun (HITACHI S-4200), respectively. The dendrites and the surrounding microstructure were observed using optical and scanning electron microscopy.
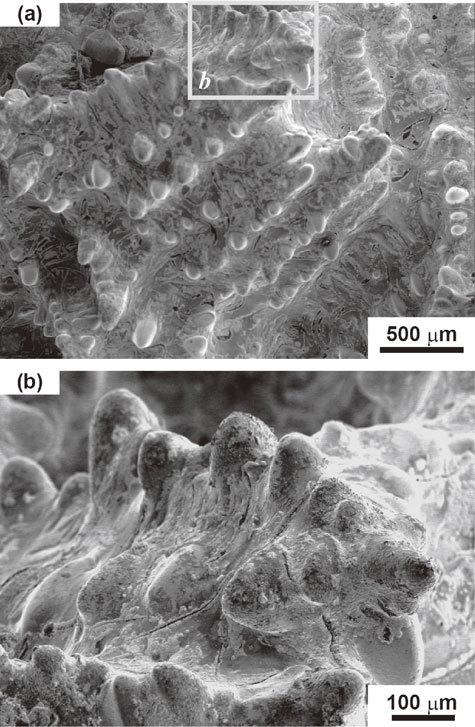
The macroscopic features of the solid–liquid phase boundary observed using a digital camera are shown in Fig. 2. Dendrite skeletons consisting of a sharp stalk with periodic protrusions were observed. The observation confirmed that the dendrite skeletons grew from the solid phase to the liquid phase. Evidence for this is shown in the circled area in Fig. 2(b). Several dendrite skeletons can be seen to have grown toward the center of the hole. These observations confirmed that the dendrites grew from the solidified region to the unsolidified region.
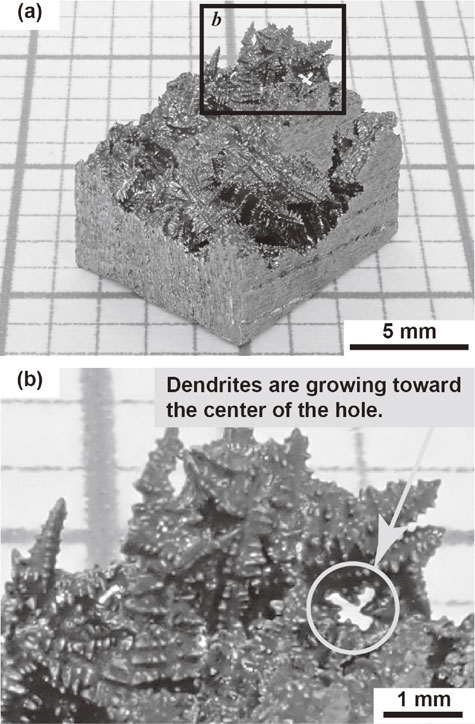
Overall view of the solid–liquid phase boundary. (a) Macroscopic features. (b) Enlargement of the framed area b in (a). Typical dendrite skeleton is clearly observed. Dendrites are growing toward the center of the hole as shown in the encircled area in (b).
Scanning Electron Microscope (SEM) images of the solid–liquid phase boundary are shown in Fig. 3, Fig. 4, and Fig. 5. The characteristics of dendritic solidification are as follows: supercooling of the liquid is a necessary condition for dendritic growth; dendrites grow only in specific crystallographic directions; secondary, tertiary, and high order branches form crystallographically equivalent directions; and branching occurs at equal distances.10) The above-mentioned supercooling is called constitutional supercooling. The growth direction of the proeutectic austenite (dendrite) discussed in this paper is ⟨100⟩γ.11) The crystal growth morphology with the above mentioned characteristics were observed in Fig. 3, Fig. 4 and Fig. 5. This crystal growth morphology has secondary branches that grow at 90 degrees to the growth direction of the dendrite stalk and are arrayed at nearly equal distances. When adjacent dendrite skeletons make contact with each other in the process of dendritic growth, the dendritic growth is completed at the contact region. Several dendrite skeletons appear to grow toward the center of the hollow, as shown in Fig. 4. This microscopic growth feature corresponds to the macroscopic growth feature in Fig. 2. Contrasting lines are observed between the branches in Fig. 4 and Fig. 5. Because the contrasting lines are traces of a phase crystallized after the crystallization of the dendrites, we believe that these contrasting lines reveal the presence of graphite flakes.
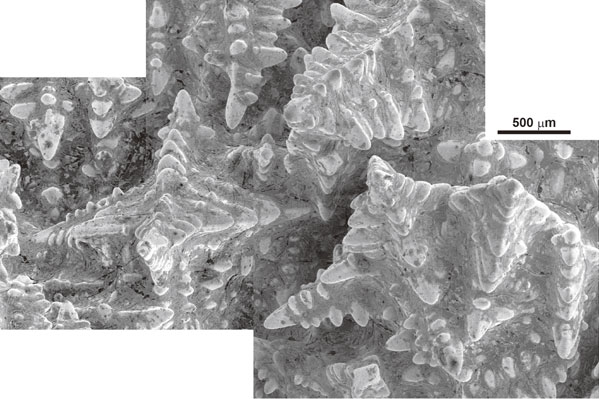
Scanning electron micrograph of the solid–liquid phase boundary. Typical dendrite skeletons and dendrite clusters can clearly be observed.
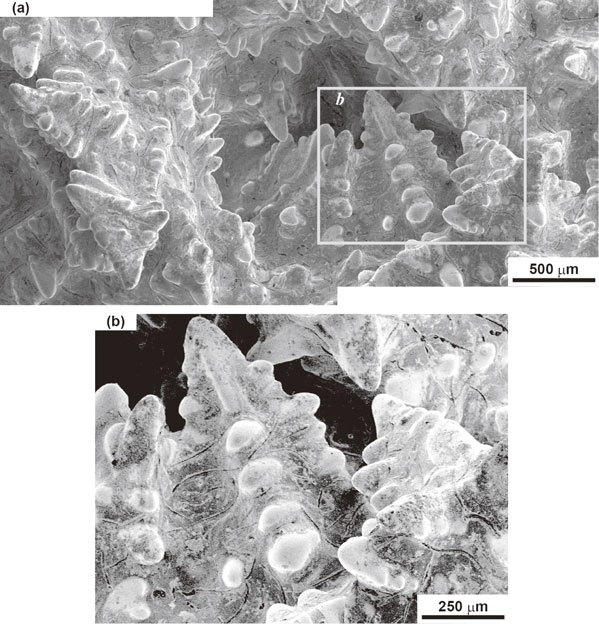
Scanning electron micrographs of the solid–liquid phase boundary. (a) Dendrites are growing toward the center of the hollow. (b) High-contrast and enlarged image of the framed area b in (a). Contrasting lines observed between the branches of the dendrite are believed to be graphite flakes.
Scanning electron micrographs of the solid–liquid phase boundary. (a) Clusters of adjacent dendrite skeletons are observed. (b) High-contrast and enlarged image of the framed area b in (a). Contrasting lines observed between the branches of the dendrite are believed to be graphite flakes.
Cross sectional images of the solid–liquid phase boundary obtained using optical and scanning electron microscopies are shown in Figs. 6 and 7, respectively. We believe the region enclosed by line-like graphite flakes in Fig. 6, i.e., the clear region, corresponds to part of the dendrite skeleton. This is believed to be so because, on the stalk and/or branches, contrasting lines corresponding to graphite flakes were observed under scanning electron microscopy, as indicated in Fig. 4(b) and Fig. 5(b). The line-like graphite flake formed parallel to the growth direction of the branch.
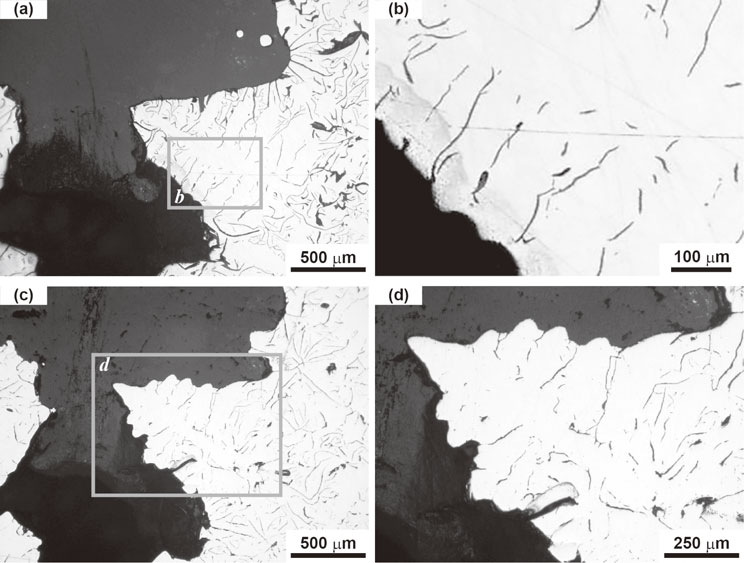
Cross-sectional morphology of the dendrite skeleton. (a) Original cross-section observed with optical microscope. (b) Enlarged view of the framed area b in (a). Graphite flakes can be observed parallel to the branches. (c) A new surface beneath the original cross-section is revealed by mechanical polishing. (d) Enlarged view of the framed area d in (c).

Microstructure of the dendrite and the area surrounding it. Indentations (eight black dots in (a)) are arranged on the interface between the dendrite stalk and its surroundings. Identical indentations are indicated by arrows in (a), (b), and (c). (a) Optical microstructure of the mirror-polished surface. (b) SEM microstructure of the surface etched using a nital solution (mixture of nitric acid and methanol). This image is of the framed area b in (a). (c) Enlarged view of the framed area c in (b). Typical perlite is observed in the dendrite stalk.
When the test material, a hypoeutectic gray cast iron, is produced in an ordinal manufacturing process, the distribution of the graphite in the iron is expected to be type A, which is described in ISO 945-1. However in our experiments, the distribution types D and/or E were observed, as shown in Figs. 6 and 7 (Figure 7 will be described later). Furthermore, a solid–liquid phase boundary, which was formed by the forcible discharge of the unsolidified molten metal, was observed, which is described in the previous chapter. Therefore, microstructures consisting of the primary γ phase (proeutectic austenite, dendrite), γ phase, and graphite (formed by the eutectic reaction), which are indicated in phase diagrams, formed before the discharge. When the unsolidified molten metal was discharged, these three phases were cooled rapidly. As a result, the distribution of the graphite as shown in Figs. 6 and 7 is different from the distribution produced in ordinal manufacturing. We believe this is because the cooling rate in the solidified region after the discharge was much lower than the cooling rate necessary for martensitic transformation, but it was suitable for pearlitic transformation. This is supported by the fact that martensite was not observed under optical microscopy (Representative results are shown in Fig. 7). In addition, the hardness values that are normally associated with martensitic transformation were not obtained with a Vickers hardness test.
Optical and scanning electron images of the dendrite and the surrounding region formed at the solid–liquid phase boundary are shown in Fig. 7. Because graphite flake was not observed in the region, we believe that the region enclosed within the indentations made by a Vickers hardness testing machine corresponds to part of a dendrite skeleton. Figure 7(b) and Fig. 7(c) show scanning electron images etched using a nital solution (mixture of nitric acid and methanol). These images correspond with the image shown in Fig. 7(a). The microstructure of the dendrite stalk is typical pearlite, which consists of multiple colonies. The surrounding region of the dendrite stalk, specifically, the region formed at the eutectic solidification, has a composite microstructure consisting of pearlite, ferrite, and graphite flake.
We assumed the carbon content in each phase and the formation and growth of the graphite flakes to be that given in the temperature range from the eutectic line to the eutectoid line of the calculated ternary phase diagram for Fe–C–2 mass%Si.12) The carbon content of the primary γ-phase (dendrite) is nearly equal to the solid solubility limit when a temperature just above the eutectic line is reached. The eutectic cells, which consist of γ-phase and graphite flakes, are formed when the temperature is decreased below the eutectic line. Moreover, the carbon atoms in the dendrites move to the eutectic cells. Carbon content of the dendrite decreases with decreasing temperature, and eventually a carbon content is reached that gives a eutectoid composition at the eutectoid temperature. This leads to the formation of pearlite in the dendrite stalk, as shown in Fig. 7. The carbon atoms are discharged from the dendrites but cannot solid-dissolve in the γ phase formed at the eutectic reaction. This is because the solid solubility limit of carbon atoms in the γ phase decreases with decreasing temperature, as shown in the calculated ternary phase diagram for Fe–C–2 mass%Si;12) therefore, when the γ phase forms at the eutectic reaction, it requires the discharge of carbon atoms. In our experiment, we believe that the carbon atoms, which were discharged from both the dendrite and the γ phase formed at the eutectic reaction, contributed to the precipitation of the graphite flake and/or the growth of the existent graphite flake. The unsolidified molten metal was expected to be discharged following the precipitation and growth of graphite flakes; hence, the discharge of the unsolidified molten metal resulted in the preservation of the state due to the rapid cooling of the solid phase. Subsequently, the optical and scanning electron microstructures shown in Figs. 6 and 7 were obtained.
The phenomena related to eutectic solidification, which occurred in the region surrounded by the proeutectic austenite (dendrite), was not fully observed in this paper. One reason for this is the difficulty in making a quantitative evaluation of the carbon atoms that diffuse between the phases formed during the solidification process. Crystallographic information on the microstructures formed on the solid–liquid phase boundary could not be obtained. We believe that transmission electron microscopy observations of dendrites and the vicinity are important in order to discuss phenomena related to eutectic solidification.
The solid–liquid phase boundary of the hypoeutectic gray cast iron, which was formed by the forcible discharge of the unsolidified molten metal during the solidification process, was obtained. The proeutectic austenite (dendrite) and the surrounding regions included in the phase boundary were observed. The results can be summarized as follows: