Abstract
Search for high-order semiconducting quasicrystalline approximants can play an essential role in finding clues to the discovery of semiconducting quasicrystals. According to the previous theoretical work, a model of Al–Pd–Co 1/1 cubic quasicrystalline approximant was predicted to be semiconductor from a calculation based on the density functional theory. We noticed that the F phase in the Al–Pd–Co system is a 2 × 2 × 2 superlattice structure of the calculated model. To verify this prediction, we synthesized the F phase sample, and measured its thermoelectric properties. The measured electrical conductivity linearly increases with increasing temperature. The magnitude of measured Seebeck coefficient is smaller than the typical semiconductor. These properties indicate that the prepared sample of the F phase has a pseudogap rather than a finite band gap. To investigate this discrepancy between the theoretical prediction and experimental results, we calculated the electronic structure for the three structural models using density functional theory. The most energetically stable model has a semimetallic electronic structure.
1. Introduction
More than 80 different types of thermodynamically stable quasicrystals (QCs) have been identified so far.1) However, all of them are metallic, and no semiconducting or insulating QCs have been found. The search for semiconducting QCs is not only one of the challenging problems in solid-state physics, but also has great potential for application to high-performance thermoelectric materials.2) The performance of a thermoelectric material can be evaluated using the dimensionless figure of merit zT = S2σT/(κel + κlat), where S, σ, T, κel, and κlat are the Seebeck coefficient, electrical conductivity, absolute temperature, electronic thermal conductivity, and lattice thermal conductivity, respectively. The highest zT among QCs achieved to date is 0.26 at 500 K in an Al–Ga–Pd–Mn QC,3) which is approximately one quarter of a target value of unity. The main problem is that the value of |S| (≈ 100 µV K−1) is approximately one half of that of typical practical materials. To obtain a sufficiently large |S| at T, a semiconductor with a band gap of 6–10kBT, where kB is the Boltzmann constant, is usually required.4) Therefore, the discovery of a semiconducting QC is necessary to enable the breakthrough of QCs for use as thermoelectric materials.
In our previous works, we searched for a semiconducting quasicrystalline approximant (QCA) by both calculations based on the density functional theory (DFT) and experiments.5–10) Recently we successfully found a semiconducting 1/0 QCA in Al–Si–Ru system from a DFT calculation and thermoelectric transport measurements.8) For the next step to the discovery of semiconducting QCs, semiconducting higher-order QCAs such as 1/1 QCAs are required to be found.
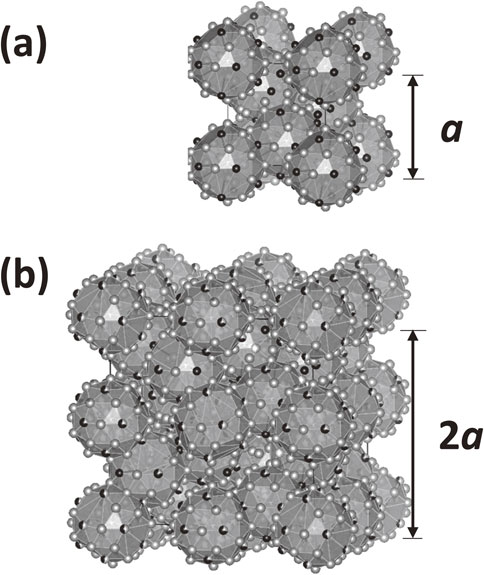
Krajcí et al. calculated the band structure of a hypothetical 1/1 QCA model based on the Katz–Gtatias–Boudard (KGB) model (hereafter referred to as the KGB 1/1 model). They found that the model has a semiconducting band structure in more than 9 compositions.11) We noticed that the F phase in the Al–Pd–Co(–Ge) system12) is a 2 × 2 × 2 superlattice structure of the KGB1/1 model (see Fig. 1), and it may thus be a semiconductor.
In this study, we synthesized samples of the Al–Pd–Co F phase and measured their thermoelectric properties to determine whether they exhibit semiconductor-like properties experimentally. The structural model dependence of the electronic structure and the thermodynamic stability of the three Al–Pd–Co KGB1/1 models was also discussed by DFT calculations and compared with experimental results.
2. Methods
Synthesis of the Al–Pd–Co F phase was carried out using commercial element powders of Al, Co (3N purity; Kojundo Chemical Laboratory Co., Ltd., Japan) and Pd (3N purity; Tanaka Kikinzoku Kogyo Co., Ltd., Japan) with a nominal composition of Al72Pd9.5Co18.5, which was chosen following previous works.14,15) The powders were mixed and then pressed into disc shaped pellets. The pellet was melted using the arc-melting method under argon atmosphere. Weight loss during arc-melting was less than 5%.
The ingot was wrapped in a tantalum foil and sealed in a quartz tube filled with argon gas, followed by annealing at 1223 K for 72 h and water quenching. The annealed ingots were ground into powder with a particle size of approximately 10 µm and then sintered via spark plasma sintering (SPS-515S; Sumitomo Coal Mining Co., Ltd.). The temperature of the specimen was increased from room temperature to 1223 K, and then held for 10 min with a uniaxial pressure of 90 MPa under argon atmosphere.
Phases in the sample were identified via X-ray powder diffraction method (XRD) using Cu K–L2,3 radiation (Smart Lab; Rigaku Co., Japan) and scanning electron microprobe–energy dispersive X-ray spectroscopy (SEM–EDX) measurements (JSM-6010LA; JEOL Ltd., Japan) using each elemental standard for composition analysis. a of F phase was determined using Bragg’s law 2d sin θ = nλ, and the following relationship between lattice spacing and Miller indices in cubic system d = a/(h2 + k2 + l2)1/2. σ and S were measured in helium atmosphere from 300 K to 900 K using the four-probe method and the steady-state temperature gradient method, respectively (ZEM-1; Advance Riko, Inc., Japan).
We calculated the electronic band structure and total energy per atom of the Al–Pd–Co KGB 1/1 model (Al92Pd8Co28 per unit cell) based on the model reported by Krajcí et al.11) Since Krajcí et al. showed only the composition, and not the detailed atomic positions of the semiconducting model, we calculated all three possible models keeping the space group (P213) and composition (Al92Pd8Co28 per unit cell). Crystal structure for the three possible models A, B and C are shown in Tables 1 with a lattice parameter a of 12.24659, 1.26113 and 12.27648 nm, respectively. Where, the atomic positions of model B are shown as representatives of the three models. These atomic positions and a for each model were fully relaxed using QUANTUM ESPRESSO package16) with the generalized gradient approximation within Perdew–Burke–Ernzerhof parametrization (GGA-PBE)17) for the exchange–correlation energy functional and ultrasoft Garrity–Bennett–Rabe–Vanderbilt (GBRV) pseudopotential.18) Where, a self-consistent cycle was performed on an unshifted 4 × 4 × 4 wave-vector mesh in the Brillouin zone using the plane wave basis energy cutoff parameter of 0.11 fJ (680 eV). The WIEN2k package,19) which is based on the full potential linearized augmented plane wave method, was used for the band calculations. The GGA-PBE was used for the exchange–correlation energy functional. A self-consistent cycle was performed on an unshifted 8 × 8 × 8 wave-vector mesh in the Brillouin zone using the energy cutoff parameter Kmax = 7.0/RMT, where RMT is the smallest muffin-tin radius in the model, and the radius of each atom was set to default. Using this calculated electronic structure, we calculated the S in the same manner described in elsewhere,6) based on Boltzmann transport theory within the rigid band approximation and the constant-diffusion-constant approximation, which has been used frequently to explain the TE properties of QCAs.6,8,20)
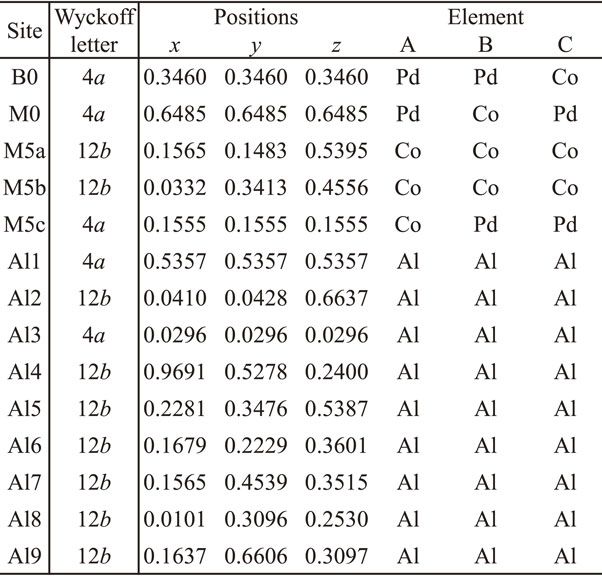
Table 1 Crystal structure for the Al92Pd8Co28 model A, B and C, where the atomic positions of model B are shown as representatives of the three models.
3. Results and Discussion
Figure 2 shows the XRD patterns of the sample, together with the reference of Al–Pd–Co(–Ge) F phase.12) We note that although Ge was doped in reference structure to make it easier to grow a good quality single grain for single crystal X-ray diffraction analysis, diffraction pattern is almost same as undoped sample. No secondary phases appeared in the sample, indicating that the sample is single phase which is also confirmed by using SEM-EDX analysis. The sample composition is Al72Pd9.5Co18.5, which is near Al71.9Pd6.2Co21.9 (Al92Pd8Co28 per unit cell) of KGB 1/1 model. The analyzed composition is Al70(1)Pd9.9(2)Co19.8(4), which is consistent with nominal composition. a of the samples 2.4350(1) nm which is almost consistent with reported values of 2.433712) and 2.4397 nm.14)
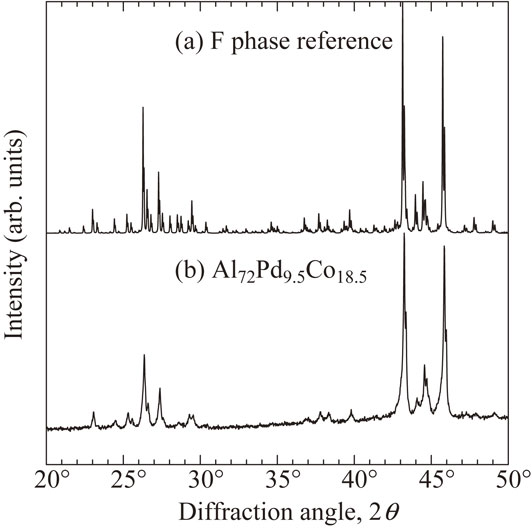
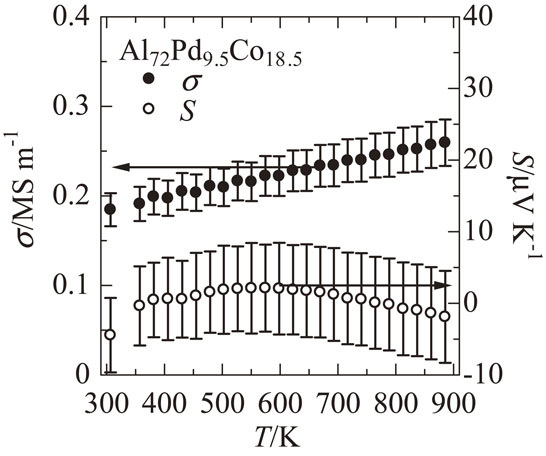
Figure 3 shows σ and S as a function of T for the Al72Pd9.5Co18.5 sample. σ linearly increases with increasing T. This behavior is neither a typical metallic trend, in which σ is proportional to T−1, nor an intrinsic semiconducting trend, in which σ is proportional to exp(−Eg/2kBT), where Eg is the band gap. S shows a negative value at room temperature, a positive extreme value at 600 K, and then decreases to a negative value again at higher temperatures. It is different from a typical metallic trend, in which S increases with increasing T according to Mott formula. These trends of σ and S suggest that Al–Pd–Co F phase has a pseudo gap in the density of states as suggested by previous studies on the thermoelectric properties on high-order QCAs.20,21) The semi-quantitative discussion of the comparison between the DFT-calculated and experimental value of S will be given in a later paragraph.
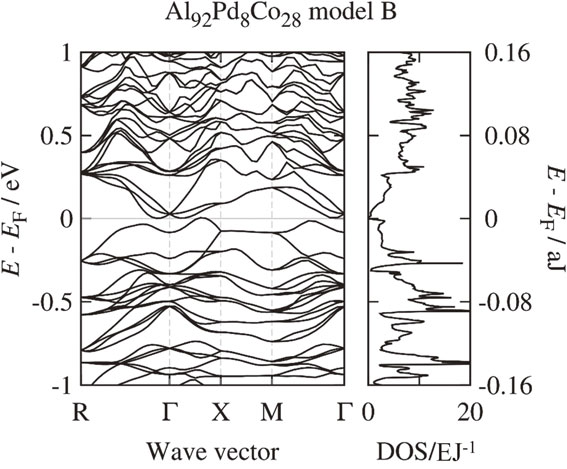
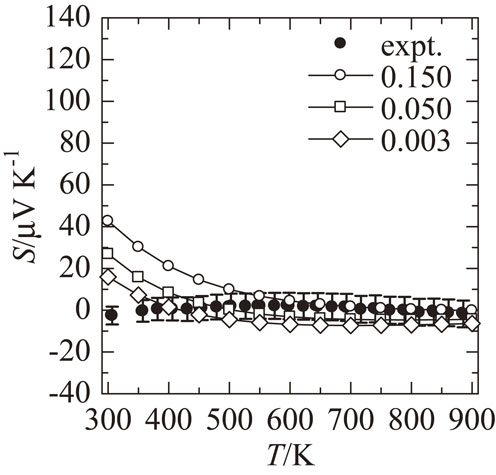
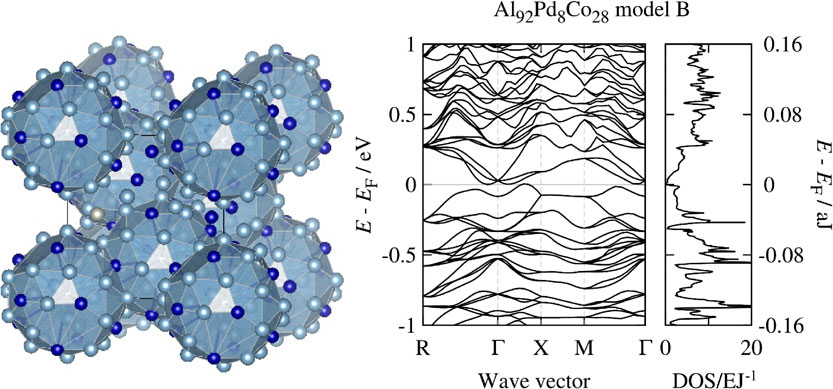
As mentioned above, contrary to previous expectation that it would exhibit semiconducting properties, the thermoelectric properties of F phase show a pseudogap trend. To clarify the cause of this discrepancy, we present the electronic structure and energy stability of the three models calculated in this work. Figures 4 and 5 show the electronic band structures and density of states of Al92Pd8Co28 with model A and B, respectively. The band structure of model A has a narrow band gap of approximately 0.019 aJ (0.12 eV), which is qualitatively consistent with the previous work done by Krajcí et al.11) In the band structure of model B, the band gap is closed. The band structure of model C has a band gap of about the same width as model A (not shown). Total energy per atom of model B shows the lowest value among three calculated models and that of model A and C are 0.0032 aJ (0.02 eV) and 0.0048 aJ (0.03 eV), respectively, higher values than that of model B, indicating that model B is thermodynamically stable. Therefore, the band gap predicted in the model A which support the previous result of Krajcí et al. is unlikely to exist in the prepared sample. Figures 6 and 7 show the T dependence of DFT-calculated S assuming a number of holes per unit cell of 0.003, 0.050 and 0.150 for model A and model B, respectively, together with the experimental value. The calculated S of model A does not describe the experimental results very well at any carrier density, while that of model B describes the experimental results relatively well compared to that of model A, suggesting that this model could be one of the reasons to explain the experimental result. We noted that even the calculated values of model B do not completely reproduce the temperature dependence of the experimental results. A more sophisticated transport theory including interband contributions or more realistic structural models that consider superlattice and mixing sites can be required to reproduce this dependence quantitatively, which is a subject for future work. These results suggest that the crystal structure of the model A is not appropriate to explain the experimental results and that of the model B is the most plausible model to explain the experimental results, namely crystal structure and thermoelectric properties. In fact, the results of the structural analysis,12) in which Co tends to occupy M0 and Pd tends to occupy B0 in the F phase, are consistent with the crystal structure of model B.

For the future work, to realize a high-order semiconducting QCA, it will be necessary to enlarge the band gap by atomic substitution from the viewpoint of band engineering8) keeping the thermodynamic stability.
4. Conclusion
We synthesized Al–Pd–Co 1/1 QCA which was expected to show semiconducting properties and clarified its thermoelectric properties. The σ increased with increasing T. The absolute value of S decreased with increasing T. These results suggest that the Al–Pd–Co 1/1 QCA is not a semiconducting QCA, but a more energetically stable gap-closed model might be achieved in the electronic density of states which is confirmed by DFT calculation.
Acknowledgments
One of the authors (Y. I.) was supported by JSPS through Research Fellowship for Young Scientists. This work was supported by JSPS KAKENHI Grant Number JP19H05818 and JP19J21779.
REFERENCES
- 1) W. Steurer and S. Deroudi: Crystallography of Quasicrystals, (Springer, Switzerland, 2009).
- 2) Y. Takagiwa and K. Kimura: Sci. Technol. Adv. Mater. 15 (2014) 044802.
- 3) Y. Takagiwa, T. Kamimura, S. Hosoi, J.T. Okada and K. Kimura: J. Appl. Phys. 104 (2008) 073721.
- 4) J.O. Sofo and G.D. Mahan: Phys. Rev. B 49 (1994) 4565.
- 5) K. Kitahara, Y. Takagiwa and K. Kimura: J. Phys. Soc. Jpn. 84 (2015) 014703.
- 6) K. Kitahara, Y. Takagiwa and K. Kimura: Mater. Trans. 60 (2019) 2490–2498.
- 7) Y. Iwasaki, K. Kitahara and K. Kimura: J. Alloy. Compd. 763 (2018) 78–84.
- 8) Y. Iwasaki, K. Kitahara and K. Kimura: Phys. Rev. Mater. 3 (2019) 061601.
- 9) Y. Iwasaki, K. Kitahara and K. Kimura: Mater. Trans. 61 (2020) 2079–2082.
- 10) Y. Iwasaki, K. Kitahara and K. Kimura: J. Alloy. Compd. 851 (2021) 156904.
- 11) M. Krajcí and J. Hafner: Phys. Rev. B 68 (2003) 165202.
- 12) K. Sugiyama, K. Yubuta, Y. Yokoyama, S. Suzuki and R. Simura: Acta Phys. Pol. A 126 (2014) 588–593.
- 13) K. Momma and F. Izumi: J. Appl. Cryst. 44 (2011) 1272–1276.
- 14) M. Yurechko, B. Grushko, T. Velikanova and K. Urban: J. Alloy. Compd. 337 (2002) 172–181.
- 15) L. Ďuriška, I. Cernickova, P. Priputen and J. Janovec: J. Phase Equilib. Diffus. 40 (2019) 45–52.
- 16) P. Giannozzi et al.: J. Phys. Condens. Matter 21 (2009) 395502.
- 17) J.P. Perdew, K. Burke and M. Ernzerhof: Phys. Rev. Lett. 77 (1996) 3865–3868.
- 18) K.F. Garrity, J.W. Bennett, K.M. Rabe and D. Vanderbilt: Comput. Mater. Sci. 81 (2014) 446–452.
- 19) P. Blaha, G. Madsen, K. Schwarz, D. Kvasnicka and J. Luitz: WIEN2k, An Augmented Plane Wave + Local Orbitals Programs for Calculating Crystal Properties, Vol. 1, (Vienna University of Technology Institute of Materials Chemistry, Vienna, 2017).
- 20) T. Takeuchi, T. Otagiri, H. Sakagami, T. Kondo, U. Mizutani and H. Sato: Phys. Rev. B 70 (2004) 144202.
- 21) T. Takeuchi, T. Onogi, H. Sato, T. Otagiri, U. Mizutani, K. Kato and T. Kamiyama: Phys. Rev. B 68 (2003) 184203.