Abstract
The prevention rate (PR: the index calculated from the corrosion rate of the non-protection and protection time) is generally employed as the evaluation index of the effect of the cathodic protection of the port steel structures in Japan. When designing the cathodic protection, the prevention rate has been employed as 90% since ancient times. However, if the corrosion rate of the steel is sufficiently close to zero, it is considered that the prevention rate is theoretically close to 100%.
In this paper, firstly, we investigated aging changes of the cathodic prevention effect for 4 years by using test pieces installed in Japanese 4 ports. We arranged aging changes of the evaluation index which showed as the effect of the cathodic protection based on the result. Next, based on the above survey results, by using a large number of test pieces (total of 650 pairs) installed at port facilities in the whole country, we grasped the actual condition of the effect of the cathodic protection and verified while comparing evaluation index which shows the effect of the cathodic protection.
On the result, it was considered that it was desirable to evaluate the effect of the cathodic protection as “corrosion rate during the cathodic protection” which is a state at the time of the cathodic protection and includes factors of time as the index of the effect of the cathodic protection. In addition, it was suggested that the value of “corrosion rate at the cathodic protection” as an evaluation index of the effect of the cathodic protection was about 0.01 mm/y.
This Paper was Originally Published in Japanese in Zairyo-to-Kankyo 68 (2019) 220–226.
1. Introduction
Cathodic protection has become an essential technology in the design of port and harbor facilities in Japan today, more than 60 years after it was first trialled in sections of the Port of Amagasaki in 1952.
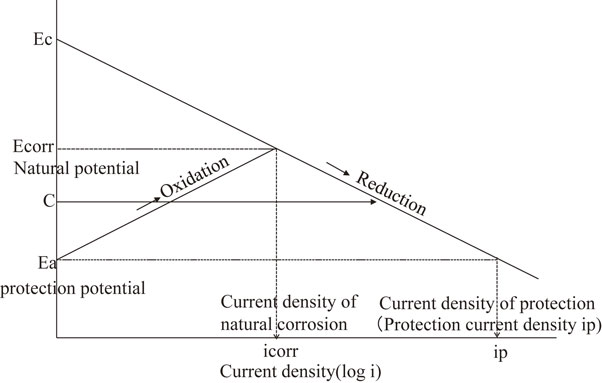
Figure 1 illustrates the theory underlying its application in port and port steel structures.1) Briefly, steel undergoes corrosion when a so-called corrosion cell forms between cathodic regions of high nobility and anodic regions of low nobility on its surface, which drives oxidation at the anodic regions and the loss of iron (Fe) ions into solution.
In cathodic protection, a protective current is supplied to the steel from outside, turning its entire surface into the cathode of a larger system: its potential is gradually decreased to the equilibrium potential of the anodic regions, thereby eliminating potential differences across its surface, and effectively reducing the corrosion rate to zero.
Today, the effectiveness of cathodic protection is generally evaluated using an index called prevention rate, which is described in the Technical Standards and Commentaries for Port and Harbor Facilities in Japan.2) Prevention rate (PR) is calculated according to eq. (1), as the difference between the corrosion rates (mm/y) observed under unprotected and protected conditions—C and P, respectively—divided by the unprotected rate.
| \begin{equation}
\mathit{PR} (\%) = \frac{C - P}{C} \times 100 = \left( 1 - \frac{P}{C} \right)\times 100
\end{equation}
| (1) |
Japanese design standards for cathodic protection in port and port steel structures stipulate that it be applied to all sections below the mean low water level (M.L.W.L.) and achieve a prevention rate of 90%. This value—first specified in the 1970 Design Standards for Port and Port Steel Structures3)—was chosen to be on the safe side, guided by corrosion allowance, a related parameter conventionally used for steel structures before the advent of cathodic protection.
However, prevention rate as calculated by (1) can become exaggerated in harsh environments, which accelerate corrosion in unprotected steel, making this index highly dependent on ambient conditions. Moreover, if a structure was originally installed with a cathodic protection system, then its unprotected corrosion rate is unknowable, making it impossible to calculate prevention rate. Corrosion evaluation would surely benefit from a different index, whose calculation does not require the unprotected rate.
The future thickness (strength) of a cathodically protected structure can be estimated using prevention rate. A value of 90% signifies that corrosion will progress at 10% of the unprotected rate. For example, consider a structure with a design life of 50 years and an unprotected corrosion rate of 0.2 mm/y: a prevention rate of 90% would limit the damage to 1 mm over the course of its working life. For new structures, such degradation can be accommodated by initially specifying steel of greater thickness: i.e., the corrosion allowance mentioned above. When seeking to apply cathodic protection to older structures, on the other hand—many of which have existed for decades without it, and are intended to be serviceable for many more—some corrosion is still expected to occur, potential reducing the thickness and strength of some components to below specifications within their working life.
To address these issues, the real-world effectiveness of cathodic protection—along with common indicators used to evaluate it—should be verified based on the latest knowledge on the topic. In this paper, we first present the results of experiments we conducted using steel test pieces over four years at four Japanese ports, detailing the changes in two indices of corrosion resistance over time. Next, we explore the actual effectiveness of cathodic protection systems based on a national survey of past data for the large number of test pieces (650 sets), from similar experiments run in ports and ports all over Japan since 1966. Our paper concludes with discussion on which of the indices is the best for evaluating the effectiveness of cathodic protection.
2. Temporal Changes in the Effectiveness of Cathodic Protection
In this section, we consider two indices of effectiveness of cathodic protection under protected conditions—prevention rate and prevention effect—based on the temporal changes of test pieces set up in properly maintained port structures (i.e. regularly inspected for corrosion, potential of steel ≤−800 mV vs. Ag/AgCl [SW]). Our methodology was informed by a previous investigation of the effectiveness of cathodic protection over time.4)
2.1 Experimental method
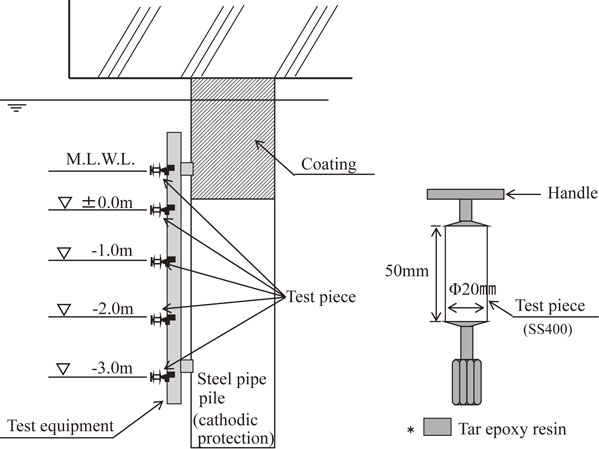
Figure 2 is a schematic of the set-up of the test pieces at each port. Seawater resistivity ranged from 20–30 Ω·cm at each port, within the expected range for seawater. The ports’ design protection current density (in seawater) was specified as 130 mA/m2 at the Ports of Tokyo and Osaka and 100 mA/m2 in the Ports of Yokkaichi and Kitakyushu. Test pieces were cylinders of SS400 steel (Φ = 20 mm, L = 50 mm) with a handle and nut attached to the two circular faces with epoxy resin, leaving only the circumference exposed. They were installed along a steel-pipe pile under a pier at each location, at predetermined depths at and below its M.L.W.L. (Fig. 2). Test pieces were never unprotected: we ensured each was connected to the structure’s existing anode so that it would conduct the protective current from the instant it was submerged. They were recovered and weighed at selected time points, after first chemically treating them to remove adherent material (e.g. corrosion and electrolysis products). Weight loss (g) was calculated according to (2) based on their initial and new masses; corrosion rate was calculated using (3):
| \begin{equation}
W = W_{0} - W_{1}
\end{equation}
| (2) |
| \begin{equation}
C,P = \frac{W \times 10}{7.86 \times T \times S}
\end{equation}
| (3) |
where T is the time since installation (y), S is the surface area of the test piece (cm
2), 7.86 g/cm
3 is the density of SS400 steel, and C and P are the unprotected and protected corrosion rate (mm/y), respectively.
For comparison, we also looked at prevention effect (PE), shown in (4): a related index4) whose calculation involves only weight changes, and does not require knowledge of the corrosion rate under unprotected conditions. This approach can be used to check the performance of cathodic protection systems continuously present in structures since their construction.
| \begin{equation}
\mathit{PE}\ (\%) = \frac{W_{1}}{W_{0}} \times 100
\end{equation}
| (4) |
where
W0 and
W1 are the initial and new masses (g) of the test piece, respectively.
2.2 Experimental results
2.2.1 Temporal changes in cathodic potential
Figure 3 shows the changes in cathodic potential measured at each of the four test sites over time. These values are invariably much lower than the protection potential for maintenance (−800 mV vs. Ag/AgCl [SW]5)), clearly evidencing corrosion-resistant conditions were present throughout the exposure period.
2.2.2 Temporal changes in the effectiveness of cathodic protection
Figure 4 shows the changes in prevention rate and effect at each of the four ports over time. Prevention rate generally increased over time, with some variation between sites. Prevention effect, on the other hand, did not change appreciably over the entire four-year period.
Figure 5 shows the temporal changes in corrosion rate under protected conditions at each of the four test sites. We can see that corrosion rate (i.e. mass loss over time) consistently and continually decreases with time, contrasting with the relatively stable prevention effect in Fig. 4 (a ratio: current mass divided by initial mass). These trends suggest that cathodically protected steel structures initially sustain some damage from corrosion, but subsequently lose hardly any mass. In short, corrosion rate seems better able to capture the mass loss of steel than prevention effect in cathodically protected systems.
These data also suggest that cathodically protected steel is more susceptible to wastage immediately after the system is applied, but grows more resistant once the cathodic potential reaches a steady state.
3. Survey of the Effectiveness of Cathodic Protection in Japan
Several things were revealed by the test-piece experiments reported in the previous section. Prevention rate tended to increase over time, with some variation across test sites, yet prevention effect did not change for the duration of the four-year experiment. However, corrosion rate was more reflective of mass loss over time than was prevention effect. This section details our attempt to determine the real-world effectiveness of cathodic protection systems, based on a survey of steel test pieces tested in ports and ports all over Japan. We compared three indices to determine the best one(s) for evaluating cathodically protected steel: prevention rate (the most commonly used index), prevention effect, and protected corrosion rate.
3.1 Survey method
Our survey analysed existing data for test pieces from similar past experiments conducted at port and port facilities across Japan. We limited our analysis to pieces that had been installed between 1966 and 2007, which were located at a depth at or below the associated structure’s M.L.W.L. at the time of retrieval. The average exposure period was approximately six years. Data on the facilities’ cathodic potential at the time of installation were unavailable.
In addition to the locations of the test sites, Fig. 6 shows a schematic of a typical experimental set-up. Test pieces were installed in pairs, consisting of a protected piece, through which the cathodic current was allowed to flow, and an unprotected piece, blocked off using an electrical insulator.
3.2 Survey results
3.2.1 Effectiveness of cathodic protection based on associations between the unprotected and protected corrosion rates
Table 1 shows the mean corrosion rates recorded in the presence and absence of cathodic protection, organized by region. Regional variation is apparent in the values for the unprotected pieces; Hokkaido’s lower corrosion rate is likely attributable to its colder climate than the other areas. However, almost no such regional differences were observed in the corrosion rates for protected steel, which were uniformly very small.

Table 1 Survey results by test pieces in each region.
Figure 7 and 8 contain cumulative probability distributions of the corrosion rates observed for unprotected and protected steel, respectively. Here, “cumulative probability” is equivalent to the percentage of observations falling under the indicated corrosion rate. For unprotected steel, the mean corrosion rate is 0.148 mm/y, and over 80% of data fall within 0.1–0.3 mm/y, the generally accepted range for unprotected steel in seawater. Corresponding values for protected steel are much smaller: the mean corrosion rate is 0.0024 mm/y, and over 97% of data are 0.01 mm/y or lower.


Figure 9 directly compares the corrosion rates measured for protected and unprotected steel. The dotted line shows each corrosion rate when PR = 90% in eq. (1): i.e. the degree to which cathodic protection should reduce corrosion with respect to unprotected conditions. Equation (1) is predicated upon the idea that there is a correlation between the protected and unprotected corrosion rates. However, the slope of the regression line in Fig. 9 falls quite short of the 90% target. In addition, prevention rate is highly variable in the dataset: this seems primarily attributable to large variation in the unprotected corrosion rate, since the protected rate is rather constant across the regions surveyed. Equation (1) also tells us that when the protected rate (P) is relatively constant, higher unprotected rates (C) will yield higher estimates for prevention rate. Taken together, our findings suggest that prevention rate may not be the most reliable index for evaluating a cathodic protection system’s ability to prevent corrosion.

Table 1 shows the observed values for prevention rate and prevention effect by region, while Fig. 10 shows cumulative probability distributions for the same. Both indices were very close to 100% on average (rate: 98.2%, effect: 99.7%).

Figure 11 shows changes in these two indices over time. Some variation is visible in prevention rate at the very start of the test period, but this gradually decreases over time. This initial variance was likely influenced by the weak correlation between the unprotected and protected corrosion rates at the very start of the test period; later variance, on the other hand, resulted from deviation between the rates, as C changed while P remained relatively constant. Variation is much less prominent for prevention effect, presumably because its calculation reflects only data recorded in the presence of cathodic protection, meaning it is not influenced by that variability in C. Still, this index does grow more variable over time. Based on (4), given a constant initial mass, we would expect prevention effect to decrease over time as more and more mass is lost to corrosion. Nonetheless, variation in mass loss at the same observation point cannot be attributed to the effects of time alone. Taken together, our findings suggest that prevention effect may not be the most reliable index for evaluating a cathodic protection system’s ability to prevent corrosion.

Figure 12 shows changes in the corrosion rate of protected steel over time. This index gradually falls for the first four years, and then remains consistently low (some variation notwithstanding) from about the fifth year onward. These trends support the notion—noted in section 2—that steel is more susceptible to wastage in the early years of cathodic protection’s application, but grows resistant once a steady state is reached.
Cathodic protection systems are normally applied in port and harbor facilities for more than five years. With this in mind, Fig. 13 shows cumulative probability distributions of the corrosion rates observed for protected steel test pieces monitored for at least five years: separate distributions are given for the complete dataset, and the subset of data recorded five years or more after the start of testing. In the latter, nearly 99% of facilities achieved a protected corrosion rate of 0.01 or less.
4. Protected Corrosion Rate: The Best Index for Evaluating Corrosion in Cathodically Protected Steel
In the sections above, we sought to validate different indices for evaluating the effectiveness of cathodic protection, based on experimental data from both our own test pieces, which exhibited clear changes over time (section 2), and a national survey of similar test-piece data from past experiments (section 3). Our findings led us to conclude that protected corrosion rate—the speed at which steel corrodes in the presence of cathodic protection—is best suited to this purpose, as it can capture temporal effects and requires measurements only to be taken under protected conditions.
However, this index’s reliability is contingent on corrosion-resistant conditions being maintained at the facility in question. This prompted us to verify the relationship between protected corrosion rate and cathodic potential—namely, whether it was enhanced below the benchmark of −800 mV—based on data from past experiments conducted in laboratory settings and real marine environments.
Laboratory tests involved submerging specimens in a tank, and observing how corrosion rate varied in response to the manipulation of cathode potential.6) For the marine experiments, the relationship between cathode potential and corrosion rate was measured starting five years after installation.7) Figure 14 shows the data reported by these two studies. In both datasets, the corrosion rates not only remain below 0.01 mm/y when the cathodic potential is kept below −800 mV, but are even further reduced at lower potentials.
We conclude that corrosion rate is the best index for evaluating the effectiveness of cathodic protection. This should be limited to less than 0.01 mm/y in port and harbor steel structures if the following three conditions are met:
-
① Cathodic potential has been continuously maintained at ≤−800 mV (vs. Ag/AgCl [SW]), with no gaps in protection.
-
② Steel is located in a typical marine environment (i.e. excluding areas with high waves or swell), below the M.L.W.L.
-
③ Cathodic protection system has been properly designed, constructed, and maintained.
Still, this study’s analysis regarded only test piece data; our findings should be corroborated using data from real-world steel structures in ports and harbors.
5. Conclusion
In this study, we compared several indices of the effectiveness of cathodic protection, looking at how they changed over time in data from our own experiments, conducted using steel test pieces at four ports in Japan, and from a national survey of test pieces from similar past experiments. Our conclusions can be summarized as follows.
-
(1)
Prevention rate is calculated based on steel’s corrosion rate under protected and unprotected conditions. We found this index to be highly variable in our analysis of the national survey data, a consequence of high regional variation in unprotected corrosion rate despite minimal changes in protected corrosion rate.
-
(2)
Prevention effect is calculated using only measurements taken under protected conditions, making it less variable than prevention rate since it is not impacted by variation in unprotected corrosion rate. However, since this index is calculated as current mass divided by initial mass, it is mathematically predisposed to fall over time as more and more mass is lost to corrosion.
-
(3)
The behaviours of these two indices suggested that a different measure would be better able to capture the effectiveness of cathodic protection: one that requires only measurements taken under protected conditions, and also reflects temporal effects. Protected corrosion rate was concluded to be the best index for this purpose. It is considered that corrosion rate of steel can be kept around less than 0.01 mm/y in port and harbor structures when the cathodic protection system meets standard design criteria.
REFERENCES
- 1) H.H. Uhlig and R.W. Revie: Corrosion and Corrosion Control, 3rd ed., (Sangyo-Tosho, Tokyo, 1989) pp. 59–61.
- 2) Ministry of Land, Infrastructure, Transport and Tourism, Ports and Ports Bureau: Technical Standards and Commentaries for Port and Port Facilities in Japan. Japan Port Association, (2007) p. 439, p. 441.
- 3) Ministry of Transport, Port and Port Bureau: Design Standards for Port and Port Steel Structures. Japan Port Association, (1970) 2-3-8.
- 4) T. Yamaji, Y. Akira, S. Sato, H. Shiraishi, M. Yoshida, Y. Hunayama and M. Abe: Bousei-Kanri 52 (2008) 41–44.
- 5) Coastal Development Institute of Technology: Corrosion Protection and Repair Manual for Port and Port Steel Structures. Coastal Development Institute of Technology, (2009) p. 198.
- 6) N. Mochizuki: Corrosion protection potential of mild steel in artificial bodies of seawater. Internal Report of Nakabohtec, (1974).
- 7) Ministry of Construction Public Works Research Institute: Joint research report on cathodic protection in civil structures in marine areas, (1991) pp. 6–7.