Abstract
The temperature dependence of the fatigue crack propagation rate in stage IIb in bimodal Ti–6Al–4V was investigated at different stress ratios R. Fatigue tests were conducted between room temperature and 550 K at R of 0.1, 0.7, 0.8, and 0.9, and two phenomena were elucidated consequently. First, the fatigue crack growth rates were nearly temperature independent for R = 0.1, 0.7, and 0.8 while it is temperature dependent at R = 0.9. This difference in the temperature dependence can be explained by the assumptions that the fatigue crack growth is controlled by the dislocation activities associated with work-hardening for R ≤ 0.8 while it is controlled by dislocation glide at R = 0.9. Second, the fatigue crack growth rates at R = 0.9 was higher than those at R = 0.1, 0.7, and 0.8. This increase in the fatigue crack growth rate at R = 0.9 can be explained by the change in the stress intensity factor of crack opening. Both the controlling mechanisms emanated from the change in the dislocation structure in front of the crack tip.

1. Introduction
The pervasive usage of titanium alloys has been expanded in the wide range of applications over the past several decades, among which aerospace applications are relatively preeminent. Titanium alloys are often exposed to cyclic loads during such applications. Fatigue failures have been persistently encountered in aero-components since the first catastrophic failure of comet airplanes in the 1950s.1,2)
The crack growth under cyclic loading can be divided into three stages: crack initiation (stage I), stable crack propagation (stage II), and catastrophic crack propagation until failure (stage III), among which stage I and stage II determine the lifetime of a component. Generally, stage II, i.e., stable crack propagation, occupies most of the lifetime for a component with a small notch. Thus, the crack propagation regime (stage II) is essential to investigate, beyond which catastrophic failure occurs without any prior indication. Stage II can be further divided into stage IIa and stage IIb. The main crack is microstructure-sensitive in stage IIa that frequently deviates concerning the effects of crystallographic orientation such as the geometry of slip systems, young’s modulus, and constraint at grain boundaries, and so on; afterward, the crack grows stably in stage IIb. Many circumstantial and mutually competitive mechanisms strongly affect fatigue crack growth (FCG) rates, including the applied load, microstructure, alloy composition, atmosphere, and temperature. Fatigue crack propagation is a complex phenomenon that is not yet fully understood, although many studies3–8) have been dedicated to understanding the mechanism behind metal fatigue since it was first observed in 1829.9,10)
The fatigue propagation threshold in Ti–6Al–4V was first measured by Marci et al.11) Afterwards, several variables affecting the fatigue threshold were determined, including the stress ratio R (= Kmax/Kmin, where Kmax and Kmin are the maximum and minimum of the applied stress intensity factor, respectively), crack closure, and short fatigue cracks. It has been established that the contribution of R to the change in the threshold stress intensity range is a crucial parameter determining crack growth characteristics. As R increases, the threshold stress intensity range decreases up to a certain value of the critical stress ratio. The threshold stress intensity range also increases with temperature although it is stabilised at higher stress ratios of R > 0.9.12–14) Furthermore, crack closure also remarkably affects the FCG rate in the lower R range. It has also been reported that the FCG rate of short cracks is faster than that of long cracks due to larger local effective driving force.8,15–21) However, it is difficult to compare the results of each material with different microstructure attributed by the different pre-processing histories. Thus, the fundamental theory behind fatigue should be adapted for further understanding in such cases. Moreover, the theory behind the evolution of the temperature dependence of the FCG by considering several effects is not yet clearly understood, especially in bimodal Ti–6Al–4V. Hence, the current study mainly focuses on understanding the temperature dependence of the FCG with different stress ratios by critiquing several aspects that can appreciably affect the FCG.
2. Experimental Procedure
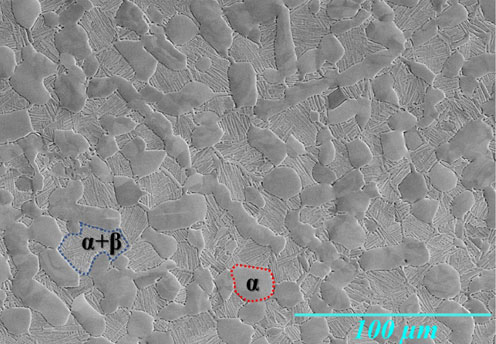
The material investigated was a titanium alloy with a composition of 6.04% aluminium, 4.16% vanadium, 0.22% iron, 0.16% oxygen (mass%) along with some impurities. Initially, a forged Ti–6Al–4V billet was solution heat-treated at 1213 K for 7.2 ks, then normalised at 978 K for 10.8 ks. The outcome of this pre-processing history was a bimodal microstructure consisting of primary α grains and lamellar colonies of secondary α and β phases (α + β), as shown in Fig. 1. The average grain size of the designated alloy was 8 µm. The volume fraction of the α phase was 97%, whereas the β phase occupied 3%.22,23) The yield stress of the Ti–6Al–4V alloy at room temperature (≈ 300 K) was observed to be 874 MPa. Detailed analysis of the mechanical properties and their controlling mechanisms under uniform loads were reported in previous works.22,23)
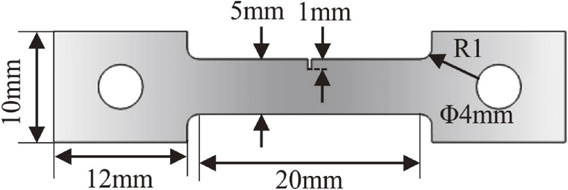
An in-situ high-temperature testing machine (Yonekura, CATY-T3H, Japan) equipped with a high vacuum was used to perform the fatigue tests. A rotary pump and turbo molecular pump were used to create the high vacuum. The oxygen partial pressure during the fatigue test was approximately 10 Pa. Corner-notched specimens were prepared for the fatigue tests with dimensions of 46 mm × 10 mm × 1 mm (length × width × thickness), as shown in Fig. 2, using an electric discharge machine (Mitsubishi Electronic, MV1200R, Japan). The specimens were fine-polished using a 9:1 ratio of modified colloidal silica (particle size: 0.05 µm) and hydrogen peroxide. Fatigue tests were performed in the temperature range between room temperature and 550 K at stress ratios (R) of 0.1, 0.7, 0.8, and 0.9 under a strain rate of 1.67 × 10⁻² s−1, where the loading function was in triangle form. The fracture surfaces and crack wakes of each specimen were examined using scanning electron microscopy.
3. Results
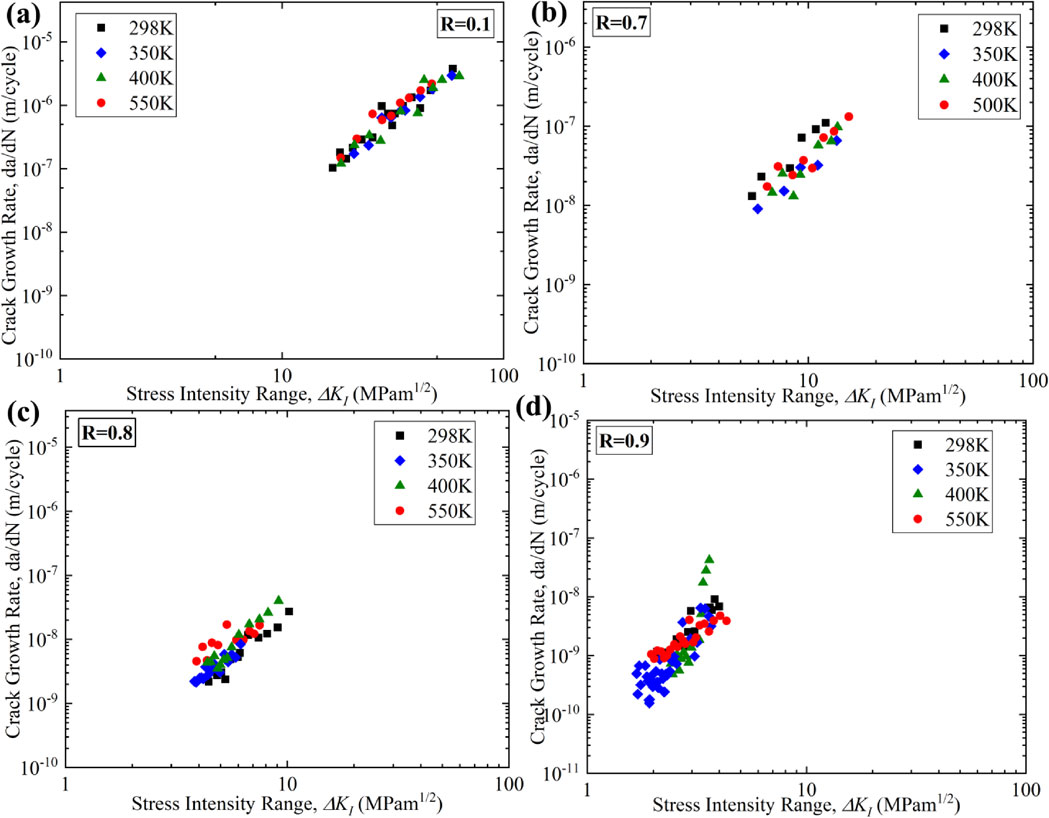
Figures 3(a)–(d) show the FCG rates at several temperatures at R = 0.1, 0.7, 0.8, and 0.9, respectively. In stage IIb of $\log \frac{da}{dN}$ vs. log ΔKI, there exist a linear relationship at a given temperature known as the Paris law:24)
| \begin{equation}
\frac{da}{dN} = C (\Delta K_{I})^{n},
\end{equation}
| (1) |
where
a is the crack length,
N is the number of cycles,
C and
n are constants depending on the material, and Δ
KI is the applied stress intensity range for mode I crack. As indicated by the Paris law,
da/
dN is exponentially proportional to Δ
KI. The value of
n in
eq. (1) was 2.7 for the specimen fatigued at 298 K and R = 0.1.
Figure 4 shows a fracture surface fatigued at 298 K and
R = 0.1, revealing typical fatigue striations on the fracture surface. The average striation spacing at the region corresponding to Δ
KI = 36.4 MPam
1/2 was observed to be 1.1 × 10
−6 m, which is in good agreement with
da/
dN from the specimen with
R = 0.1, as observed in
Fig. 3(a).
Figure 3 indicates that
da/
dN for
R = 0.1, 0.7, 0.8 were nearly temperature-independent, whereas that for
R = 0.9 was strongly temperature dependent.

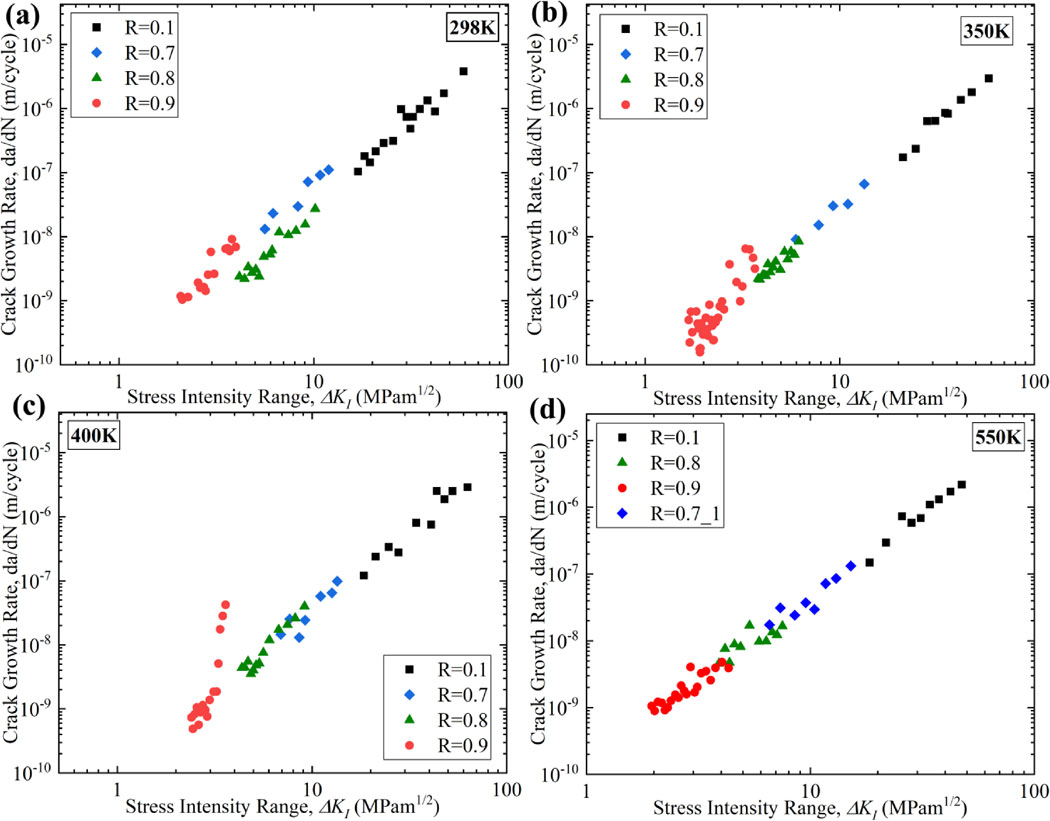
In order to elucidate the origin of the temperature dependence of da/dN, da/dN were replotted at given temperatures associated with different stress ratios. Figures 5(a)–(c) show that the crack growth rates at R = 0.9 were higher than that for the other values of R at the same ΔKI. Thus, if the FCG rate is controlled by stress-controlled deformation at the crack tip, the FCG rates should lie on one line at a given temperature. Figure 5 indicates that the da/dN at 550 K with any stress ratio lies on one line concerning ΔKI. At other temperatures, the results from R = 0.1, 0.7, and 0.8 lies nearly on one line, whereas the results from R = 0.9 are an exception. These results suggest that the FCG rates in the case of R = 0.1, 0.7, and 0.8 at 298 K, 350 K, 400 K, and 550 K, in addition to the case of R = 0.9 at 550 K, are stress-controlled deformation.
4. Discussion
One of the major considerations behind the fatigue crack propagation at different stress ratios or temperatures will be discussed in this section. Because the FCG is related to the emission of dislocations at the crack tip,25) da/dN must correlate to the dislocation activities at the crack tip. Here, it is reasonable to consider that the FCG rate is controlled by dislocation emission at the crack tip. If a thermally activated process controls the dislocation emission, the FCG rate should also exhibit temperature dependence. Figures 3 and 5 demonstrate that the FCG rates were temperature independent at R = 0.1, 0.7, 0.8, excluding R = 0.9 which exhibited significant temperature dependence. This finding suggests that the dislocation emission at the crack tip should be controlled by a certain thermally activated process exclusively in the case of R = 0.9. It can also be remarked that the FCG with R = 0.1, 0.7, 0.8 is not controlled by a thermally activated process even though dislocation emissions control the propagation of the crack itself. Therefore, the change in the controlling mechanism will be discussed. First, the reasoning for the temperature independence of FCG rates at R = 0.1, 0.7, 0.8 will be discussed.
4.1 Temperature independence of FCG rates with R = 0.1, 0.7, and 0.8
The fact that the FCG rate is situated on one line (Fig. 5) indicates that the FCG is controlled by the stress in front of the crack, where the FCG rate increases as the stress intensity range increases. In such cases, the controlling process of dislocation emission from the crack is presumed to be a change in dislocation structure in front of the crack tip. It is expected that the dislocation microstructures of fatigue should be developed in front of the crack tip before the fatigue crack propagates during the cyclic deformation, which is different from the uniform deformation in the specimen under monotonic tensile loads.
The dislocation structure developed in front of the crack suppresses the dislocation emission from the crack tip owing to the dislocation shielding. Here, the stress intensity factor for dislocation emissions at a mode I crack is written as26)
| \begin{equation}
k_{Ie} = \frac{\mu}{\sqrt{2\pi r_{c}}}\cfrac{b_{s}^{2} + b_{e}^{2} (1 - \nu)^{2}}{b_{e}\,\mathit{sin}\,\theta\,\mathit{cos}\cfrac{\theta}{2}} - \sum k_{d},
\end{equation}
| (2) |
where
bs and
be are the screw and edge components of the Burgers vector, respectively; μ and ν are the shear modulus and Poisson’s ratio, respectively; r
c and θ are the crack core size and the angle between the crack plane and slip plane, respectively; and
kd is a local stress intensity factor due to dislocations with
kd < 0. The absolute value of
$\sum k_{d}$ depends on the number of dislocations and the positions of the dislocations at the crack tip.
kIe should change every cycle, reflecting the number of dislocations and the dislocation microstructure in front of the crack tip. When dislocations are emitted from the crack tip, ΔK should increase because the fatigue crack length becomes longer, proportional to the number of emitted dislocations. Supposing a cycle in fatigue test, in order to propagate the crack in the next cycle, the increase in ΔKI and |ΔkIe| for the succeeding cycle should be
| \begin{equation}
\Delta (\Delta K_{I}) > |\Delta k_{Ie}|.
\end{equation}
| (3) |
When the dislocations are emitted from the crack tip, ΔKI increases because of the increase in the crack length. When ΔKI increases, the number of dislocations emitted from the crack should increase because of the higher stress intensification at the crack tip. Then, |ΔkIe| should be increased with the number of dislocations in front of the crack tip. Therefore, the number of dislocations emitted from the crack tip, which is da/dN, is affected by the dislocation microstructure in front of the crack tip.
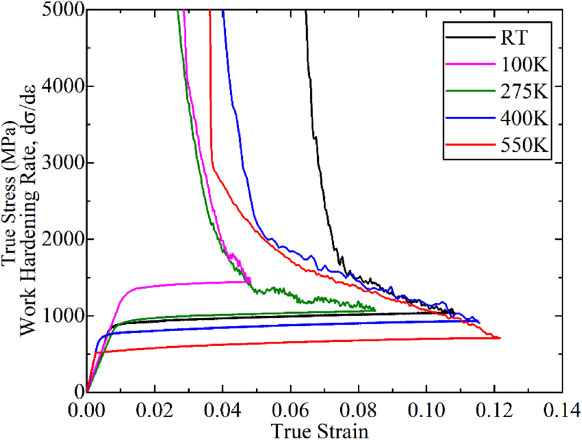
One of the metallurgical parameters that affect the dislocation microstructure is the recovery of dislocations in a deformed specimen. It suggests that the dislocation activities which control the temperature-independent-FCG are closely relating to work-hardening than to yielding. Actually, the temperature dependence of the work-hardening rate is much weaker than that of the yield stress in the employed bimodal Ti–6Al–4V. Figure 6 shows the true stress-strain curves and $\frac{\partial \sigma }{\partial \varepsilon }$ obtained from the tensile tests at 100 K, 275 K, RT, 400 K, and 500 K. The abrupt drops of the work-hardening rate in each stress-strain curve result from the elasto-plastic deformation just after yielding. Ignoring the elasto-plastic region, the slopes of $\frac{\partial \sigma }{\partial \varepsilon }$ are nearly the same regardless of the temperature of deformation. In particular, those obtained at RT, 400 K, and 500 K are similar. This finding supports the assumption that the dislocation activities relating to the work-hardening controls the FCG rate, which is temperature independent in the case of R = 0.1, 0.7, and 0.8. Although the work-hardening in the monotonic deformation and the cyclic deformation is not exactly the same, the controlling process of work-hardening should be the similar between them such as cross-slipping of dislocations, recovery and so on. Xu et. Al27) investigated the cyclic hardening and softening response in bimodal Ti–6Al–4V at room temperature with the stress ratio of −1, corresponding to low cycle fatigue. It was found that the dislocations cross slip at higher strain amplitudes while they lie along continuous parallel slip lines in the case of lower strain amplitudes. Also, few studies indicated that prismatic slips are dominant under cyclic loading in bimodal Ti based alloys including Ti–6Al–4V along with cross slip from prismatic planes to pyramidal planes.27–29)
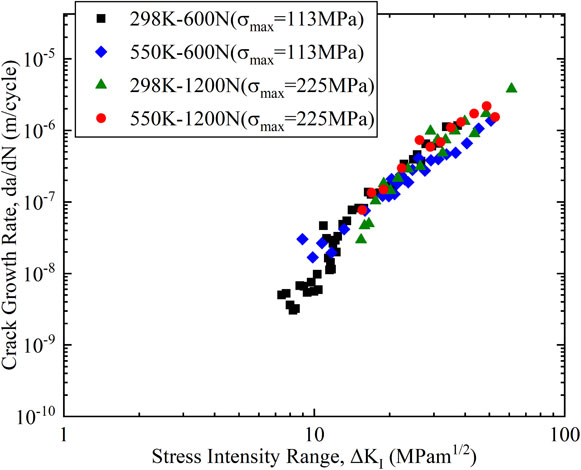
Here, FCG rates are discussed concerning Kmax which is rate-sensitive according to the two-driving force theory or two-parameter equation proposed by Ding et al.12) They proposed a two-parameter equation to estimate the FCG rates using Kmax which is strongly influenced by the temperature at higher stress ratios as the temperature increases. FCG rates increased quickly at higher stress ratios compared to that of lower stress ratios at high temperatures. They suggested that the influence of Kmax on the FCG might be originated from the effect of temperature at higher stress ratios. Present study also evidenced the temperature dependence at higher stress ratios. However, there was no temperature dependence at lower stress ratios and the FCP mechanism was suspected to be stress-controlled mechanism as mentioned earlier. Thus, da/dN curves at different applied stress levels (with different Kmax) were constructed to confirm the stress-controlled fatigue crack growth, as shown in Fig. 7. Specimens were fatigued at two temperatures and two maximum stress levels by maintaining a stress ratio of 0.1. σmax was set to be 113 and 225 MPa. The FCG rates were situated on the same line irrespective of the Kmax value. The slope and the trend of the FCG rates at both Kmax levels were identical. This finding confirms that the FCG is stress-controlled for R ≤ 0.8. The assumption that the FCG is controlled by dislocation activities relating to work-hardening also explains why the da/dN from the specimen with R = 0.9 at 550 K is on the same line as the results from the specimens with R = 0.1, 0.7, and 0.8 at 550 K. The results indicate that the da/dN from the specimen R = 0.9 at 550 K is also a stress-controlled propagation.
The FCG rates in the case of R = 0.9 will be discussed in this section. There are two points to discuss here: validation of the temperature dependence of da/dN in the specimens fatigued at R = 0.9 and substantiation of the faster da/dN in the specimens fatigued at R = 0.9 relative to that in the specimens cyclically deformed at other values of R except at 550 K. The existence of the temperature dependence in the specimen with R = 0.9 will be discussed first.
From the experimental results, it is apparent that there is a temperature dependence of the FCG rate at R = 0.9, which indicates that the controlling mechanism is an inevitable thermally activated process. In such a case, the FCG rate should be represented by an Arrhenius type equation at constant stress (or constant ΔKI):30)
| \begin{equation}
\frac{da}{dN} = A\exp \left( \frac{-\Delta H}{kT} \right),
\end{equation}
| (4) |
where
A is a constant,
k is the Boltzmann constant,
T is the absolute temperature, and Δ
H is the activation enthalpy for the rate-controlling process of the FCG rate. The dislocation velocity,
v, is given by the activation enthalpy for dislocation glide, Δ
Hd:
| \begin{equation}
v = v_{o}\exp \left( \frac{-\Delta H_{d}}{kT}\right),
\end{equation}
| (5) |
where
vo is a constant.
Equations (4) and
(5) indicate that the
da/
dN increases with temperature with increasing dislocation velocity when
da/
dN is controlled by dislocation glide, i.e. Δ
H = Δ
Hd.
One of the significant differences in the FCG rates for different values of R is the amount of reverse deformation during unloading. A large amount of inverse deformation must be induced at the crack tip during unloading for small R, such as R = 0.1, in order to close the crack tip. In contrast, the amount of the reverse deformation is weakened at large R, such as R = 0.9. This suggests that the microstructures should not be identical at the crack tips for specimens with different values of R, i.e., augmented accommodation or annihilation of dislocations during unloading at small R. In contrast, the significant accommodation of dislocations is not essential at large R.
The annihilation of dislocation is not greatly pronounced at the crack tip or close to the uniform deformation at higher R, where the dislocation activity is considered to be almost similar to the dislocation activity just after yielding. Therefore, it is presumed that the dislocation gliding controls the FCG rate at the crack tip, with the fact of the existing temperature dependence in the specimens deformed at R = 0.9. Additionally, the increase in FCG rates with temperature, as shown in Fig. 5, can be explained by the assumption that the dislocation velocity increases with temperature, which leads to an increase in da/dN, as expected, according to eqs. (4) and (5).
Figures 8(a) and (c) show the dislocation microstructures in front of the crack tip those observed at the lowest and highest R (i.e., R = 0.1 and R = 0.9, respectively) at a crack length of 1.45 mm and 298 K. Figure 8(b) shows the dislocations forming a cell structure in the case of R = 0.1, which is a typical fatigue microstructure developed at the crack tip with a large number of dislocations. On the other hand, Fig. 8(d) shows sharp slip bands, and some dislocation lines are even distinguishable. The dislocation density is much lower than that in the specimen with R = 0.1. It is to be noted that the change in dislocation microstructure should influence the magnitude of crack shielding due to dislocations, resulting in the change in the crack closure among the specimens tested with R = 0.9 and 0.1. This would influence the change in temperature dependence of FCP. In addition to that, the change in dislocation microstructure with increasing R is also crucial point. The details need further experiments as future work.

5. Conclusions
The effect of the stress ratio, R, on the temperature dependence of fatigue crack propagation was investigated in bimodal Ti–6Al–4V, and the following results were obtained.
-
(1)
The fatigue crack growth rates were nearly temperature independent in case of R = 0.1, 0.7, and 0.8 while they are temperature dependent at R = 0.9.
-
(2)
The fatigue crack growth rates in the specimens deformed at R = 0.9 were higher than that for the specimens deformed at R = 0.1, 0.7, and 0.8.
-
(3)
ECCI images demonstrate that the dislocation microstructure at the crack tip in the specimen deformed at R = 0.9 was closer to the dislocation microstructure in monotonic deformation.
-
(4)
The dislocation microstructure in the specimen tested with R = 0.9 is different from that with R = 0.1. The difference of microstructure would be relating to the difference in temperature dependence of fatigue crack propagation.
Acknowledgments
This work is partly supported by a Grant-in-Aid for Scientific Research (B) (JSPS KAKENHI: JP19H02462) and the Elements Strategy Initiative for Structural Materials (ESISM) of MEXT (grant number JPMXP0112101000).
REFERENCES
- 1) D.D. Dempster: Technol. Cult. 2 (1961) 291–293.
- 2) H. Petroski: Invention by Design: How Engineers Get from Thought to Thing, (Cambridge, Harvard University Press, London, 1996).
- 3) C. Laird and G. Smith: Philos. Mag. 7 (1962) 847–857.
- 4) B. Tomkins: Philos. Mag. A: J. Theor. Exp. Appl. Phys. 18 (1968) 1041–1066.
- 5) T. Goswami: Mater. Des. 24 (2003) 423–433.
- 6) J. Lankford and D. Davidson: Advances in Fracture Research 2, ed. by D. Franccois, (Pergamon Press, Oxford, 1982) pp. 899–906.
- 7) M. Peters, A. Gysler and G. Lütjering: Titanium Science and Technology’80, ed. by H. Kimura and O. Izumi, (TMS-AIME, 1980) pp. 1777–1786.
- 8) J. Petit, W. Berata and B. Bouchet: Scr. Metall. Mater. 26 (1992) 1889–1894.
- 9) W.A. Albert: Arch. Für Mineral. Geognosie Bergbau Und Hüttenkd. 10 (1838) 215–234.
- 10) S. Suresh: Fatigue of Materials, (Cambridge University Press, UK, 1998).
- 11) G. Marci, D. Castro and V. Bachmann: J. Test. Eval. 17 (1989) 28–39.
- 12) J. Ding, R. Hall and J. Byrne: Int. J. Fatigue 27 (2005) 1551–1558.
- 13) B.L. Boyce and R.O. Ritchie: Eng. Fract. Mech. 68 (2001) 129–147.
- 14) X. Liu, C. Sun and Y. Hong: Mater. Sci. Eng. A 622 (2015) 228–235.
- 15) D. Neal and P. Blenkinsop: Acta Metall. 24 (1976) 59–63.
- 16) R.O. Ritchie, D. Davidson, B. Boyce, J. Campbell and O. Roder: Fatigue Fract. Eng. Mater. Struct. 22 (1999) 621–631.
- 17) B. Oberwinkler: Mater. Sci. Eng. A 528 (2011) 5983–5992.
- 18) N. Arakere, T. Goswami, J. Krohn and N. Ramachandran: High Temp. Mater. Process. 21 (2002) 229–235.
- 19) J. Newman: Technical Note: An Improved Method of Collocation for the Stress Analysis of Cracked Plates with Various Shaped Boundaries, (NASA, Washington, 1971).
- 20) N. Dowling: Fatigue Eng. Mater. Struct. 2 (1979) 129–138.
- 21) S. Suresh: Metall. Trans. A 16 (1985) 249–260.
- 22) B.R. Anne, M. Tanaka and T. Morikawa: Mater. Trans. 60 (2019) 1828–1832.
- 23) B.R. Anne, Y. Okuyama, T. Morikawa and M. Tanaka: Mater. Sci. Eng. A 798 (2020) 140211.
- 24) P. Paris and F. Erdogan: J. Basic Eng. 85 (1963) 528–533.
- 25) R. Lardner: Philos. Mag. 17 (1968) 71–82.
- 26) R. Thomson: Solid State Physics, (Academic Press, Orlando, 1986).
- 27) H. Xu, D. Ye and L. Mei: Mater. Sci. Eng. A 700 (2017) 530–539.
- 28) J. Huang, Z. Wang and K. Xue: Mater. Sci. Eng. A 528 (2011) 8723–8732.
- 29) X. Feaugas and M. Clavel: Acta Mater. 45 (1997) 2685–2701.
- 30) M. Tanaka, A. Fuji, H. Noguchi and K. Higashida: Philos. Mag. Lett. 94 (2014) 95–102.