Abstract
In this paper, cold-rolled DP590 dual-phase steel sheets with 1.5 mm thickness were weld-bonded by a fiber laser. In order to study the tensile shear strength of laser spot-welding and laser weld-bonding joints, the orthogonal test was designed with three parameters: welding power, welding time and off-focus value. The tensile shear test and the fatigue test were carried out. The vaporization of the adhesive and its disruption to the molten pool during the weld-bonding process were simulated. The results show that the tensile and fatigue strength of the laser weld-bonding joints are higher than the laser spot-welding joints. Simulation results demonstrate that the perforation is caused by the gas produced by the gasified adhesive being discharged from the center of the molten pool under high pressure.
1. Introduction
In recent years, high attention has been paid to reduce fuel consumption and gas emission. Automobiles, as one of the major sources of energy consumption and exhaust emissions, are also in urgent need of improvement. Lightweight has become a hot spot in auto development.
As a typical high-strength steel, dual-phase steel, which has excellent forming performance and high processing hardening rate, has been widely used in auto-manufacturing.1–4) The weld-bonding, which has the characteristics of the adhesive bonding and the spot-welding, is a kind of composite connection technology. The application of non-conductive adhesive has a great impact on the resistance spot weld-bonding process, which also limits the promotion and application of the resistance spot weld-bonding.5,6) The laser spot weld-bonding can not only avoid the influence of non-conductive adhesive, but also reduce the stress concentration and improve the mechanical properties of the joint compared with the resistance spot weld-bonding.7) Scholars have researched the microstructure and mechanical properties of the laser spot weld-bonding joints. J. A. Khan et al.8) presented a thermal–electrical–mechanical model to investigate growth process of the nugget, the results showed that the size of computed nuggets agreed well with the experiment. A. De et al.9) reported a heat flow finite element model of laser spot-welding process, the results showed that the keyhole mode was stimulated using either a high laser power and low on-time or a low laser power and high on-time. Tao et al.10) discussed the effect of adhesive on the process of laser spot weld-bonding. It is found that the higher the viscosity of the adhesive, the harder to discharge the gas. In the work of Liu and Ren,11) they found that the adhesive-induced gas would reduce the energy required to penetrate the upper sheet so that higher laser power density could interact with the lower sheet, leading to deeper penetration. Zhou et al.12,13) investigated the microstructure and mechanical properties of laser spot weld-bonding joints of DP590 dual-phase steel to aluminum alloy, the results pointed out that welding defects could be avoided, welding penetration depth and width increased compared with those of laser welding. Farabi et al.14) found that the soften zone formed in the laser welding process had a greater effect on the laser welding joints of DP980 compared with DP600. Hence, the fatigue performance of the laser welding joint of DP600 is better than that of DP980. Xie et al.15) found that the fatigue source of joints generated in the welding zone at first and expanded along the martensite, forming a large number of fatigue striations. Kim et al.16) researched the weldability of the Al 6061-T6 thin plate, through varying the power, the focus position and the welding power of the laser, the static performance of the joint was improved. Till now scholars mainly studied the microstructure, the static and fatigue properties of laser spot-welding joints for dual-phase steel, while comparison of the fatigue properties between laser spot weld-bonding and laser spot-welding joints and the perforation mechanism of laser spot weld-bonding joints for DP590 are barely found.
In this study, to investigate the static and fatigue properties of laser spot-welding and laser spot weld-bonding joints, an orthogonal experiment was designed. The perforation mechanism of laser spot weld-bonding joints was analyzed by the Euler-Lagrange calculation method.
2. Experimental Procedure
2.1 Experiment materials and methods
The material employed in the test was DP590 steel sheet with a size of 110 mm × 20 mm × 1.5 mm. The chemical composition is listed in Table 1.

Table 1 Chemical composition of DP590 (%).
The welding power, welding time and off-focus value were chosen as the variables, and the orthogonal test with three factors and three levels were carried out, the scheme is shown in Table 2. The welding equipment used in the experiment was the YLG-6000 Fiber laser welding machine. The epoxy resin adhesive (DP460) was employed in the test. The configuration of spot-welding and weld-bonding joints is shown in Fig. 1. To eliminate accidental errors, six experiments were performed for each group.

Table 2 Orthogonal array and the results.
Before welding, oxide film on the surface was removed with sandpaper, and then the surface was cleaned with acetone and ethanol. After the welding, the weld-bonding specimens were cured for 24 h. High-purity argon gas was supplied to the top surface of the specimens.
The tensile shear test was carried out in MTS servo-hydraulic test machine at the speed of 2 mm/min to get the failure load of laser spot-welding and weld-bonding joints. Following the results of tensile shear tests, six loading levels were set to perform fatigue tests with a sine wave at a frequency of 10 Hz and a stress ratio of 0.1. Failure was defined as complete separation of the specimens. If the specimen is not separated, the test will be stopped after a loading of 106 cycles.
2.2 Model establishment
In the process of laser spot weld-bonding, part of the adhesive will be vaporized due to the high temperature generated by the laser. When the curing time of the adhesive is too long before welding or a large force is applied on the specimens during welding, it is difficult for the gas generated to vent from the gap between the plates. Hence, the gas will rush out from the molten pool, and it may cause the occurrence of perforation, which will weaken the static and fatigue properties of weld-bonding joints.
By the laser radiation on the specimen, the adhesive layer was vaporized and the metal was molten. The air mass with high-pressure and high-temperature was formed instantly near the weld nugget. The process of the gas discharging from the joint, especially from the molten pool, was simulated, and the temperature and pressure of the air mass was calculated through the gas state equation and the heat input.17)
In the paper, the welding parameters of the joint with perforation are 1800 w (laser power), 1200 ms (welding time) and −3 mm (off-focus value). Through calculation, values of the parameters are ensured. The pressure and temperature of the air mass are set as 0.4 MPa and 1000°C, respectively.
A symmetric mesh model was set up using the ANASYS AUTODYN code. The model is composed of four parts and the detailed information is given in Table 3. The model established is presented in Fig. 2. Four detection points were set to analyze the perforation mechanism. The first point was on the edge of the nugget. The other three points were on a straight line, the second point was at the position of the air mass formed in the molten pool after the adhesive layer was gasified, the third point is at the center of the junction between the weld nugget and the plate, and the fourth point is on the adhesive layer between the two plates.

Table 3 Material parameters.
The Euler-Lagrange calculation method was used to analyze the perforation which appears in the welding process. The viscosity attenuation coefficient was set as 100/s, corresponding to high viscosity. The minimum mesh was 0.1 mm, the whole length of the Euler was 20 mm and the height was 10 mm. The parameters of the material model are shown in Table 3, and the model is shown in Fig. 2.
3. Results and Discussions
3.1 Static strength analysis
Mechanical properties of the laser spot-welding and weld-bonding joints were evaluated through tensile-shear tests. The peak load, the failure displacement and the energy absorption value are critical mechanical properties of spot welding and weld-bonding joints, as shown in Table 4. When the welding power, the welding time and off-focus value is 1800 W, 1000 ms and −3 mm respectively, the failure load of the weld-bonding joint is largest. As shown in Table 4, under the same process parameters, the peak load, the failure displacement and the energy absorption value of the weld-bonding joints are all higher than the spot-welding joints. Hence, the mechanical properties of the weld-bonding are better than the spot welding due to the addition of adhesive.
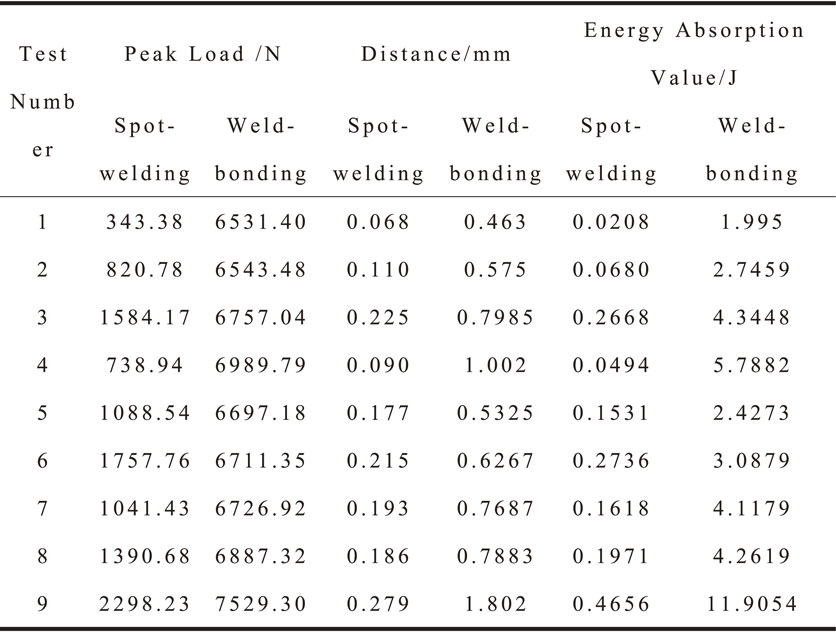
Table 4 The results of the tensile-shear test.
The fatigue performance of two kinds of joints was investigated. For laser spot-welding joints, welding parameters of the ninth group with the failure load of 2298.23 N were chosen to prepare the specimen, and the loading levels of 32%, 35%, 45%, 55%, 60%, 65% were applied to perform the fatigue test against the failure load of the ninth group; for laser spot weld-bonding joints, welding parameters of the third group with the peak load of 6757.04 N were used to make the specimen, and the loading levels were set as 29%, 30%, 35%, 36%, 37%, 40% against the peak load of the third group. The relationship between the applied load and the fatigue life of the specimen is usually demonstrated by the F–N curve. Using the logarithm of the maximum load at each load level as the ordinate and the logarithm of the number of cycles as the abscissa, the load life curve is fitted by the least squares method, and the fatigue curves of spot-welding joints and weld-bonding joints are obtained, as shown in Fig. 3.

The fitting equation of the laser spot welding joint is:
| \begin{equation}
\text{Lg F} = \text{$-$0.14779lgN} + 3.79849
\end{equation}
| (1) |
The fitting equation of the laser spot weld-bonding joint is:
| \begin{equation}
\text{Lg F} = \text{$-$0.08683lgN} + 3.855
\end{equation}
| (2) |
By comparing the F–N curves of the laser spot-welding and weld-bonding joints in Fig. 3, it is apparent that the slope of fatigue curve of weld-bonding joints is smoother than that of spot-welding joints, and the fatigue life of weld-bonding joints is longer than the spot-welding joints. At the same number of cycles, the cyclic load undertook by the weld-bonding joints is higher than the spot-welding joints. The reason is that there is stress concentration at the nugget edge of the spot-welding joint. Under a higher load level, cracks are more likely to appear in the spot-welding joint and spread faster. While the stress distribution of the weld-bonding joint is relatively uniform, and adhesive layer can bear part of the load so that it is difficult for the cracks to generate and spread in the weld-bonding joints. Hence, the fatigue properties of weld-bonding joints are better than spot-welding joints.
3.3 Simulation analysis
The surface morphology of the laser spot weld-bonding joints is shown in Fig. 4 ((a) sixth group; (b) third group; (c) laser power: 1800 w; welding time: 1200 ms; off-focus value: −3 mm). The perforation of the molten pool at different time points in the simulation is shown in Fig. 5, and the time history curves of the pressure for the four points mentioned above are acquired, as shown in Fig. 6.

The adhesive between the two plates begins to gasify at 0.2 ms, as shown in Fig. 5(b). From 0.4 to 0.6 ms, the gas generated by the vaporized adhesive slowly flows to the molten pool due to lacking of path to vent from the two plates. From 0.8 to 1 ms, pressure inside the molten pool increases with the gathering of the gas. Finally, the gas rushes out from the molten pool, which leads to the perforation defects. The simulation process represents the formation process of perforation in the case where the viscosity of the adhesive is large, and the result agrees well with the perforation defect that appears when the curing time is too long or the force applied on the two plates is large.
The first point is under pressure during the entire welding process, and as the gas cavity in the molten pool increases, the pressure on the first point gradually decreases. At 0.8 ms, most of the liquid metal in the molten pool has been discharged, the pressure suddenly increases. The high-pressure gas around the second point has been acting outwards, exerting pressure on the liquid metal, and forming a cavity inside the molten pool. At 0.8 ms, the cavity inside contacts the outside and the cavity disappears, so the pressure suddenly increases. The third point is under pressure in the whole welding process because it is located on the way for high-pressure gas to be discharged outward. The fourth point was initially impacted by high-pressure gas, but has not been subjected to pressure afterwards, indicating that the gas was discharged from the molten pool and eventually formed a perforation defect.
4. Conclusions
In this paper, the mechanical properties of laser spot-welding and weld-bonding joints were conducted, the numerical simulation of spot weld-bonding joints was presented. The conclusions are as follows:
-
(1)
The maximum failure loads of the laser spot-welding and the laser spot weld-bonding joints are 2298.233 N and 7529.304 N, respectively. The addition of adhesive layer greatly improves the shear resistance of the laser spot weld-bonding joint.
-
(2)
The fatigue tests demonstrate that the fatigue property of the laser spot weld-bonding joints is much better than the laser spot-welding joints. The adhesive can effectively improve the fatigue performance of laser spot weld-bonding joints.
-
(3)
The simulation result of the laser spot weld-bonding joint shows that the perforation defect is caused by the gas generated by the gasification of the glue layer being discharged from the center of the molten pool.
Acknowledgments
This study is supported by the National Natural Science Foundation of China (Grant No. 51565022).
REFERENCES
- 1) F. Ozturk, S. Toros and S. Kilic: J. Iron Steel Res. Int. 16 (2009) 41–46.
- 2) X.S. Liao, X.D. Wang, Z.H. Guo, M. Wang, Y.X. Wu and Y.H. Rong: Mater. Charact. 61 (2010) 341–346.
- 3) G. Sorger, T. Sarikka, P. Vilaça and T.G. Santos: Weld. World 62 (2018) 1173–1185.
- 4) G. Avramovic-Cingara, Y. Ososkov, M.K. Jain and D.S. Wilkinson: Mater. Sci. Eng. A 516 (2009) 7–16.
- 5) S.B. Kim, H. Huh, S.H. Park and J.H. Lim: Key Eng. Mater. 340–341 (2007) 255–262.
- 6) S.M. Darwish: Int. J. Adhes. Adhes. 24 (2004) 347–354.
- 7) V.M. Gonçalves and P.A.F. Martins: Int. J. Mech. Mater. Des. 3 (2006) 91–101.
- 8) J.A. Khan, L. Xu and Y.J. Chao: Sci. Technol. Weld. Joining 4 (1999) 201–207.
- 9) A. De, S.K. Maiti, C.A. Walsh and H.K.D.H. Bhadeshia: Sci. Technol. Weld. Joining 8 (2003) 377–384.
- 10) W. Tao, Y.N. Ma, Y.B. Chen, L.Q. Li and M.M. Wang: Int. J. Adhes. Adhes. 51 (2014) 111–116.
- 11) L.M. Liu and D.X. Ren: Opt. Lasers Eng. 48 (2010) 882–887.
- 12) I. Al Zamzami, V. Di Cocco, J.B. Davison, F. Lacoviello and L. Susmel: Weld. World 62 (2018) 1255–1272.
- 13) D.W. Zhou, N.N. Li, S.H. Xu and J.S. Liu: Int. J. Prod. Res. 11 (2016) 209–220.
- 14) N. Farabi, D.L. Chen and Y. Zhou: Procedia Eng. 2 (2010) 835–843.
- 15) C.J. Xie, S.L. Yang, H.B. Liu, Q. Zhang, Y.M. Cao and Y. Wang: J. Mater. Eng. Perform. 26 (2017) 3794–3801.
- 16) Y.G. Kim, M.H. Kim and S.M. Joo: Mater. Trans. 59 (2018) 1446–1451.
- 17) Y.N. Ma: Ph.D. Thesis, Harbin Institute of Technology, China, (2015).


