Abstract
The notch tensile tests of JIS SNCM439 steel were conducted using various notch root radii at room temperature in a 20 MPa high-pressure hydrogen gas atmosphere to investigate the hydrogen embrittlement of the steel specimen at the notch root. The maximum load in hydrogen gas decreased with the increasing stress concentration factor (Kt) as the notch root radius decreased, and the value was reduced compared to that in air at any Kt, beyond which the load abruptly decreased and the specimen broke. Moreover, the local strain value of the notch root at the maximum load point increased with an increase in Kt in air, but that value remained almost constant in hydrogen gas regardless of Kt. Furthermore, the fracture strain observed during the notch tensile test in high-pressure hydrogen gas exceeded the local deformation during the smooth tensile test. In other words, cracks initiation in hydrogen gas were significantly affected by strain value, cracks were generated when voids began to form in the material, and lead to fracture. The specimens in hydrogen gas had quasi-cleavage fracture surfaces with no cracks directly below the notch root. Cracks developed in these fracture surfaces near the center of the specimen, and the propagation of these cracks resulted in the formation of ultimate fracture surfaces with dimples. The quasi-cleavage fracture surface directly under the notch root was considered as the area that yielded before cracking, and the fracture surface accompanied by cracks was considered as the area where the cracks had grown under the effect of high-pressure hydrogen gas. The fracture surface with cracks depended on the load at the time of crack growth, and the percentage of intergranular surfaces increased as the load decreased.
1. Introduction
Hydrogen has received increased attention as a clean energy source, and hydrogen refueling stations for the diffusion of fuel cell vehicles have been constructed in several countries, including Japan.1,2) High-strength low-alloy steels such as SCM435 and SNCM439 are widely used in structures such as high-pressure hydrogen storage tanks for hydrogen refueling stations owing to their attractive properties such as high strength, ease of processing, and low cost. However, these steels are susceptible to hydrogen in a high-pressure gas environment, known as hydrogen embrittlement.3,4) Therefore, it is important to accurately understand the effect of hydrogen on these steels to ensure the safe use of the machinery used in hydrogen refueling stations. Many researchers have investigated the effect of hydrogen on steel in various environments where hydrogen aggressively penetrates steel in a corrosive environment or in a high-temperature, high-pressure gas environment.5,6) These phenomena are well known as stress corrosion cracking or hydrogen attacks. However, in the 1960s, NASA reported hydrogen embrittlement caused by high-pressure hydrogen gas at room temperature, although it was previously thought that steel does not exhibit embrittlement in room-temperature hydrogen gas.7,8) Consequently, tremendous efforts have been devoted to investigating the effects of hydrogen gas on steel at room temperature. Although considerable knowledge has been acquired regarding the impact of high-pressure hydrogen gas on steel, the mechanisms involved in hydrogen embrittlement remain unclear.
Tabata et al. reported that hydrogen enhanced the formation and mobility of dislocation and induced fracture.9) Nagumo et al. proposed the hydrogen-enhanced strain-induced vacancy (HESIV) mechanism, which states that the voids created by plastic deformation are enhanced by hydrogen and promote the fracture.10) The authors operated tensile tests in hydrogen gas using SNCM439 and reported that the effect of hydrogen occurred after local deformation.11) All of these reports indicate that the hydrogen embrittlement of high-strength low-alloy steels is closely related to plastic deformation.
Matsunaga et al. studied the influence of hydrogen on the initiation and propagation of surface cracks by the tensile test in inert gas and hydrogen gas. They shows that the initiation and acceleration of hydrogen-enhanced cracking started after the applied stress reached the tensile strength.12,13) Matsuoka et al. conducted various mechanical tests in hydrogen gas with SCM435 and SNCM439, and showed that they can be used as equipment for high-pressure hydrogen.14) However, since high-strength low-alloy steels are hydrogen-sensitive materials, it is important that a more detailed understanding of hydrogen embrittlement for safe use of hydrogen equipment.
Therefore, in this study, notch tensile tests in hydrogen gas were conducted using test specimens with various notch root radii to limit the plastic deformation location and stress state. In order to clarify the effect of hydrogen on plastic deformation, the dependence of hydrogen on strain and crack propagation will be discussed.
2. Experimental Procedure
2.1 Specimens
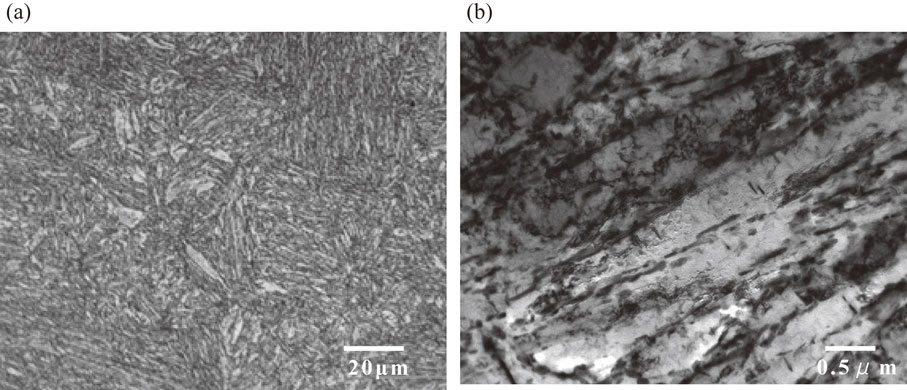
JIS SNCM439 steel was used as the test specimen in the present study. The chemical composition of the test specimens is listed in Table 1. The steel sample was subjected to 50 kg vacuum induction melting, after which the steel was forged into a 20-mm-thick plate, normalized at 1223 K for 3 h, austenitized at 1103 K for 1.5 h, quenched in oil, and then tempered at 823 K for 5 h. The tensile properties of the specimens are listed in Table 2. Figure 1 shows the microscopic microstructures of the test specimens. Figure 1(a) shows the tempered martensitic microstructure by optical microscopy. Figure 1(b) shows the precipitation of elongated carbides between the martensitic laths from a TEM observation.
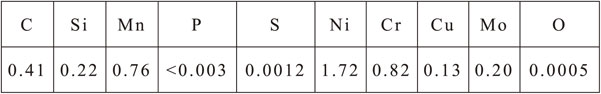
Table 1 Chemical composition of SNCM439 steel.
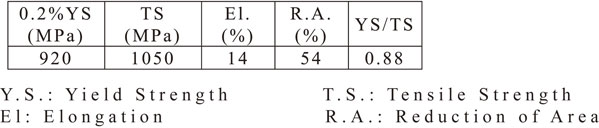
Table 2 Mechanical properties of SNCM439 steels tested in air.
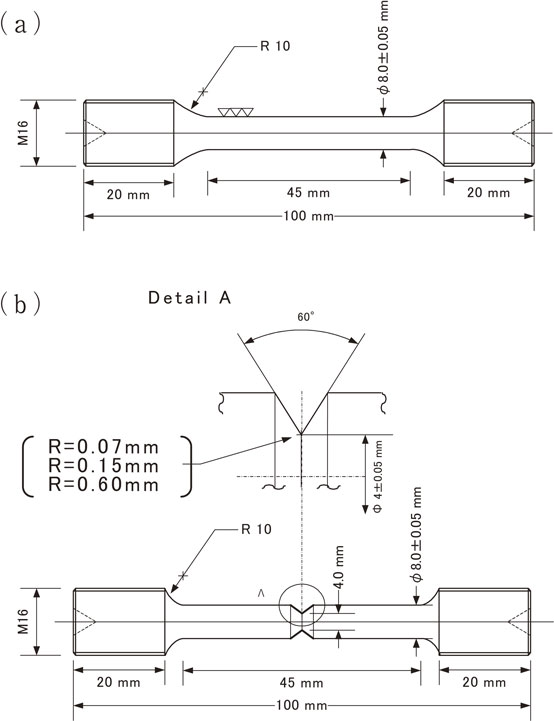
The dimensions of the specimens subjected to smooth tensile testing and notch tensile testing are shown in Fig. 2(a) and 2(b), respectively. The surfaces of the specimens were finished by axial polishing with #800 abrasive paper to a surface roughness (Ra) of ≤0.1 µm. For the notch tensile testing, 2-mm-deep annulated notched grooves with notch root radii (ρ) of 0.07, 0.15, and 0.60 mm were machined in the centers of the specimens. The stress concentration factors (Kt) calculated from Peterson’s charts15) were Kt = 4.6, 3.3, and 1.8, respectively.
2.2 Tensile experimentation method
Slow strain rate tensile (SSRT) tests were performed in air and in 20 MPa of high-purity 7N (99.99999%) hydrogen gas at room temperature (about 293 K) using a crosshead speed of 0.002 mm/s. For the SSRT tests in hydrogen gas, repeated gas substitution and vacuum emission cycles were used to ensure the supply of high-purity gas. The SSRT tests were conducted after the application of approximately 50 MPa preload. After the SSRT tests, the fracture surfaces were observed using a scanning electron microscope (SEM, model JEM-6060, JEOL).
2.3 Finite element analysis
Finite element analysis was conducted on the specimens using the Abaqus 6.11-1 and 1/4 models of the axial cross-sections of the specimens. The minimum number of elements was 1578, and the minimum number of points of contact was 4899. A fine grid was used for the analysis of the notch root cross-sections.
3. Experimental Results
3.1 Smooth tensile test
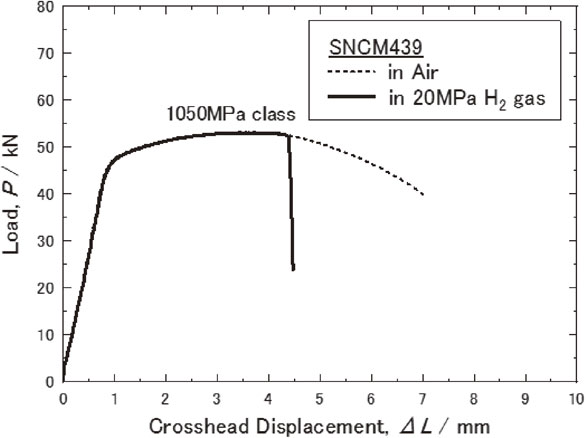
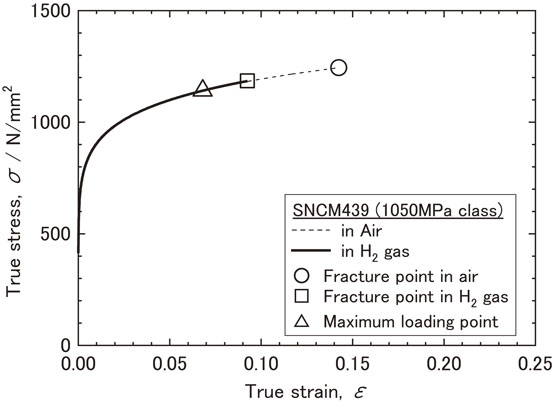
Figure 3 shows the load-stroke displacement curve of the smooth specimens during the SSRT test at room temperature both in air and in hydrogen gas at high pressure (20 MPa). Figure 4 shows the true stress-true strain curve derived from the results of the tensile test using smooth specimens. As shown in Fig. 3, the load-stroke displacement curve of the smooth specimen in hydrogen gas was similar to that in air up to the maximum load point, beyond which the sample tested in hydrogen gas fractured at an earlier stage. The true stress-true strain curve was estimated using the Hollomon strain hardening equation (1) between the yield point to the maximum load point:
| \begin{equation}
\sigma = \text{c} \cdot \varepsilon^{\text{n}}
\end{equation}
| (1) |
where
c and
n are the true stress when the true strain is one and the work hardening exponent, respectively.
The triangle symbol (△) in the curve denotes the maximum load point during the tensile test of the smooth specimens and corresponds to a true stress of 1137 MPa and a true strain of 0.066. The values were similar for both air and hydrogen gas. These values represent the point at which uniform elongation shifts to local deformation, i.e., they represent the values at which voids are generated in the specimen. The square symbol (□) in the curve represents the fracture point of the specimen in hydrogen gas, with a true stress of 1177 MPa and true strain of 0.088. The round symbol (○) in the curve represents the fracture point of the specimen in air, with a true stress of 1244 MPa and a true strain of 0.142.
3.2 Notch tensile testing
Figure 5 shows the load-crosshead displacement curves of the notched specimens at various Kt values in air and hydrogen gas. In air, as Kt increased, the plastic constraint became stronger and the maximum load of the notched sample increased. After showed the maximum load, the load decreased and specimen broke. Whereas in hydrogen gas, the maximum load of the sample decreased with an increase in Kt. In all the specimens evaluated in hydrogen gas, the load dropped rapidly and fractured after showed the maximum load. For all Kt values, the maximum load point of the specimens in hydrogen gas was lower than those of the specimens in air, which was 20.5 kN (1,568 MPa) in hydrogen compared to 22.1 kN (1,755 MPa) in air at Kt = 1.8, 17.4 kN (1,385 MPa) in hydrogen compared to 23.6 kN (1,913 MPa) in air at Kt = 3.3, and 14.9 kN (1,187 MPa) in hydrogen compared to 24.1 kN (1,875 MPa) in air at Kt = 4.6. The maximum load points of the specimens in hydrogen gas were all within the range where the load-displacement curve in air increased while maintaining its linearity. After reaching the maximum load point in hydrogen, the load decreased sharply, thus leading to fracture.
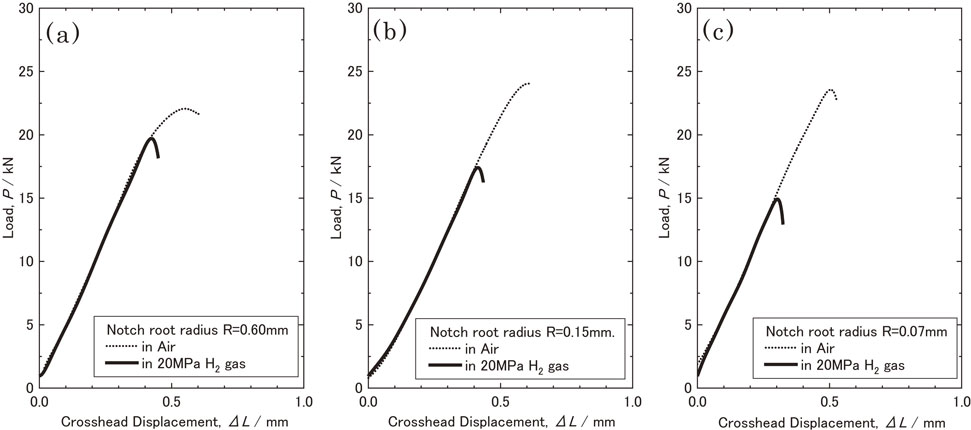
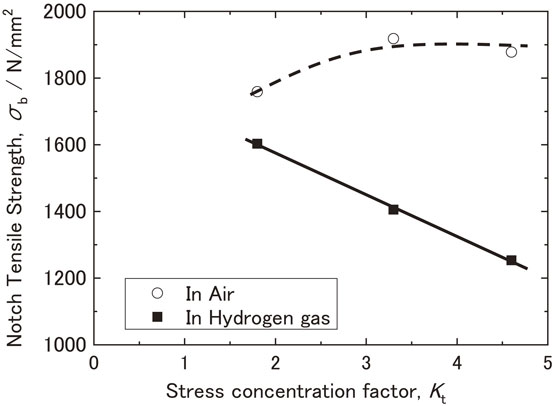
Figure 6 shows the relationship between Kt and the notch tensile strength of the specimens in air and hydrogen gas. The vertical axis of the curve represents the tensile strength of the specimens in air and hydrogen gas. In air, the effect of triaxial stress was saturated for specimens with large Kt, and the notch tensile strength was almost the same.16) In hydrogen gas, the notch tensile strength decreased linearly as Kt increased, indicating that the effect of hydrogen on the specimen increased with an increase in Kt.
3.3 Fracture surface observation results
Figure 7 shows low magnification images of the fracture surface of the specimens subjected to notch tensile testing in air and hydrogen gas. In air, the microvoid coalescence (MVC) fracture surface was observed over a wide range of the central region of the test specimen, and a shear lip was recognized in the outer peripheral region. All these fracture surfaces corresponded to ductile fractures composed of dimples. Conversely, in the hydrogen gas test, the dimpled surfaces can be observed in the center of the specimens, but the fracture surfaces of the outer peripheral region were significantly different from those of the specimens tested in air. In the outer peripheral region of the notch root, which comes into direct contact with hydrogen gas, brittle fracture surfaces such as quasi-cleavage (QC) fracture surfaces and intergranular (IG) fracture surfaces were observed over a wide area. The dimpled surfaces in the center were considered to be the ultimate fracture surface that occurred rapidly, such that the hydrogen gas barely affected the sample. These fracture surfaces appeared because of the decrease in the cross-sectional area of the specimen as the cracks propagated.
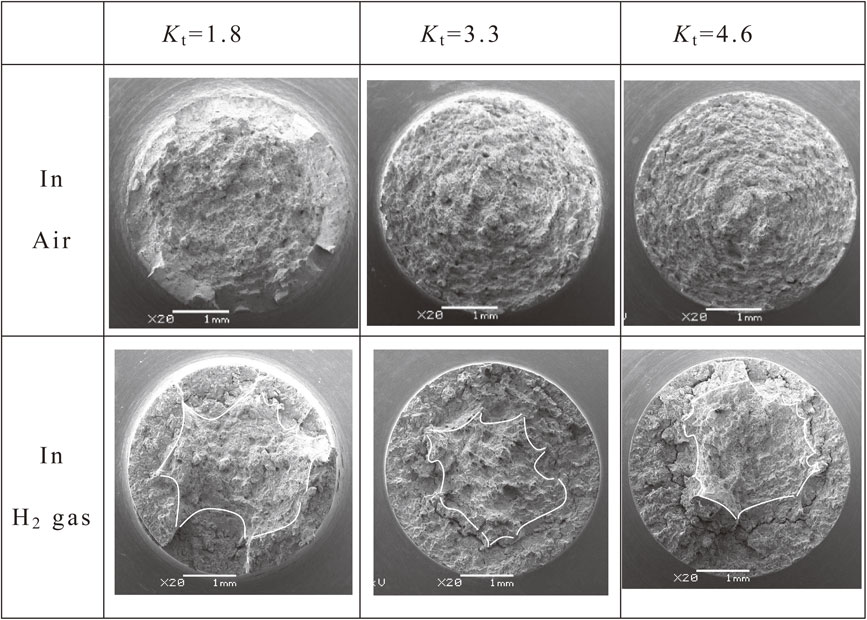
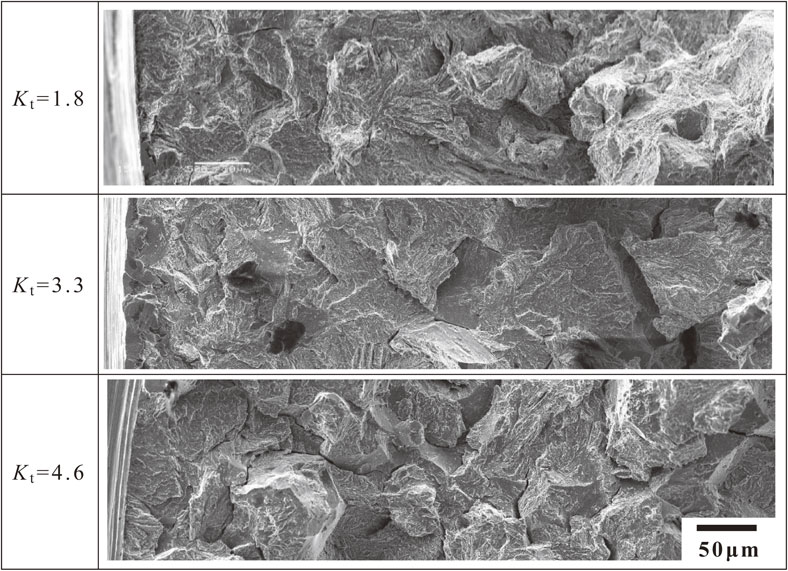
Figure 8 shows the magnified fracture surfaces of the area around the notch root after hydrogen testing at various values of Kt. Significant differences in the fracture surface characteristics of the specimens at Kt = 3.3 and at Kt = 4.6, were observed between the notch side and the center side, with the dotted line marking the boundary. At the region of the notch root side, relatively smooth hydrogen embrittlement fracture surfaces unaccompanied by cracks, called QC fracture surfaces, were observed, and those at Kt = 4.6 were narrower than those at Kt = 3.3. In the center region, the fracture surface of the specimen changed in appearance to that of an IG fracture mode with a vertical sub-crack. The IG fracture surface at Kt = 3.3, with sub-cracks, was smoother than that at Kt = 4.6. In contrast, at Kt = 1.8, QC fracture surfaces accounted for most of the fracture surfaces of the specimen, with few fracture surfaces accompanied by sub-cracks. In the fracture surface of the specimens shown in Fig. 8, the higher the stress concentration (Kt) of the specimens, the larger the unevenness of the fracture surface, and the IG fracture mode becomes dominant. However, even with the IG fracture surface, numerous striped patterns, which were considered to be influenced by plastic deformation, were observed on the fracture surface of each specimen.
4. Discussion
4.1 Initiation of cracks in hydrogen gas
Figure 9 shows the distribution of the equivalent plastic strain of the test materials using two-dimensional FEM analysis. This strain represents the state at the maximum load in the notch tensile test in hydrogen gas. The dark areas indicate the plastic regions. When cracks form at the maximum load, the equivalent plastic strain distribution at the notch root section shown in Fig. 9 is considered to express the conditions just before fracture. At Kt = 1.8, all cross sections were fully plastic regions, and at Kt = 3.3 and 4.6, the lengths of the plastic region from the notch root were 350 and 178 µm, respectively. These lengths roughly match the widths of the fracture surfaces unaccompanied by cracks directly underneath the notch root at Kt = 3.3 and 4.6, as shown in Fig. 8. This relatively flat fracture surface few cracks was considered to be the region that yielded before crack initiation during notch tensile testing in hydrogen gas and then changed to the IG fracture surface.
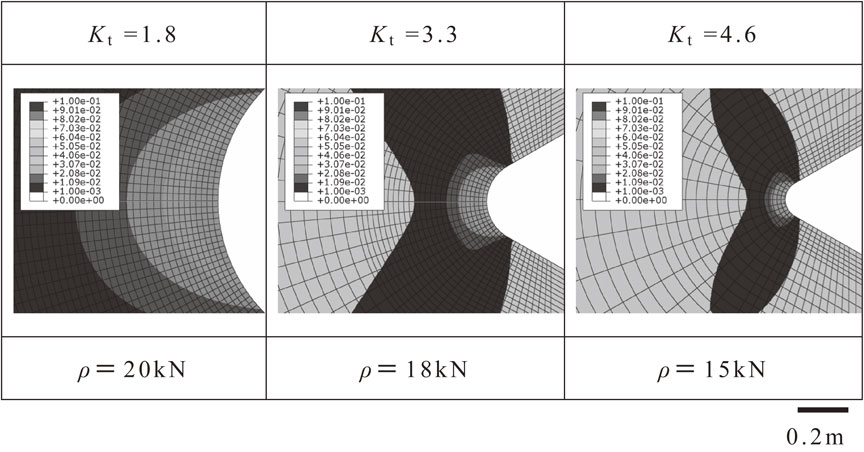
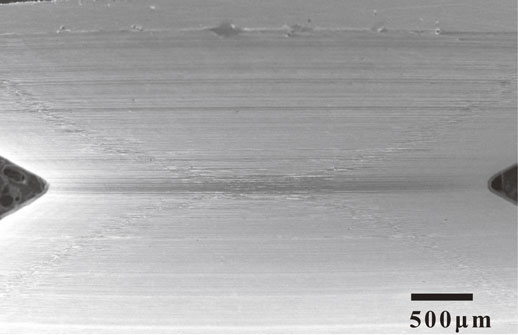
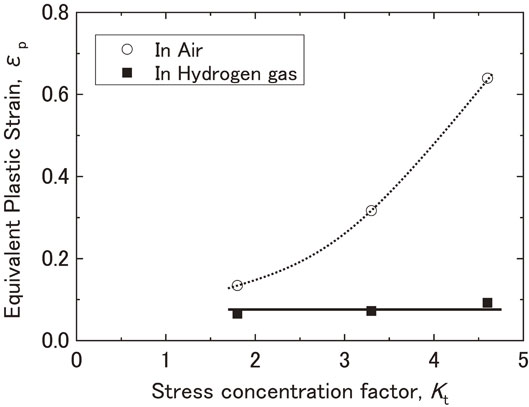
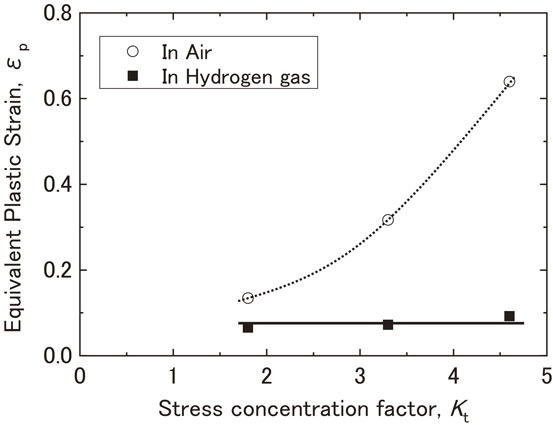
Figure 10 shows the relationship between Kt and the equivalent plastic strain at the notch root at the maximum load point in air and hydrogen gas, as determined by finite element method (FEM) analysis. In air, the equivalent plastic strain value of the notch root at the maximum load point increased with an increase in Kt. While in hydrogen gas, that value of the notch root were almost constant when the maximum load point was reached. The onset of plastic deformation at the notch root of the specimens occurred at 6.0, 3.5, and 2.5 kN for Kt = 1.8, 3.3, and 4.6, respectively. Subsequently, the plastic regions expanded, and the notch root strain increased with an increase in load; however, as shown in Fig. 5, the load-displacement diagram maintains a linear shape until reaching the maximum load points of the notch tensile testing in hydrogen gas. In other words, until reaching 20.5, 17.4, and 14.9 kN for Kt = 1.8, 3.3, and 4.6, respectively, the notch tensile testing curves in hydrogen overlaid the lines traced by the testing curves in air, and the effect of hydrogen was not observed. In Fig. 5, the maximum load in hydrogen gas decreased linearly with an increase in Kt, but the strain of the notch root in contact with hydrogen gas remained constant regardless of Kt. When the load applied during the notch tensile testing in hydrogen gas reached the maximum value, the equivalent plastic strain value were equivalent to the strain value of 0.068 at the maximum load point represented by △ on the true stress-true strain curve in Fig. 4, while there is a difference between the equivalent plastic strain and true strain. The maximum load point in smooth tensile testing is defined as the point where the uniform elongation changes to local deformation and is considered to be the point where voids begin to form in the material. Thus, the initiation of cracks that lead to fractures under notch tensile testing in hydrogen gas is considered to occur after voids begin to form in the material. The formation of voids has been shown to increase the susceptibility of the material to the influence of hydrogen and facilitate the initiation and propagation of cracks, leading to fracture. Previous studies have also reported an increase in the formation of voids as one of the roles of hydrogen in hydrogen embrittlement,10,17,18) and the findings of this study are consistent with those of previous studies. In addition, Fig. 11 shows the SEM image of the notch root of the Kt = 4.6 specimen loaded up to 14 kN, which is approximately 1 kN below the maximum load. The equivalent plastic strain at this load is 0.083. The fact that there were no cracks in the notch root suggests that cracks were formed after the maximum load point was reached, and the cracks subsequently propagated.
After cracks were initiated at the notch root, the differences in the stress concentration conditions due to differences in the notch root shape disappear, and crack propagation is considered to be dependent on the stress concentration state at the crack tip of the specimen in hydrogen gas. However, as there were differences in the maximum load (i.e., the loads at which cracks develop) due to the different Kt, differences in the crack tip stress intensity factor at the time of crack progression were observed, and the fracture surface morphology was also considered to be different. The crack surface at the center of the specimen with Kt = 4.6, as shown in Fig. 8, was an IG fracture surface accompanied by vertical cracks. For Kt = 3.3, the QC fracture surface coexisted with the IG fracture surface, while Kt = 1.8 corresponded to the QC fracture surface. For the crack propagation of the specimens in hydrogen gas, it was reported that the crack propagated along the grain boundary, and the fracture surface became intergranular when the value of Kt at the crack tip was small.19) As the Kt at the crack tip increases, it has been reported that the crack propagates within the grain and the fracture surface becomes the QC type, and as Kt increases further, the fracture surface becomes the MVC type. At Kt = 4.6, where the load was small at the crack initiation time, the load at crack propagation was low, hence, IG fracture surfaces were dominant. At a lower Kt value, the load at the crack initiation time increased, suggesting that cracks propagated under a large load and QC fracture surfaces became dominant. These differences in fracture surface formation are considered to be due to the differences in the load at crack initiation. At Kt = 1.8, the material was yielded across the full section at crack initiation, and QC fracture surfaces were considered to have formed with few cracks over a wide region, not just directly under the notch base.
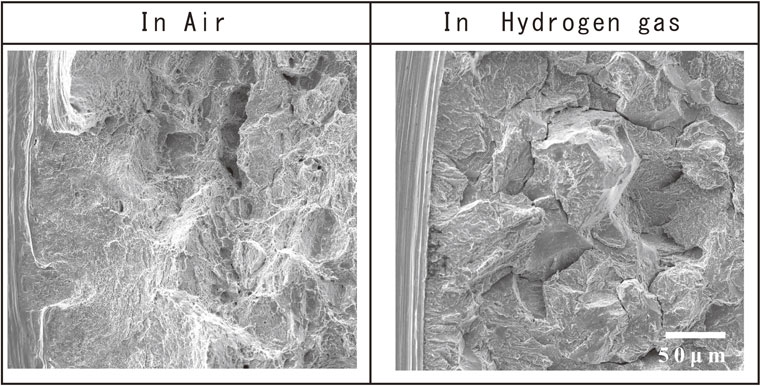
Figure 12 shows enlarged photographs of the fracture surfaces at the notch root of specimens obtained during notch tensile testing in air and hydrogen gas at Kt = 4.6. The morphologies of the notch base fracture surfaces of the specimens in air and in hydrogen gas were significantly different, with the specimens in hydrogen gas producing hydrogen embrittlement fracture surfaces directly beneath the notch base due to the influence of hydrogen gas. Regarding the hydrogen penetration behavior during hydrogen tensile testing, Takazawa et al. conducted tensile testing of steel in hydrogen gas and measured the change in the amount of hydrogen that penetrated the steel for various load states and reported that hydrogen penetrated the steel under load even in the elastic regions.20) It was suggested that hydrogen could penetrate the steel even before the initiation of cracks. Wang et al. made detailed observations on the effect of hydrogen on fracture surfaces in notch tensile testing, but reported that no difference in fracture mode was observed in the fracture surface affected by hydrogen.21) The difference in the fracture surface morphology at the notch root is attributed to the fact that Wang et al. investigated the effect of internal hydrogen, while we investigated the effect of external hydrogen. In the case of internal hydrogen, the strain increased in the presence of hydrogen and cracks were initiated, whereas in the case of external hydrogen, it was considered that the strain increased at the notch root before sufficient hydrogen penetrated, followed by rapid hydrogen penetration and crack initiation. In other words, in the tensile test under hydrogen gas, only a small amount of hydrogen penetrated the steel until the strain value, where voids were formed in the material. Subsequently, a large amount of hydrogen penetrated the steek and cracks were initiated after the strain value became large.
5. Conclusion
In this study, SNCM439 steel samples were subjected to notch tensile testing at room temperature in air and hydrogen gas, and the effect of hydrogen on the specimen in a high-pressure hydrogen gas environment was investigated. The effect of hydrogen gas on steel was investigated by observing the fracture surface of the specimens after the tensile test and FEM analysis. The following conclusions were drawn:
-
(1)
The load-displacement curve of the specimens subjected to notch tensile testing in a hydrogen gas environment exhibited the same behavior as that of the specimen in air until reaching the maximum load point. However, on reaching the maximum load point, which was lower than that in the air, the specimens broke.
-
(2)
In hydrogen gas testing, cracks were generated in the specimen at the maximum load point, after which the load dropped abruptly.
-
(3)
In hydrogen gas, the notch tensile strength decreased with an increase in Kt, but the local strain of the notch root remained almost constant regardless of Kt. Cracks initiation in hydrogen gas were considered to be significantly affected by strain value.
-
(4)
The initiation of cracks in the notch tensile testing specimen in hydrogen gas occurred at a strain value equal to or greater than the strain value at the maximum load point in the smooth tensile test. Hydrogen embrittlement occurred above the strain value at which local deformation was initiated, suggesting the formation of voids in the material, which were rapidly affected by hydrogen.
-
(5)
On the fracture surface after notch tensile testing in hydrogen gas, QC fracture surfaces without cracks were observed just below the notch root, which was different from the fracture surface obtained after subsequent crack propagation. The width of these QC fracture surfaces decreased with increasing Kt, and the sizes were considered to depend on the area of the plastic zone formed at the time of crack initiation during hydrogen gas testing.
-
(6)
The fracture surfaces after notch tensile testing in hydrogen gas exhibited different fracture surface modes depending on the load at the time of crack initiation. The load at crack initiation decreased with an increase in Kt, and the ratio of the IG fracture surface increased owing to crack propagation under a small load.
Acknowledgments
I would like to thank the late Dr. Ohnishi, who was our honorary advisor, for his useful advice on how to proceed with our research. I would also like to thank Dr. Hashimoto of Hokkaido University for his guidance and encouragement in the preparation of my thesis.
REFERENCES
- 1) Hydrogen and Fuel Cell Strategy Council/The Strategic Road Map for Hydrogen and Fuel Cells – Industry-academia-government action plan to realize a “Hydrogen Society” (2019) p. 28.
- 2) IEA/The Future of Hydrogen, (2019) p. 128.
- 3) K. Ohnishi: The Japan Institute of Metals 8 (1969) 576–586.
- 4) K. Ohnishi, R. Chiba, K. Teshirog and H. Kaga: J. Japan Inst. Met. Mater. 40 (1976) 650–656.
- 5) J. Watanabe, K. Ohnishi and K. Chiba: Kouatugasu 13 (1976) 564–575.
- 6) Y. Shimokawa: Tetsu-to-Hagané 57 (1971) 1792–1819.
- 7) D.P. Williams and H.G. Nelson: Metall. Trans. 1 (1970) 63–68.
- 8) B.J. Berkowitz, J.J. Burton, C.R. Helms and R.S. Polozzotti: Scr. Metall. 10 (1976) 871–873.
- 9) T. Tabata and H.K. Brinbaum: Scr. Metall. 18 (1984) 231–236.
- 10) M. Nagumo, M. Nakamura and K. Takai: Metall. Mater. Trans. A 32 (2001) 339–347.
- 11) H. Arashima, S. Masada, H. Itoh and K. Ohnishi: Tetsu-to-Hagané 96 (2010) 76–83.
- 12) H. Matsunaga, M. Yoshikawa, R. Kondo, H. Itoga, J. Yamabe and S. Matsuoka: Proceedings of the ASME 2015 Pressure Vessels and Piping Division Conference, PVP2015-45742 (2015).
- 13) H. Matsunaga, M. Yoshikawa, R. Kondo, J. Yamabe and S. Matsuoka: Int. J. Hydrogen Energ. 40 (2015) 5739–5748.
- 14) S. Matsuoka, H. Matsunaga, J. Yamabe, S. Hamada and T. Iijima: Trans. JSME 83 (2017) 17-00264.
- 15) R.E. Peterson: Stress Concentration Design Factors, (John Wiley & Sons, New York, 1953) pp. 38–39.
- 16) M. Ohashi: Trans. JSME Ser. A 75 (2009) 127–132.
- 17) T. Doshida, H. Suzuki, K. Takai, N. Oshima and T. Hirade: Tetsu-to-Hagané 98 (2012) 197–206.
- 18) K. Saito, T. Hirade and K. Takai: Metall. Mater. Trans. A 50 (2019) 5091–5102.
- 19) C.D. Beachem: Metall. Mater. Trans. B 3 (1972) 441–455.
- 20) K. Takasawa, R. Ishigaki, Y. Wada and R. Kayano: Tetsu-to-Hagané 97 (2011) 288–294.
- 21) M. Wang, E. Akiyama and K. Tsuzaki: Corros. Sci. 49 (2007) 4081–4097.