Abstract
Copper tubes are used in refrigerator and air conditioning unit heat exchangers. However, in some cases, the areas in copper tubes subjected to mechanical processing experience pitting corrosion. Therefore, a test scheme to rapidly evaluate the corrosion resistance of copper tubes in these sections and the effectiveness of the initial treatment on corrosion resistance were investigated. The initial treatment is a chemical treatment that improves the corrosion resistance of copper tubes. The corrosion of copper tubes was investigated by observing the surface after immersing the copper tube in various solutions containing hydrogen peroxide, chloride ions, sulfate ions, benzotriazole and hydrogen carbonate ions for one day. The test solution that contained a combination of 10 mg/L hydrogen peroxide (H2O2), 300 mg/L chloride ions (Cl−), 300 mg/L sulfate ions (SO42−) and 10 mg/L benzotriazole was found to replicate actual corrosion processes on the copper tubes over 1 day. The results indicated a high tendency for corrosion to occur in the mechanically processed sections. The improved corrosion resistance in these sections from the initial treatment was also confirmed in the test solution. Additionally, the corrosion resistance in the mechanically processed sections of copper tubes was weaker as the residual carbon amount increased.
This Paper was Originally Published in J. Soc. Mater. Sci., Japan 69 (2020) 804–809. All figures and tables (except Figs. 4, 5 and Table 3) and all captions of figures and tables (except Tables 4, 6) were slightly modified.
1. Introduction
Copper has high thermal conductivity, is easily machinable and is resistant to corrosion in fresh water.1) Therefore, it is widely used in heat exchangers of air conditioning equipment such as refrigerators and air handling units. However, pitting corrosion may occur in the copper tubes of refrigerator heat exchangers or in the copper coil of air handling units, which can cause long-term equipment shutdown due to water leakage, requiring replacement of the copper tubes or air handling unit. The pitting corrosion process of copper is affected by the amount of residual carbon on the inner surface of the material.2–4) It has been reported that environmental factors such as residual chlorine, sulfate ions, chloride ions, and free carbonic acid also have an effect on this process.5–11)
In recent years, the use of machined copper tubes has been increasing to improve heat transfer efficiency and achieve energy savings. It has been reported that in a corrugated copper tube machined with a convex inner surface, corrosion deposits were found along spiralled sections.12) Water leakage due to corrosion was also observed in the machined section of a copper tube.13) However, few reports have investigated the effect of machining on corrosion. Applications of an initial treatment on copper tubes is also increasing. This involves use of a chemical treatment in which water containing an inhibitor is circulated during the initial stage of use, such as when a refrigerator is delivered, to form an anticorrosion film on the surface of the copper tube to reduce the risk of corrosion. Although studies have been reported on initial treatments, the precise effect has yet to be sufficiently clarified.3,14,15)
Therefore, in this study, a test solution able to rapidly evaluate the corrosion resistance of copper tubes by a short-term immersion test was examined. In addition, the influence of machining on the corrosion resistance of copper tubes and the effectiveness of the initial treatment were investigated using this test method.
2. Method
2.1 Test materials
2.1.1 Machined copper tubes from a refrigerator manufacturer
As the specimen material, a corrugated phosphorus deoxidized copper tube (JIS H3300 C1201) with an outer diameter of 16.0 mm and a wall thickness of 0.5 mm was used. The test material was cut to a length of 2 cm, and further divided in half. Next, a coated copper wire was connected to the half-cut test material. Finally, this test material was coated with silicone resin except for a 1 cm2 test area on its inner surface (hereafter referred to as the “machined copper tube”). To ensure testing under the same conditions as those experienced by actual machines, no operation such as degreasing was performed. This test specimen was used for “Test I” (preliminary test) described in Section 3.1 below.
2.1.2 Commercially available copper tubes
As the specimen material, a commercially available phosphorous deoxidized copper tube (JIS H3300 C1220 1/2H) with an outer diameter of 19.0 mm and a wall thickness of 1.0 mm was used. This test material was cut to a length of 2 cm, and different test specimens were prepared through the following procedures. (1) The test material was cut in half (hereafter referred to as the “as-received copper tube”); (2) the test material was cut in half, and an approximately 1 cm scratch was created with a 0.45 mm-thick cutter knife with a stainless steel blade immediately before the start of the test (hereafter referred to as the “scratched copper tube”), and; (3) the test material was prepared by pressing a pipe cutter against the outside of the tube, pushing the blade to a depth of 1.0 mm to create a convex machined portion inside of the tube, and then cutting the tube in half (hereafter referred to as the “machined-simulated copper tube”). These three types of test specimens were connected to a coated copper wire and coated with silicone resin, except for the 1 cm2 test area on the inner surface. To ensure testing under the same conditions as those experienced by actual machines, no operation such as degreasing was performed.
The initial treatment was conducted by immersing the test specimen for 1 day in tap water containing a commercially available solution (Kurita Water Industries LTD.) with agents including a nitrogen-sulfur-based chelating agent and an azole-type anticorrosive agent for copper. The treatment was carried out at room temperature, with the specimen open to the atmosphere, under magnetic stirring at 300 rpm, and the test specimen was washed with pure water before the immersion test. This test specimen was used for “Test II” (examination of the test solution composition and confirmation of the effect of the initial treatment), as described in Section 3.2 below.
2.1.3 Copper tubes with known residual carbon amount
This specimen material was a phosphorus deoxidized soft copper tube (JIS H3300 C1220) with mean residual carbon on the copper tube inner surface (hereafter referred to as the “residual carbon amount”) of the three different levels: 0.5 mg/m2 (hereafter referred to as “C0.5”), 6.6 mg/m2 (hereafter referred to as “C6.6”) and 13.0 mg/m2 (hereafter referred to as “C13.0”). The C0.5 specimen had an outer diameter of 15.2 mm and a wall thickness of 0.4 mm, and the C6.6 and C13.0 specimens had an outer diameter of 15.88 mm and a wall thickness of 0.8 mm. The specimen materials were cut to a length of 2 cm, and three types of test specimens were prepared as described in section 2.1.2: as-received copper tubes, scratched copper tubes and machined-simulated copper tubes. These three types of test specimens were connected to a coated copper wire and coated with silicone resin, except for the 1 cm2 test area on the inner surface. To ensure testing under the same conditions as those experienced by actual machines, no operation such as degreasing was performed. These test specimens were used for “Test III” (Influence of residual carbon amount), as described in Section 3.3 below.
2.2 Test solutions
2.2.1 Test I
The test solution used was tap water to which hydrogen peroxide as an oxidant, chloride ions and sulfate ions as corrosive anions, benzotriazole (BTA) and hydrogen carbonate ions as an anticorrosive component were added. The tap water used in the following tests was from Nogi-machi, Shimotsuga-gun, Tochigi Prefecture. Table 1 shows the average water quality during this research period. Table 2 shows the water quality of the test solution. For chloride ions, sulfate ions, and hydrogen carbonate ions, sodium salt reagents were used.

Table 1 Chemical composition of tap water.
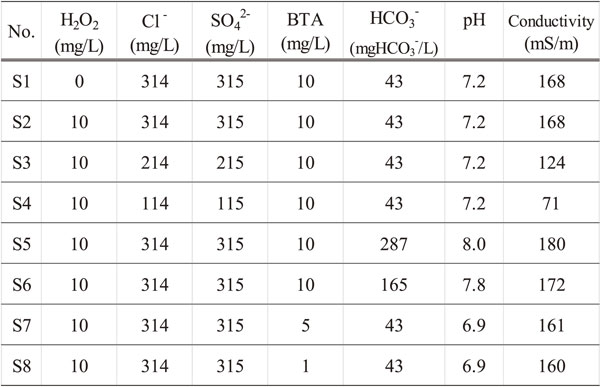
Table 2 Chemical composition of test solutions for Test I.
The test solution used was pure water to which hydrogen peroxide, chloride ions, sulfate ions and BTA were added. Table 3 shows the water quality of the test solution. For chloride ions and sulfate ions, sodium salt reagents were used.

Table 3 Chemical composition of test solutions for Tests II and III.
Figure 1 shows a schematic diagram of the test equipment. 1 L of the test solution was placed in a 1 L beaker, the test specimen was immersed for 1 day, after which the appearance of the specimen was observed. The test was conducted at room temperature, with the specimen open to the atmosphere and stirred at 300 rpm with a magnetic stirrer. The corrosion potential was measured for 5 minutes, 16 ± 2 hours after the start of the test and at the end of the test. As the reference electrode, saturated Ag/AgCl (hereafter referred to as “SSE”) was used, and was immersed into the test solution each time the potential was measured. For Test I, n = 1 because the amount of test material was small, and this procedure was performed as a preliminary test; for Tests II and III, n = 3.
2.4 Surface observation
After the immersion test, the surface of the test specimen before and after removing the deposit was observed with a scanning electron microscope (SEM). In addition, elemental analysis was performed by energy dispersive X-ray analysis (EDX). An SEM-EDX analyzer (JSM-6490; JEOL Ltd.) was used under high-vacuum conditions and an accelerating voltage of 15 kV. The deposits were removed with 10% dilute sulfuric acid.
3. Results and Discussion
3.1 Test I (Preliminary examination test)
Figure 2 shows the appearance of the test specimen prepared as described in section 2.1.1 after immersion in the test solution shown in Table 2 for 1 day. In test solutions S2, S3, S4 and S7, greenish-blue deposits were observed on the spiral machined portion, similar to the actual refrigerator. Comparing the test solutions S2, S3 and S4, deposits were clearly observed in S2, which had the highest concentration of chloride ions and sulfate ions. No deposition was observed in test solution S1 containing no hydrogen peroxide. In test solutions S5 and S6, to which hydrogen carbonate ions were added, slight deposits were observed. Yamanaka et al. reported that hydrogen carbonate ions were a factor that reduced the anode current.10) Kawasaki et al. reported that hydrogen carbonate ions suppressed the film destruction of copper in a test using oxygen-free copper.11) Regarding the present results, it is considered that hydrogen carbonate ions act as an anticorrosion factor for copper. Comparing test solutions S2, S7 and S8, greenish-blue deposits were observed under addition of 5 mg/L or more of BTA. It has been reported that BTA has an excellent anticorrosion effect on copper.16) However, it is suggested that BTA affects the formation of greenish-blue deposits under severely corrosive conditions, where the concentration of chloride ions and sulfate ions is high, hydrogen peroxide coexists, and the BTA concentration is relatively high.

From the above results, by immersing the machined copper tube in test solution S2, which was prepared by adding 10 mg/L hydrogen peroxide, 300 mg/L chloride ions and sulfate ions, and 10 mg/L BTA to tap water for 1 day, greenish-blue deposits were found on the mechanically processed sections. This is similar to the corrosion in actual machines, where corrosion products were found on and around the machined portion of a corrugated tube in a refrigerator heat exchanger.12,13) Therefore, this test scheme was demonstrated to replicate the actual corrosion process on copper tubes.
3.2 Test II (Examination of the test solution composition and confirmation of the effect of the initial treatment)
3.2.1 Examination of the solution composition
Figure 3 shows the appearance of the test specimen prepared as described in section 2.1.2 before and after immersion in the test solution shown in Table 3 for 1 day. Table 4 shows the measurement results of the corrosion potential of the test specimen. Test solution A containing only hydrogen peroxide as the oxidant exceeded 0.29 V vs. SSE immediately after the start of the test; however, after that, the corrosion potential decreased, and no change in appearance was observed after the test. In test solution B, to which only chloride and sulfate ions were added, the color of the entire surface of the test specimen changed to deep purple. In test solution C containing hydrogen peroxide and chloride and sulfate ions, a part of the surface of the test specimen turned brown, but no greenish-blue deposit was observed. In test solution D to which hydrogen peroxide and BTA were added, all measured corrosion potentials were 0.24 V vs. SSE or higher, but no change was observed in the appearance after the test. Test solution E containing BTA and chloride and sulfate ions had a few greenish-blue deposits. In test solution F containing hydrogen peroxide, chloride and sulfate ions, and BTA, many tiny greenish-blue deposits were confirmed over the entire surface of the test specimen. Even when pure water was used to prepare the test solution, the generation of greenish-blue deposits was clearly confirmed by the combination of hydrogen peroxide, chloride and sulfate ions, and BTA.

Figure 4 shows the results from the SEM images of the locations of deposits before and after removing the test specimen from immersion in test solution F. In addition, the EDX mapping results after removing the deposits are shown in Fig. 5. The deposit was composed of fine-grained materials. Localized corrosion occurred under the greenish-blue deposit was confirmed from hemispherical pits observed on the surface of the test specimen after removing the deposits. From the EDX mapping results, it was confirmed that Cl was concentrated under part of the deposit (including the bottom of the pit). In actual pitting corrosion of copper tubes, Cl is often observed at the bottom of the pit, which is considered to be reflected in this result.

From the above results, as seen in Test I, localized corrosion occurs on the surface by immersing the test specimen in the test solution containing 10 mg/L hydrogen peroxide, 300 mg/L chloride and sulfate ions, and 10 mg/L BTA for 1 day. Since the characteristic concentration of Cl was confirmed, test solution F was used for rapidly evaluating the corrosion resistance of copper tubes (hereafter referred to as the “test solution to evaluate copper corrosion resistance”).
3.2.2 Effect of the initial treatment
Figure 6 shows the appearance of the machined-simulated copper tube, scratched copper tube, and as-received copper tube prepared as in section 2.1.2 before and after 1 day of immersion in a test solution to evaluate copper corrosion resistance. Figure 7 shows the appearance of the machined-simulated copper tube, scratched copper tube, and as-received copper tube before and after the initial treatment and after the immersion test. Table 5 shows the corrosion potential of each test specimen for each immersion time. As shown in Fig. 6, greenish-blue deposits selectively occurred in the mechanically processed sections of the machined-simulated copper tube, and greenish-blue deposits were found in the scratched parts of the scratched copper tubes. The results indicated a high tendency of corrosion in the mechanically processed section and the scratched section. Corrosion occurred because the new surfaces were exposed at the relevant locations.


On the other hand, as shown in Fig. 7, no greenish-blue deposits were observed on the copper tubes that had undergone the initial treatment, regardless of machining or the presence of scratches. The corrosion potentials during the corrosion test were 0.20 V vs. SSE or more for all measured values of the machined-simulated copper tube and the as-received copper tube, and the scratched copper tube had a minimum value of 0.18 V vs. SSE and a maximum value of 0.21 V vs. SSE. The corrosion potential of the initially treated copper tube remained higher than that of the tube without the initial treatment in which the occurrence of corrosion was confirmed. However, neither discoloration nor greenish-blue deposits were observed on the initially treated copper tube. Therefore, it was suggested that the initial treatment has a corrosion inhibition effect. Although the initial treatment has already been applied in many cases, the effect of carbon film has not been fully clarified and will be verified by field tests in the future.
3.3 Test III (Influence of residual carbon amount)
Figures 8 to 10 show the appearance of C0.5, C6.6 and C13.0 machined-simulated copper tubes, scratched copper tubes and as-received copper tubes prepared as described in section 2.1.3 before and after 1 day of immersion in a test solution to evaluate copper corrosion resistance. Table 6 shows the corrosion potential of each test specimen at each immersion time. Regarding the appearance before the test, the C0.5 and C6.6 copper tubes had a strong metallic luster. A visual comparison of the number of greenish-blue deposits between the commercially available copper tube (Fig. 6) and the three types of copper tubes with known residual carbon amounts showed the following. For the machined copper tube, the number of greenish-blue deposits increased in the order of: Commercially available copper tube ≫ C13.0 > C6.6 > C0.5. Among the copper tubes with known residual carbon amounts, the larger the residual carbon amount is, the greater the number of deposits which resulted. For scratched copper tubes, the number of greenish-blue deposits increased in the order of C13.0 > Commercially available copper tube ≒ C6.6 > C0.5. Among the copper tubes with known residual carbon amounts, the larger the residual carbon amount, the greater the number of deposits which resulted.


Table 6 Corrosion potentials of test specimens.
For the as-received copper tube, the number of greenish-blue deposits increased in the order: Commercially available copper tube ≫ C6.6 ≒ C0.5 ≒ C13.0. While the commercially available copper tube had many deposits, the copper tubes with known residual carbon amounts showed no change, and corrosion was slight.
From the above results, it was suggested that the residual carbon amount has an influence on the occurrence of corrosion in the mechanically processed section and the scratched section. It was considered that the commercially available copper tube contained a large amount of residual carbon because many deposits were found on the machined portion and scratched part. Sakai et al. reported results suggesting that corrosion progresses with the high residual carbon area serving as the cathode and the exposed copper area serving as the anode, using electrochemical measurements of a copper tube with a known residual carbon amount.17) In our result, it was considered that the original surface of the copper was exposed in the mechanically processed section and scratched section and formed an anode.
4. Conclusion
The composition of a test solution that can be used to rapidly evaluate the corrosion resistance of copper by a short-term immersion test was investigated. In addition, the influence of machining on the corrosion resistance of copper tubes and the effectiveness of the initial treatment were investigated using the test scheme. The results were as follows.
-
(1)
By immersing the test specimen of copper tubes in the test solution containing hydrogen peroxide as an oxidant, chloride and sulfate ions as corrosive anions, benzotriazole as an anticorrosion component, and tap water for one day, it was possible to replicate the generation of greenish-blue deposits in the mechanically processed sections as well as corrosion of the actual refrigerators and air handling units.
-
(2)
By immersing the test specimen of copper tubes in the test solution containing 10 mg/L hydrogen peroxide, 300 mg/L chloride ions, 300 mg/L sulfate ions and 10 mg/L benzotriazole in pure water for one day, greenish-blue deposits formed, and hemispherical pits were observed under the deposits after removing them. Therefore, this test solution is expected to be usable for the rapid evaluation of corrosion resistance of copper tubes.
-
(3)
In the test solution, the results indicated a high tendency of corrosion to mechanically processed sections and scratched sections of the copper tube.
-
(4)
No greenish-blue deposits were observed on the copper tubes that had undergone the initial treatment, regardless of machining or the presence of scratches. It is suggested that the initial treatment improves the corrosion resistance.
-
(5)
Corrosion in the machined portions and the scratched parts of the copper tube increases with the amount of residual carbon in the material.
Acknowledgments
The test materials with a known residual carbon amount used in this study were obtained from the Sakurada Laboratory of Gifu University. We are grateful to Dr. Tanaka of Dai-dan Co., Ltd., and Dr. Yamada, a visiting professor at Gifu University, who provided guidance for this research.
REFERENCES
- 1) T. Notoya: Rust Prevention & Control Japan 52 (2008) 25–32.
- 2) Y. Yamada, K. Mizutani and Y. Inoue: Zairyo-to-Kankyo 63 (2014) 158–162.
- 3) Y. Mitamura, M. Ninomiya, T. Daikuhara, Y. Inoue, S. Komukai and Y. Yamada: J. Japan Inst. Copper 51 (2012) 186–190.
- 4) F.J. Cornwell, G. Wildsmith and P.T. Gilbert: American Society for Testing and Materials. ASTM STP 576 (1976) 155–179.
- 5) H. Baba, T. Kodama, T. Fujii and Y. Hisamatsu: Zairyo-to-Kankyo 30 (1981) 161–165.
- 6) N. Tanaka, S. Sato, K. Kawano and S. Suzuki: Collected Abstracts of the Society of Heating, Air-Conditioning Sanitary Engineers of Japan (2011) pp. 1769–1772.
- 7) K. Kasahara and S. Komukai: Boshoku Gijutsu 36 (1987) 492–499.
- 8) E. Mattsson and A.M. Fredriksson: Br. Corros. J. 3 (1968) 246–257.
- 9) M. Itagaki, Y. Shibata, K. Watanabe and K. Machizawa: J. Surf. Finish. Soc. Japan 55 (2004) 549–554.
- 10) H. Yamanaka, T. Fujimoto, T. Nagai and H. Nonaka: Zairyo-to-Kankyo 66 (2017) 328–334.
- 11) M. Kawasaki, N. Taniguchi and M. Naitou: JAEA-Research 2008-012 (2008) 1–55.
- 12) T. Daikuhara, M. Komori, M. Ninomiya and S. Komukai: Proceedings of the 58th Japan Conference on Materials and Environments, Japan Society of Corrosion Engineering (2011) pp. 59–60.
- 13) Kurita Water Industries LTD.: internal report, CWS-12-0021 (2012).
- 14) T. Iyasu and H. Iseri: Proceedings of JSCE Materials and Environment 2009, Japan Society of Corrosion Engineering (2009) pp. 279–282.
- 15) N. Taniyama, T. Iyasu and H. Iseri: Proceedings of 324th Journal of the Society of Materials Science, JSMS (2018) pp. 19–23.
- 16) T. Notoya: Rust Prevention & Control Japan 52 (2008) 49–58.
- 17) M. Sakai, O. Seri, Y. Yamada, I. Toda and M. Iitsuka: Zairyo-to-Kankyo 51 (2002) 12–16.


