1. Introduction
Titanium and its alloys have high specific strengths, excellent corrosion resistance, and stability at high temperatures, making them attractive materials that have been employed in a wide range of industries, including aerospace, automotive, biomedical, and chemical plant applications.1) Among the various manufacturing processes, welding technology is especially important for joining components, and fusion welding methods such as gas tungsten arc welding (GTAW), laser beam welding (LBW), and electron beam welding (EBW) are mainly employed for welding titanium alloys. However, the high heat input in the fusion zone of these high-energy welding processes causes defects associated with melting and solidification, such as a brittle microstructure, cracking, the inclusion of oxide, and a wide heat-affected zone (HAZ). As a result, the mechanical performance of a fusion welded material deteriorates significantly.2,3)
Friction welding (FW) is a novel solid-state welding technique that uses the frictional heat generated by the relative movement between materials on their rotating and advancing sides, and has many advantages. FW can save production costs. It does not require any filler material, shielding gas, or a vacuum, and can remove any contamination at the material surface during the process. In addition, this process is characterized by a low heat input below the melting point compared to fusion welding, which can suppress the problems caused by an excessive heat input.4) Moreover, the microstructure development during FW, which is affected by deformation and temperature, can be easily controlled by changing parameters such as the rotation speed, pressure, and welding time (or upset length). An interesting phenomenon that occurs during FW is dynamic recrystallization (DRX) accompanied by severe deformation and temperature, as shown in thermomechanical processing.5,6) The grain size in the weld zone can be controlled to obtain fine or coarse grains via DRX. Consequently, FW is considered a welding method that can improve the mechanical properties while solving the problems of fusion welding.
The mechanical properties of Ti–6Al–4V alloy are sensitive to microstructural characteristics such as the grain morphology, grain size (or colony size), and fractions of the α and β phases, which are determined by the welding parameters (or thermo-mechanical processing route).7,8) Therefore, it is important to secure the desired properties through microstructure optimization, and FW is a suitable technique to realize this compared to other welding technologies. Therefore, this study was conducted to evaluate the feasibility of using FW for Ti–6Al–4V alloy and to investigate the microstructure evolution and mechanical properties while varying the upset length. In addition, the grain boundary characteristic distributions (GBCDs) of the grain size, grain morphology, and misorientation were systematically analyzed using the electron backscattered diffraction (EBSD) method, and their effects on the mechanical properties were evaluated.
3. Results and Discussion
3.1 Top view and macrostructure of friction welded Ti–6Al–4V alloy
The top view and macrostructure of the friction-welded Ti–6Al–4V alloy are shown in Figs. 2(b)–(e). The flash was well formed with a width of approximately 13 mm under both conditions without distortion, as shown in Figs. 2(b) and (c). FW has the feature that the softened material is extruded toward the outside and contains contaminants such as oxides and foreign particles, and then the flash is formed, as shown in Fig. 2(a). As a result, the Ti–6Al–4V alloy was soundly welded without cracks or porosity, as shown in Figs. 2(d) and (e).
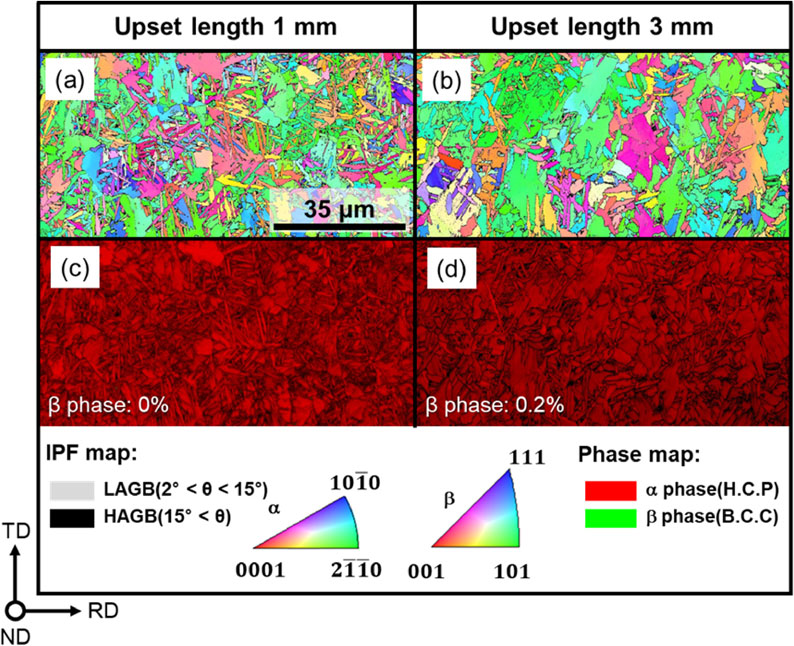
3.2 Microstructures in initial material and weld zone
The results of the EBSD analysis of the initial Ti–6Al–4V alloy material are shown in Fig. 3. An inverse pole figure (IPF) map and image quality (IQ) + phase map are shown in Figs. 3(a) and (b), respectively. The gray and black lines represent the low-angle grain boundaries (LABs) and high-angle grain boundaries (HABs) in the IPF map, respectively, and the red and green colors represent the α phase and β phase in the IQ + phase map, respectively. The initial Ti–6Al–4V alloy material, which was a dual-phase titanium alloy, consisted of an α phase (a hexagonal closed packed structure, H.C.P.) and a β phase (a body-centered cubic structure, B.C.C.). Equiaxed α grains were distributed with inhomogeneous sizes, as shown in Figs. 3(a) and (b). Fine β grains were located at the α grain boundaries and triple junction point of the grain boundaries, and the fraction of these grains was approximately 3.3%, as shown in Fig. 3(b). The grain size distribution had a range of 0.6–15 µm, and the average grain size was approximately 5.75 µm, as shown in Fig. 3(c). The LABs and HABs accounted for 30.2% and 69.8%, respectively, as shown in Fig. 3(d), and the LABs were mainly distributed in regions with clusters of small α grains, as indicated by the black dashed square box shown in Fig. 3(a).

To investigate the difference in microstructure with different upset lengths and locations, EBSD analyses of the welded materials were performed, and the results are shown in Figs. 4 and 5. The EBSD analysis locations are shown in Fig. 2(a), where P1 and P2 are 5 mm and 1.25 mm away from the outer diameter, respectively. The microstructural characteristics such as the morphology, size, and phase distribution were different from those of the initial material. In the case of location P1, a lamellar structure developed in the microstructure of the weld zone at upset lengths of 1 mm and 3 mm, and both conditions showed refinement compared to the initial material, as shown in Figs. 4(a)–(d). In addition, the fraction of the β phase decreased to 1.9% and 1.8% at upset lengths of 1 mm and 3 mm, respectively, while that of the initial material was 3.3%.

The change in the grain morphology was determined by the phase transformation from β to α. The α and β phases in the Ti–6Al–4V alloy were concurrent at room temperature; when the temperature increased, the fraction of the β phase increased and the fraction of the α phase decreased. When the welding temperature exceeded the β-transus temperature, the β phase became the dominant phase. As soon as the rotation stopped, the β phase was subsequently transformed into the α phase, and a lamellar structure was developed, as shown in Fig. 4. In addition, the decrease in the β phase in the weld zone could be explained by the insufficient diffusion time of vanadium. A higher vanadium concentration is required to stabilize the β phase at lower temperatures than at higher temperatures.9) The fraction of the β phase decreased in the weld zone because the β phase, with an low concentration of vanadium at high temperature, was rapidly cooled.
In the case of location P2, the microstructures in the weld zone were changed in a complicated manner compared to those of location P1, as shown in Figs. 5(a) and (b). First, complex-shaped microstructures were distributed at P2, and the grain sizes were coarsened compared to those at location P1. The fractions of the β phase at upset lengths of 1 mm and 3 mm were 0% and 0.2%, respectively. These results resulted from the nonuniformity of the rate of heat generation, where the temperature increased from the center to the outer diameter at the interface during FW.4) The temperature and temperature gradients were higher at P2 than at P1, which made it more difficult to stably grow grains and diffuse vanadium. As a result, less of the β phase was found at location P2.
3.3 Grain size distribution in base material and weld zone
The grain size distributions in the weld zone with the different upset lengths and locations are shown in Figs. 6(a)–(d), and the changes in the average grain size are summarized in Fig. 6(e). In the case of location P1, the grain size distribution had a range of 0.2–5 µm, with average grain sizes of 1.45 µm and 1.85 µm at upset lengths of 1 mm and 3 mm, respectively, as shown in Figs. 6(a) and (b), respectively. In the case of location P2, the grain size distributions had ranges of 0.2–9.5 µm and 0.2–11.8 µm, and average grain sizes of 3.65 µm and 5.57 µm, at upset lengths of 1 mm and 3 mm, respectively. Furthermore, the average grain sizes corresponding the α phase and β phase in base material and various locations are listed in Table 2. The average grain size of α phase and β phase were smaller than that of the initial material, respectively. These grain refinement in the weld zone are explained by dynamic recrystallization accompanied by frictional heat and material flow. In addition, the grain size of the α phase and β phase tended to decrease with decrease in upset length at both locations due to difference of rate of the frictional heat according to radius (center to out diameter of material).10)


Table 2 Average grain size corresponding the α phase and β phase in base material and various locations.
The misorientation angle distributions in the weld zone with the different upset lengths and locations are shown in Fig. 7. The misorientation angle distribution decreased compared to the initial material’s LABs (θ < 15°) and increased compared to the HABs (θ < 15°) in the whole weld zone. As a result, the fraction of HABs in the weld zone significantly increased to ∼92.9% compared to that of the initial material (69.8%). These transformations from LABs to HABs were explained by the DRX that accompanied the FW.

The misorientation angle distributions for all the conditions showed a maximum peak close to an angle of 60°, whereas smaller peaks close to 10° and 90° were observed. These results showed that the transformation from β to α occurred during the cooling after welding. The β-to-α transformation in both martensitic and diffusional transformations generally follows the Burgers orientation relationship (BOR, {110}β//{0001}α and ⟨111⟩β//$\langle 11\bar{2}0\rangle_{\alpha }$). The formation of α/β lamellar colonies is a result of a nucleation and growth mechanism, where the α phase nucleates at the prior β grain boundary and grows inside the β grain according to the BOR.11,12) In addition, prior β grains can transform into as many as 12 different orientation variants of α. The typical rotation angles and fraction of boundaries in weld zone at different positions are listed in Table 3 and Table 4, respectively. These distribution matches in general very well with the prior study on typical distributions in Ti–6Al–4V alloy.13,14) Consequently, the microstructure developed as a result of the DRX and phase transformation.

Table 3 Typical misorientation between α-variants.

Table 4 Fraction of boundaries with misorientation angles in the weld zone at different positions.
The microhardness distributions of the welded materials are shown in Fig. 8. In the base material, the microhardness values ranged from 330 to 350 HV, and the average value was approximately 340 HV. The application of FW led to an increase in the microhardness. As a result, the microhardness values in the weld zone were 409 Hv and 403 Hv, and increased by 20.3% and 18% at upset lengths of 1 mm and 3 mm, respectively, relative to the value in the base material. The value in the thermomechanical affected zone (TMAZ) also increased to 360 HV. No decrease in hardness throughout the different regions was observed, which indicated that the formation of the HAZ was suppressed during FW owing to the low heat input and heat conductivity of titanium.

The engineering stress–strain curve and top-view image of a fractured tensile specimen are shown in Fig. 9. For the base material, the yield and tensile strengths were 961 MPa and 1003 MPa, respectively, and the elongation was 26%, as shown in Fig. 9(a). The yield strengths of the materials welded at upset lengths of 1 and 3 mm were 951 and 946 MPa, respectively, and the tensile strengths were 1053 and 1007, respectively. The yield strengths decreased slightly by ∼1.5%, while the tensile strengths increased by ∼5% compared to the base material. The elongation decreased to 14% and 10%, respectively. The decrease in elongation could be explained by the work hardening and microstructure evolution (grain morphology and fraction of β phase). The elongation of FW joints could also decrease by 50% because the applied pressure affects the deformation of the material during FW.15,16) Furthermore, the increased grain size (slip length) and decreased β phase content were attributed to a decrease in elongation as the upset length increased.

The elongation of the Ti–6Al–4V alloy with a lamellar structure was influenced by the colony size (slip length) and decreased as the colony size increased; this phenomenon could also be applied to equiaxed grain.17–19) Consequently, the elongation at an upset length of 1 mm with smaller grains was higher than that at the upset length of 3 mm with relatively coarse grains. Additionally, the β phase is known to have good formability and elongation because the β phase with a B.C.C. structure has more slip system α phase than the H.C.P. structure. The fractions of the β phase at locations P1 and P2 were lower than that of the base material, which slightly affected the decrease in the elongation. The top-view images of the specimens after the tensile tests showed that fractures occurred at the base material zone and not at the weld zone, as shown in Fig. 9(b).
The deformation behaviors of the base material and welded materials were fairly different as deformation continued after yielding, while they showed almost the same trend in the elastic region, as shown in Fig. 9. Therefore, to investigate the deformation behavior in the uniform elongation region after yielding, the true stress–strain curve and strain hardening rate (θ) curve, represented by the line and scattered circles, respectively, are shown in Fig. 10. The strain-hardening rate was defined as θ = dσ/dε and calculated in the uniform elongation region (εy to εu). In the case of the base material, the strain-hardening rate increased and then gradually decreased after reaching the inflection point. Conversely, the strain hardening rate in the welded materials dramatically decreased in the initial region and then gradually decreased. In addition, the work-hardening rate of the welded materials was higher than that of the base material. The strain-hardening rate is the rate of change in the stress as a function of the strain, and is used as an indicator of formability; for example, materials with a high strain-hardening rate are difficult to deform. Because welded materials have high resistance to deformation, their mechanical properties in a service environment would be better than that of the base material.

The microstructure in the weld zone was developed through a combination of phase transformation and DRX. Several studies on the microstructure of solid-state welded Ti–6Al–4V alloys have been reported. When the welding temperature exceeded the β-transus temperature, the microstructure of the weld zone exhibited a lamellar structure.20) An equiaxed structure was obtained in the weld zone below the β-transus temperature.21) Based on previous studies and the final microstructure (lamellar structure) shown in Fig. 4, FW was performed above the β-transus temperature. The microstructure of the weld zone was developed by the β-to-α transformation during cooling after the rotation stopped, where α nucleated at the prior β grain boundary and grew inside the β grains.
The application of FW led to grain refinement caused by DRX in the weld zone. The driving forces such as the high strain and frictional heat generated at the interface during FW were sufficient to induce recrystallization. The grain refinement was accelerated by a decrease in the upset length. This result could be explained by the smaller prior β grain size as well as the faster cooling rate owing to the lower heat input. Consequently, the grain size in the weld zone was more refined than that in the base material (5.75 µm), with the average grain size in the weld zone decreasing to 1.85 µm and 1.45 µm at upset lengths of 3 mm and 1 mm, respectively, as shown in Fig. 6.
Although the comprehension for the dynamic recrystallization is important, the dynamic recrystallization mechanism in weld zone during friction welding have been rarely reported.22,23) Additionally, grain boundary (GB) and kernel average (KAM) maps are shown in Fig. 11, enlarged from Fig. 4, where the gray line, orange line, and black line represent 2° < θ < 5°, 5° < θ < 15°, and 15° < θ, respectively. As indicated by the blue arrow in Fig. 11, the transformation process from a low-angle grain boundary into a high-angle grain boundary is shown. In this study, continuous dynamic recrystallization (CDRX), which is the process of transforming from a low-angle grain boundary into a high-angle grain boundary through progressive lattice rotation, operated as a recrystallization mechanism rather than discontinuous dynamic recrystallization (DDRX), in which grains nucleate at the grain boundary and consume the deformed grains. We confirmed that the transformation phenomenon of boundaries this study is well matched with prior study.24)

The microhardness of the welded materials was increased by the application of FW. This could be explained by the grain refinement in the weld zone, where materials with smaller grains were more effective. As a result, although the microhardness of the base material had a range of 330–350 Hv, the microhardness values of the weld zones were 439 Hv and 409 Hv at upset lengths of 1 mm and 3 mm, respectively, as shown in Fig. 8. These values were approximately 20% higher than that of the base material.
An increase in microhardness affects the tensile properties. The tensile strengths were 1053 MPa and 1007 MPa at upset lengths of 1 mm and 3 mm, respectively, which were slightly higher (∼5%) than that of the base material. As a result, the tensile specimen was first deformed and then fractured at the base material, which had a lower hardness value than the weld zone. Therefore, grain refinement and the absence of the HAZ were very effective in obtaining friction-welded Ti–6Al–4V alloy specimens with superior mechanical properties.


