Mechanics of Materials
Wear and Degradation of Drilling Performance of Polycrystalline Diamond Compact Bit in Laboratory Test
2022 年 63 巻 3 号 p. 294-303
詳細
2022 年 63 巻 3 号 p. 294-303
Polycrystalline diamond compact (PDC) bits have been widely used in oil and gas well drilling and have recently also begun to be used in geothermal well drilling. In the present study, the drilling performance and wear of a PDC bit were assessed by laboratory drilling tests. The correlation between the progress of bit wear and some indexes of rock abrasivity was discussed referring to the test results. The rate of penetration was formulated as a function of weight on the bit using the drilling test results for other PDC bits with the same geometric design as that used in the present study and introducing a parameter that represents the drilling performance of the bit. The parameter was found to be exponentially reduced with the wear volume of the polycrystalline diamond layer. The parameter was also found to be associated with the drilled rock type.

Drilling performance a versus wear volume of PCD layer Vwd.
The use of polycrystalline diamond compact (PDC) bits, which are rock drilling bits equipped with PDC cutters, has rapidly spread in oil and gas well drilling, replacing conventional roller-cone bits. It has been reported that PDC bits (including diamond bits) account for an astounding 65% of the total footage drilled in oil and gas applications in 2010 and still do not appear to have peaked in their development.1) Recently, the application of PDC bits to geothermal well drilling has begun to be considered worldwide.2–4) In particular, a growing number of case studies in the geothermal field have been reported.5–8)
As the drilling of a rock mass using a PDC bit progresses, the bit becomes blunt owing to bit wear, and thus the drilling speed declines. When the drilling speed falls below a certain level, a PDC bit is judged to have reached the end of its life by the drilling engineers on site and is replaced with a new one. In the case of deep drilling, such as oil, gas, and geothermal drilling, enormous time and cost are required for bit replacement, as is noted by Finger and Blankenship.2) A long bit lifetime reduces the bit replacement frequency and drilling duration and thus, the drilling cost.
The rapid spread of PDC bits in the oil and gas field mentioned above is probably due to the great improvement in the durability of PDC bits since the 1990s. However, the durability of PDC bits in the drilling of hard rock formations is still insufficient compared with that of conventional roller-cone bits. Attention should be paid to the fact that in geothermal fields the strata to be drilled are mostly expected to be hard layers compared with those in oil and gas fields. PDC bits have not had acceptable durability in hard formations; thus, a great deal of work has been carried out to extend the use of PDC bits in such hard formations.9–16)
Although many reports on the performance of PDC bits for hard rocks or in geothermal fields have been published, the quantitative relationship between the wear and drilling performance degradation of PDC bits has not yet been sufficiently clarified, which is probably because it is extremely expensive to observe and measure bit wear repeatedly during a field drilling test in order to monitor the progress of bit wear, and it also takes much time and expense even in a laboratory drilling test. In addition, very little data has been published on the effect of the rock type or rock properties on the wear or degradation of PDC bits,17,18) even though this issue is crucial in the estimation of the bit lifetime on the basis of geological information and the evaluation of their economic efficiency.
In the present study, laboratory drilling tests were performed using a PDC bit to evaluate the degradation of the drilling performance caused by bit wear. In the tests, five types of rock were drilled, and the drilled length reached about 98 m in total. The drilling performance and the progress of bit wear were evaluated for five types of rock. The correlation between the progress of bit wear and some indexes of rock abrasivity was discussed referring to the test results. In addition, the rate of penetration was formulated as a function of weight on bit using the drilling test results for other PDC bits with the same geometric design as that used in the present study and introducing a parameter that represents the drilling performance. The effects of the amount of bit wear and drilled rock type on the parameter introduced in the formulation were examined.
The quantitative estimation of the wear and the degradation of the drilling performance is essential for deciding which type of bit is suitable for certain geological conditions and deployment in the field and for planning efficient and economical drilling. The findings in the present study are expected to contribute to the promotion of the practical use of PDC bits for well drilling in various fields with greater economic efficiency.
The drilling apparatus shown in Fig. 1 was used in the laboratory tests. The apparatus has a maximum load of 294 kN, a maximum torque of 5 kN·m, a maximum rotary speed of 500 rpm, and a maximum flow rate of drilling fluid (water) of 220 L/min. The thrust and rotation forces are provided by a hydraulic unit and a direct-current motor, respectively. Drilling fluid is circulated using a mud pump to remove cuttings from the bore. The drilling depth (the displacement of the thrust yoke), weight on the bit (WOB), torque on the bit (TOB), rotary speed, and flow rate of the drilling fluid are measured using a displacement transducer, two load cells, a torque transducer, an electromagnetic tachometer, and a flowmeter, respectively. The rate of penetration (ROP) is calculated as the time derivative of drilling depth. The drilling apparatus is equipped with an automatic control function to maintain the ROP at a certain value specified by the user; thus, when the ROP begins to decrease owing to bit wear during drilling, the WOB is automatically increased so as to recover the ROP.

Drilling apparatus. (a) Overview. (b) Schematic illustration.
A PDC cutter is manufactured by sintering diamond powder and a cobalt binder on a cemented tungsten carbide (WC-Co) substrate under a high-pressure and -temperature condition19) and consists of polycrystalline diamond (PCD) and WC-Co layers, as shown in Fig. 2(a). The high-toughness WC-Co layer firmly supports the PCD layer and also serves as a brazing surface for attaching the PDC cutter to the bit body. The PDC cutters used in the present study are 13.44 mm in diameter and 8 mm in thickness. The thickness of the PCD layer is 1.6 mm. A scanning electron microscopy (SEM) image of the PCD layer is shown in Fig. 2(b), where the black and white areas are diamond grains and cobalt binders, respectively. The content of diamond grains determined by image analysis is approximately 92 vol%. The size of diamond grains determined by electron backscatter diffraction (EBSD) analysis20) ranges from about 2 to 30 × 10−6 m.

PDC cutter. (a) Structure. (b) SEM image of PCD layer.
A PDC bit is fabricated by brazing PDC cutters onto a bit body. Figure 3 shows an overview photograph and top-view illustration of the PDC bit used in the drilling tests. The bit is 216 mm (8.5 inches) in diameter and has 8 blades, 2 waterholes and 6 nozzle holes. A total of 58 PDC cutters (50 on the face, 8 on the gage) are attached to the bit body. 24 arrestors (3 on each blade) are mounted behind the PDC cutters in the nose and shoulder portions to suppress the impact on the PDC cutters during drilling. The back rake angle of every face cutter is 15°. The encircled numbers in Fig. 3(b) were assigned to the cutters on the bit.

Appearance of PDC bit used in the drilling tests. (a) Overview. (b) Top view.
Four types of andesite (Emochi An., Oga An., Shinkomatsu An., and Chigusa An.) and one type of granite (Inada Gr.) were used in the drilling tests. The dimensions of the rock samples were 320 × 320 × 800 mm3 for Emochi An. and 320 × 590 × 800 mm3 for the other rock types. One drilling trial was performed on each sample of Emochi An. and two drilling trials on each sample of the other rock types. The drilling depth was approximately 700 mm in each trial. Table 1 summarizes various properties of the rock samples. The mechanical characteristics, such as uniaxial compressive strength UCS, Young’s modulus, Poisson’s ratio, and indirect tensile strength ITS, were obtained from uniaxial compression tests and diametral tensile tests conducted on the test specimens recovered from each drilled rock sample. Other information in Table 1 is commonly thought to be closely related to rock abrasivity, according to earlier studies. The Cerchar abrasivity index CAI was obtained from Cerchar abrasivity tests.21) The equivalent quartz content EQC is expressed as
| \begin{equation} \mathit{EQC} = \sum\nolimits_{i} (S_{\text{i}}\cdot R_{\text{i}}), \end{equation} | (1) |

The drilling test consists of 14 test rounds. In each test round, 10 drilling trials on rock samples of Emochi An., Oga An., Shinkomatsu An., Chigusa An., and Inada Gr. (2 trials for each rock type) were performed. The ROP and rotary speed were kept constant during a drilling trial.
Drilling fluid was circulated at a flow rate of 210 L/min during drilling. The ROP was maintained at 70 mm/min until the drilling trial on the Chigusa An. sample in the 8th test round. In the following trials, the ROP was decreased to 35 mm/min, because there was a risk of an excessive torque being applied on the bit during the drilling of comparatively hard rock samples if the ROP continued to be set at 70 mm/min. For a similar reason, the rotary speed was maintained at 50 rpm until the 10th test round, after which it was increased to 100 rpm.
The drilling parameters, such as ROP, WOB, and TOB, were recorded by a data acquisition system. The wear flat length (WFL) of the 16 cutters (2 cutters on each blade) numbered 21 to 36 in Fig. 3(b), on which relatively large wear flat was observed, was measured after every 2 drilling trials. In the present study, WFL refers to the total length of the wear flat area on WC-Co and PCD layers measured along the axis of the cutter, as shown in Fig. 4.

Photos of worn cutter.
Figure 5 shows the uniaxial compressive strength of drilled rock samples UCS, WOB W, and TOB T versus drilled length Ld. The ROP u and rotary speed N are also displayed at the top of Fig. 5 and were successfully controlled, as described in 2.4. The Roman numerals in parentheses in Fig. 5 represent the number of the test round. WOB and TOB largely fluctuated with the rock type or UCS of drilled rock samples. Let us note the data for Emochi An. (white circles) and Inada Gr. (white squares) samples as the variation of UCS of those samples was comparatively small, as shown in Table 1. The WOB and TOB for Emochi An. and Inada Gr. samples generally increased with drilled length while the ROP and rotary speed were kept constant and appear to level off or decrease in the drilling trials on Emochi An. samples in the 9th and 11th test rounds and on Inada Gr. samples in the 8th and 11th test rounds, where the ROP was decreased or the rotary speed was increased. This is probably because the cutting depth for individual cutters on the rock sample is thought to be reduced owing to the halved ROP or doubled rotary speed.

Drilling parameters and UCS of drilled rock samples.
As shown in Fig. 6, WFL on each cutter lwf was almost equal to 0 until Ld ≈ 13 m. Although Ld at which lwf rises varies with the cutter, lwf of most of the cutters increased steeply from 1 mm to 2–3 mm, and then increased gently with Ld. Consequently, the lwf–Ld relationship after the rise of lwf appears convex upward on the whole with a few exceptions.

Wear flat length on each cutter lwf of (a) No. 21 to No. 28 and (b) No. 29 to No. 36.
Let us take the wear volume of cutters as an indicator of bit wear. Assuming that a cutter is a cylinder of diameter dc and that the wear flat is formed into a cut surface of the cylinder by a plane that forms the angle equal to the back rake angle θ with respect to the axis of the cylinder, the wear volume of a cutter vwc can be expressed using lwf as
| \begin{equation} v_{\text{wc}} = v_{\text{w0}} \times f(\alpha_{0}), \end{equation} | (2) |
| \begin{equation} v_{\text{w0}} = \frac{1}{\tan\theta} \cdot \left(\frac{d_{\text{c}}}{2} \right)^{3}, \end{equation} | (3) |
| \begin{equation} f(\alpha) = \sin \alpha - \alpha \cos \alpha - \frac{\sin^{3}\alpha}{3}, \end{equation} | (4) |
| \begin{equation} \alpha_{0} = \arccos \left(1 - \frac{l_{\text{wf}}\sin \theta}{d_{\text{c}}/2}\right). \end{equation} | (5) |

Wear volume of each cutter vwc of (a) No. 21 to No. 28 and (b) No. 29 to No. 36.
The wear resistance of the PCD layer is very much higher than that of the WC-Co layer. Thus, the wear volume of the PCD layer is a possible indicator of bit wear. The wear volume of the PCD layer vwd can be expressed using the thickness of the PCD layer td as
| \begin{equation} v_{\text{wd}} = v_{\text{wc}} = v_{\text{w0}} \times f(\alpha_{0}),\quad \text{for $l_{\text{wf}} \leq t_{\text{d}}/{\cos\theta}$} \end{equation} | (6) |
| \begin{equation} v_{\text{wd}} = v_{\text{w0}} \times (f(\alpha_{0}) - f(\alpha_{\text{d}})),\quad \text{for $l_{\text{wf}} > t_{\text{d}}/{\cos\theta}$} \end{equation} | (7) |
| \begin{equation} \alpha_{\text{d}} = \arccos \left(1 - \frac{l_{\text{wf}}\sin \theta - t_{\text{d}}\tan \theta}{d_{\text{c}}/2}\right). \end{equation} | (8) |

Wear volume of PCD layer on each cutter vwd of (a) No. 21 to No. 28 and (b) No. 29 to No. 36.

Average wear flat length Lwf, wear volume of cutter vwc, and wear volume of PCD layer vwd of cutters No. 21 to No. 36.
As mentioned in Introduction, very little data has been reported on the effect of the rock type or rock properties on the wear or degradation of PDC bits.17,18) Both rock type and UCS for drilled rock are generally thought to be important parameters affecting bit wear. As seen in Table 1, UCS for the Oga An., Shinkomatsu An., and Chigusa An. samples used in the drilling tests varied greatly. The distributions of UCS for the samples of those types of rock are shown in Fig. 10. Following the manner adopted in a previous study,18) we classified the rock samples into several groups in accordance with their UCS, as designated in Fig. 10. For example, the Oga An. samples were classified into soft, medium-hard, and hard samples, which are hereafter referred to as S-Oga An., M-Oga An., and H-Oga An., respectively. The rock samples of Shinkomatsu An. and Chigusa An. were classified into two groups.

Distributions of UCS for (a) Oga, (b) Shinkomatsu, and (c) Chigusa An. samples.
The rate of increase in Lwf (increase in Lwf per unit Ld) is thought to be closely associated with the abrasivity of drilled rock. Hereafter, Lwf in or after the 3rd test round is used, because Lwf remained nearly 0 until the 2nd test round. Figure 11(a) shows the rate of increase in Lwf plotted against UCS. The rate of increase in Lwf for Inada Gr. differs markedly from those for the other types of rock. The rate of increase in Lwf for andesite generally increases with increasing UCS, although the rate of increase in Lwf for S-Shinkomatsu An. is comparatively large.

Rate of increase in Lwf versus (a) UCS, (b) F, and (c) RAI.
In the present study, two possible indexes of rock abrasivity are examined: Schimazek’s F-abrasivity factor F23) and the rock abrasivity index RAI.24) F and RAI are widely used in the fields of civil and mining engineering to predict the wear of rock-cutting tools, although a mineralogical analysis, such as thin-section observation of the target rock, is required to obtain these indexes in addition to mechanical tests on the target rock. F and RAI are expressed as
| \begin{equation} F = \mathit{EQC} \cdot d_{\text{Qz}} \cdot \mathit{ITS}, \end{equation} | (9) |
| \begin{equation} \mathit{RAI} = \mathit{EQC} \cdot \mathit{UCS}, \end{equation} | (10) |
As described above, lwf seems to increase more steeply in the early test rounds than in the later test rounds. Thus, even if the same rock sample was drilled in an early and a later test round, the rate of increase in Lwf would be different. In contrast, as seen in Fig. 9, the rate of increase in Vwd (increase in Vwd per unit Ld) is almost constant after the 3rd test round, where the bit wear was apparently observed. Thus, the rate of increase in Vwd may be relatively well correlated with the indexes of rock abrasivity. Figure 12 shows the rate of increase in Vwd versus UCS, F, and RAI. Figure 12(a) indicates that the rate of increase in Vwd for andesite seems to have preferable correlation with UCS compared with that of Lwf. Similarly, there is a preferable correlation between the rate of increase in Vwd and F and RAI, as seen in Figs. 12(b) and (c). However, the continuity of the data remains unclear, because both the ordinate and abscissa for Inada Gt. are apart from those for the andesites in Figs. 12(b) and (c). Supplementary data obtained in the future, particularly in the range of F = 3–9 mm·MPa and RAI = 70–90 MPa, may improve the reliability and applicability of F and RAI as indexes of rock abrasivity for the PDC bit. The curve in Fig. 12(c) represents the least-squares exponential approximation:
| \begin{equation} \frac{dV_{\text{wd}}}{dL_{\text{d}}} = k \cdot \exp (\beta \cdot \mathit{RAI}), \end{equation} | (11) |
| \begin{equation} k = 0.037, \end{equation} | (12) |
| \begin{equation} \beta = 0.021, \end{equation} | (13) |
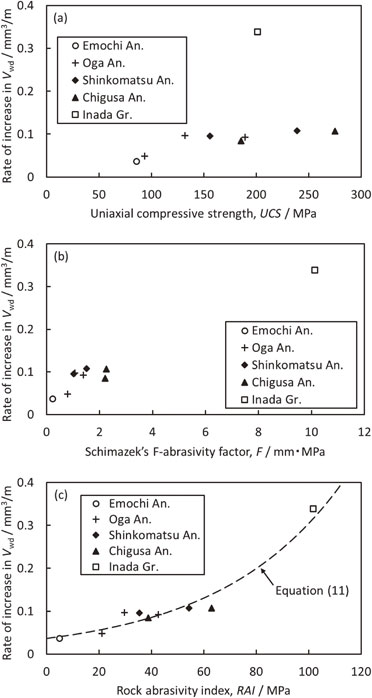
Rate of increase in Vwd versus (a) UCS, (b) F, and (c) RAI.
The relationship between ROP and WOB is an important indicator of the drilling performance of a bit for a type of rock. In this section, the formulation of the ROP–WOB relationship is examined referring to the other results of drilling tests using two PDC bits with the same geometric design as that used in the present study. Hereafter, the two PDC bits are referred to as Bits A and B. The drilling apparatus described in 2.1 was used in the laboratory drilling tests of Bits A and B.
For Bit A, firstly, the laboratory drilling tests were performed using Emochi An. and Oga An. samples. Secondly, Bit A was used for a field test in a geothermal well drilling site. A brief outline of the field test of Bit A is described in Table 2. Although the ROP reached 16 m/h at the beginning of the field test, it gradually decreased to 1.5 m/h while drilling through 161 m of rock formation consisting mainly of dacite tuff breccia, and then Bit A was judged to have reached the end of its life. The IADC dull grades25) for inner and outer rows (inner 2/3 and outer 1/3 of the bit diameter) were both determined to be 3, as shown in Table 2, indicating that the 3/8 of the total volume of the cutters on Bit A on average was worn away in the field test. After the field test, the laboratory drilling tests of Bit A were performed again. Hereafter, the laboratory tests before and after the field test are referred to as pretests and posttests, respectively. The penetration per revolution u/N obtained in the pretest and posttest increased with W linearly on the double logarithmic plot, as shown in Fig. 13. Comparing Figs. 13(a) and (b), u/N is found to decrease greatly owing to having been subjected to the field test.


Penetration per revolution u/N versus weight on bit W in (a) pretest and (b) posttest of Bit A.
For Bit B, firstly, the pretest was performed using an Emochi An. sample. Secondly, Bit B was used for a field test in a geothermal well drilling site. ROP fluctuated irregularly between 1–29 m/h while drilling through 309 m of rock formation consisting mainly of tuffaceous sandstone. As the drilled rock in the field test was thought to be considerably soft, no wear was observed on Bit B after the field test; the IADC dull grades for inner and outer rows were both determined to be 0, indicating that almost no wear was observed on the cutters on Bit B. The posttest was also performed for Bit B. Similar to Bit A, u/N for Bit B obtained in the pretest and posttest increased with W linearly on the double logarithmic plot, as shown in Fig. 14. The decrease in u/N owing to having been subjected to the field test is much smaller for Bit B than for Bit A.

Penetration per revolution u/N versus weight on bit W in pretest and posttest of Bit B.
Bingham26) mentioned an approximation in which u/N is proportional to the bth power of W, on the basis of a large amount of drilling data, and described that b ranges from 0.9 to 3.0 for most rocks and bits:
| \begin{equation} u/N = a \cdot W^{b}, \end{equation} | (14) |
The PDC bit used in the present drilling tests has the same geometric design as Bits A and B. Let us assume that the following expression is applicable to the results of these drilling tests:
| \begin{equation} u/N = a \cdot W^{2}, \end{equation} | (15) |
Applying eq. (15) to the present drilling test results, parameter a was found to change with increasing Ld, as shown in Fig. 15. The logarithm of a linearly decreased with Ld as an overall trend, fluctuating depending on the type of drilled rock. For example, a is comparatively high for Emochi An. and low for Shinkomatsu An. and Inada Gr. As shown in Fig. 16, a similar trend is seen in the relationship between a and Vwd after bit wear is observed. The decrease in a is caused by the progress of bit wear. Since Vwd is thought to be an appropriate indicator of the progress of bit wear, the relationship between a and Vwd is formulated below.

Parameter a versus drilled length Ld.

Parameter a versus wear volume of PCD layer Vwd.
The test results obtained in or after the 3rd test round are used for the formulation, because no bit wear was observed until the 2nd test round, as described in 3.2. The Oga An., Shinkomatsu An., and Chigusa An. samples were classified into several groups in accordance with their UCS, as described in 4.1. For these types of rock, the test results for S-Oga An., H-Shinkomatsu An., and S-Chigusa An. samples, which were the majority group of each rock type, are used for the formulation. The average slope of the approximated lines for each rock type on the semilogarithmic plot of a versus Vwd was −0.32. Thus, a is supposed to be expressed as
| \begin{equation} a = a_{0} \cdot \exp(-\gamma \cdot V_{\text{wd}}), \end{equation} | (16) |
| \begin{equation} \gamma = 0.32, \end{equation} | (17) |
| \begin{equation} a_{0} = p_{0} \cdot \mathit{UCS}^{-2}, \end{equation} | (18) |
| \begin{equation} p_{0} = 17.6. \end{equation} | (19) |
| \begin{equation} u/N = p_{0} \cdot \exp(-\gamma \cdot V_{\text{wd}}) \cdot (W/\mathit{UCS})^{2}, \end{equation} | (20) |
| \begin{equation} p = \frac{u/N}{(W/\mathit{UCS})^{2}} = p_{0} \cdot \exp (- \gamma \cdot V_{\text{wd}}), \end{equation} | (21) |

Parameter p versus wear volume of PCD layer Vwd.
As described in 3.2, no bit wear was observed until Ld = Ld0 ≈ 13 m. At Ld ≥ Ld0, supposing that Vwd increased with Ld in accordance with eq. (11), Vwd is expressed as
| \begin{equation} V_{\text{wd}} = k \int_{L_{\text{d0}}}^{L_{\text{d}}}\exp (\beta \cdot \mathit{RAI})\,dL_{\text{d}}. \end{equation} | (22) |
We have used several assumptions in the above formulation. The remaining issues regarding the assumptions are reviewed and summarized below.
(1) Rock abrasivityIn the present study, we considered Vwd to be an indicator of bit wear. Although the rate of increase in Vwd appeared to be preferably related to F and RAI, supplementary data is still required to improve the reliability and applicability of F and RAI as indexes of rock abrasivity for PDC bits. Since great amounts of time and labor are required to perform drilling tests using large-scale materials, e.g., rock samples, PDC bits, and drilling apparatus, wear tests using various types of rock and a single PDC cutter11,27–29) may be effective for efficiently obtaining much data concerning rock abrasivity for a PDC bit.
(2) ROP–WOB relationshipEquation (14)26) is the general form of eq. (15) used in the present study. b was slightly larger for the used bit than for the unused bit. However, b for the negligibly worn bit was nearly equal to that for the greatly worn bit. It is interesting how the parameters a and b in eq. (14) change with bit wear. This issue is expected to be clarified through a deliberate testing program (i.e., performing drilling tests to obtain the u/N–W relationship every few meters during a long-distance drilling test until bit wear progresses sufficiently).
(3) Degradation of drilling performanceThe degradation of drilling performance was represented by the decrease in a. In the present drilling test, five types of rock were repeatedly drilled in the same order, and a was found to exponentially decrease with Vwd after bit wear was observed. The validity of this finding is to be verified through drilling tests in which many samples of the same type of rock are successively drilled.
(4) Drillability of rockThe drillability of rock is represented by a0 in the present study. We supposed that a0 is inversely proportional to the square of UCS. However, it is unclear which characteristics of drilled rock strongly affect a0. The drillability of rock is closely associated with the cutting resistance or the force required to cut the rock with a certain cutting depth. The cutting test, in which various types of rock are cut with a single PDC cutter at a certain cutting depth,9,27,30–33) is one of the effective methods of measuring the cutting resistance directly. A large amount of data regarding the cutting resistance of rock is useful in determining which characteristics of drilled rock are strongly related to a0.
In the present study, laboratory drilling tests were performed using a PDC bit with a diameter of 216 mm (8.5 inches) to evaluate the degradation of the drilling performance caused by bit wear. The rate of increase in Vwd was found to be preferably correlated with F and RAI, although supplemental data is still required to improve the reliability of the correlation. On the basis of the drilling test results for other PDC bits with the same geometric design as that used in the present study, u/N was considered to be proportional to the square of W. The proportional constant, which represents the drilling performance, was found to exponentially decrease with Vwd after bit wear was observed. The drillability of rock was represented by a0 and was found to decrease with UCS, as expected. Several assumptions used in the formulation are to be verified by additional drilling tests using PDC bits and cutting tests using PDC cutters in the future.
This work was carried out as a research and development project of Japan Oil, Gas and Metals National Corporation (JOGMEC). We would like to express our gratitude to the staff of K. Maikai Co., Ltd., Chiba Factory for fabricating and providing the PDC bits. We would also like to thank the staff of Mitsubishi Materials Corporation Central Research Institute for fabricating and providing the PDC cutters. We deeply appreciate insightful discussions with Dr. Hirokazu Karasawa.
Let us assume that a PDC cutter is a cylinder of diameter dc and thickness td of the PCD layer and take the t-axis along the axis of the cylinder with the center of the circular surface of the PCD layer as the origin O, as shown in Fig. A1. The wear flat is thought to be the cut surface of the cylinder by a plane. In the figure, the angle AOB equals 2α0 and the length of TH equals lwf. The plane that forms the wear flat makes the angle θ equal to the back rake angle of the cutter (15° in the present study) with respect to the axis of the cylinder, as shown in Fig. A2. The t-coordinate of the tip of the wear flat T, tT, is equal to lwf cos θ.

Geometry of worn cutter.
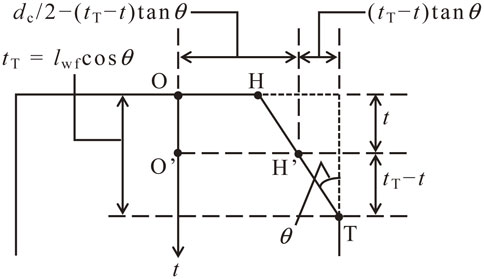
Side cross-sectional view of worn cutter.
The section cut by the plane t = t is illustrated in Fig. A3. The angle A′O′B′ is a function of t and is represented by 2α(t). The shaded portion in Fig. A3 corresponds to the worn part on the plane t = t. Let S(t) be the area of the shaded portion. Then the wear volume of a cutter vwc can be expressed as
| \begin{equation} v_{\text{wc}} = \int_{0}^{t_{\text{T}}}S(t)\,dt. \end{equation} | (A1) |
| \begin{equation} S(t) = \left(\frac{d_{\text{c}}}{2} \right)^{2}(\alpha (t) - \sin \alpha (t)\cos \alpha (t)). \end{equation} | (A2) |
| \begin{equation} \text{O$'$H$'$} =\frac{d_{\text{c}}}{2} -(t_{\text{T}} - t)\tan\theta, \end{equation} | (A3) |
| \begin{equation} \text{O$'$H$'$} = \left(\frac{d_{\text{c}}}{2} \right)\cos\alpha (t). \end{equation} | (A4) |
| \begin{equation} t = t_{\text{T}} - \frac{d_{\text{c}}}{2}\frac{1 - \cos\alpha (t)}{\tan\theta}. \end{equation} | (A5) |
| \begin{align} v_{\text{wc}} & = \frac{1}{\tan \theta} \cdot \left(\frac{d_{\text{c}}}{2} \right)^{3} \int_{0}^{\alpha_{0}}(\alpha \sin \alpha - \sin^{2}\alpha \cos \alpha)\,d\alpha\\ & = v_{\text{w0}} \times f(\alpha_{0}), \end{align} | (A6) |
| \begin{equation} v_{\text{w0}} = \frac{1}{\tan \theta} \cdot \left(\frac{d_{\text{c}}}{2} \right)^{3}, \end{equation} | (A7) |
| \begin{equation} f(\alpha) = \sin \alpha - \alpha \cos \alpha - \frac{\sin^{3}\alpha}{3}, \end{equation} | (A8) |
| \begin{equation} \alpha_{0} = \arccos \left(1 - \frac{t_{\text{T}}\tan \theta}{d_{\text{c}}/2}\right) = \arccos \left(1 - \frac{l_{\text{wf}}\sin \theta}{d_{\text{c}}/2}\right). \end{equation} | (A9) |

Top cross-sectional view of worn cutter.
The wear volume of the PCD layer vwd equals vwc when lwf is equal to or less than td/cos θ;
| \begin{equation} v_{\text{wd}} = v_{\text{wc}} = v_{\text{w0}} \times f(\alpha_{0}).\quad \text{for $l_{\text{wf}} \leq t_{\text{d}}/{\cos\theta}$} \end{equation} | (A10) |
| \begin{align} v_{\text{wc}} & = \frac{1}{\tan \theta} \cdot \left(\frac{d_{\text{c}}}{2} \right)^{3} \int_{\alpha_{\text{d}}}^{\alpha_{0}}(\alpha \sin \alpha - \sin^{2}\alpha \cos \alpha)\,d\alpha\\ & = v_{\text{w0}} \times (f(\alpha_{0}) - f(\alpha_{\text{d}})),\quad \text{for $l_{\text{wf}} > t_{\text{d}}/{\cos\theta}$} \end{align} | (A11) |
| \begin{align} \alpha_{\text{d}} &= \alpha (t_{\text{d}}) = \arccos \left(1 - \frac{(t_{\text{T}} - t_{\text{d}})\tan \theta}{d_{\text{c}}/2}\right) \\ &= \arccos \left(1 - \frac{l_{\text{wf}}\sin \theta - t_{\text{d}}\tan \theta}{d_{\text{c}}/2}\right). \end{align} | (A12) |