Abstract
This study aimed to understand the microstructural changes with reversion treatment in a 6061 aluminum alloy, such as dissolution of clusters formed during low temperature pre-aging. The specimens subjected to a solution treatment for 1.8 ks at 803 K and then pre-aged at 283 K for 604.8 ks were reheated under various temperature and time conditions. When reheated at 423 K, the hardness of the alloy specimen after reheating increased compared with that immediately after low temperature pre-aging. It was suggested that while the cluster dissolution hardly occurred during the reheating at 423 K, the formation of a strengthening phase from the supersaturated solid solution and transformation of some of the Mg–Si clusters formed during the low temperature pre-aging into the strengthening phase have occurred. In the case of reheating for 1 and 10 s at 523 K, which is commonly used as the reversion treatment temperature, the hardness of the final-aged specimen increased to the same level as that without low temperature pre-aging, indicating that the negative effect of two-step aging was mitigated. The mitigation of the negative effect was considered to be owing to microstructural changes, such as cluster dissolution, transformation of the Si-rich clusters, and precipitation of the strengthening phase during reheating at 523 K. Reheating above 573 K reduced the amount of age-hardening in the final-aging owing to the precipitation during the reheating. From these results, it is suggested that the adequate amount of solute atoms concentration in the matrix corresponding to that after a solution treatment could not be realized by the conventional reversion treatment.

1. Introduction
Al–Mg–Si alloys are heat-treatable alloys, and are widely used for automotive parts because of their excellent mechanical properties acquired through aging hardening and good formability. It is well known that storage of these allows at ambient temperatures before artificial aging reduces their strengthening after artificial aging compared to alloys that are aged immediately after quenching (the so-called “negative effect of two-step aging”).1–4) Numerous studies have been conducted on the mechanism of the adverse effect of the two-step aging, and it is considered that a clusters and/or Guinier–Preston (GP) zones formed at ambient temperatures are involved.3–10) Over the last 30 years, the composition and structure of clusters and/or GP zones, and their effects on the two-step aging behavior have been clarified using high-resolution transmission electron microscopy (HR-TEM) and three-dimensional atom probe tomography (3D-APT), in addition to differential scanning calorimetry (DSC).11–25) Yamada et al.14) revealed the existence of two different exothermic reactions at approximately 343 K by adiabatic calorimetry analysis. Serizawa et al.15,16) defined the above two types of exothermic reactions as Cluster (1), which occurs near the ambient temperature, and Cluster (2), which occurs near 373 K. In addition, from the results of the analyses using 3D-APT, it was observed that Cluster (1) does not dissolve during artificial aging at 443 K and inhibits the precipitation of the β′′ phase, while Cluster (2) enhances the precipitation of the β′′ phase. Recently, Aruga et al.23) proposed a cluster classification according to the composition based on the atomic density inside the clusters. Among the clusters formed during natural aging and pre-aging, the Si-rich clusters are those with Mg/(Mg + Si) less than 0.4, and the Mg–Si clusters are those with Mg/(Mg + Si) greater than 0.4. The Si-rich clusters cause a negative effect because they are difficult to transform into the β′′ phase and do not dissolve during artificial aging (443 K; 1.2 ks). The Mg–Si clusters can easily transform into the β′′ phase or serve as nuclei for the precipitation of the β′′ phase during artificial aging.24) Although there are some differences in the structure of the clusters13) and their effects on the two-step aging behavior,24,26) depending on the alloy composition, it is commonly understood that the negative effect is caused by the Si-rich clusters formed during natural aging, which inhibit the formation of the β′′ phase during artificial aging.
To mitigate the negative effects, especially enhance bake-hardening, high temperature pre-aging treatments and reversion treatments have been studied.27) In the reversion treatments, heating for a short time (a few to several tens of seconds) before artificial aging is conducted to aimed at dissolving the clusters formed during natural aging. The effects of reversion treatment conditions, such as temperature, time, and heating rate on subsequent artificial aging behavior have been reported.7,28–30) According to Nakamura et al.,29) the improvement of the negative effect was greatest in the reversion treated for 30 s at 523–548 K in 6061, 6022, and 6N01 alloys stored at room temperature for 10 to 60 days after quenching. However, it is also known that the hardness after the reversion treatment in Al–Mg–Si alloys is higher than that immediately after quenching.7) This is thought to be because the short-time heating in the temperature range of the reversion treatment not only causes a dissolution of the clusters, but also a precipitation of the strengthening phases.29,31) To explain the effect of the reversion treatment, it is essential to understand the microstructural changes, such as cluster dissolution and precipitation of the strengthening phase with short-time heating; however, there have been no detailed studies on this aspect.
In this study, a 6061 aluminum alloy (hereafter, referred to simply as 6061 alloy) subjected to pre-aging at a low temperature after solution treatment subsequent quenching was prepared. The short-time heating (referred to as “reheating”), which is equivalent to reversion treatment at several temperatures and times was conducted after low temperature pre-aging. The hardness and electrical conductivity of the specimens after reheating and subsequent artificial aging (referred to as “final-aging”) were measured. The cluster dissolution and precipitation of the strengthening phase behaviors with reheating were experimentally investigated through the evaluation of temperature and time dependence of various measured values as well as microstructural observations using SEM and DSC.
2. Experimental Procedure
A commercial 6061 alloy round-bar (extruded material) was used in this study. The chemical composition of the sample is summarized in Table 1. Tablet-shaped specimens with a diameter and height of 9 and 5 mm, respectively were machined from this round bar, and were subjected to heat treatments. Figure 1 shows a schematic diagram of the heat treatment process. The solution treatment was performed for 1.8 ks at 803 K, followed by quenching in ice water (referred to as “Q”). After quenching, the specimens were pre-aged at a low temperature. The low temperature pre-aging conditions were determined to be 604.8 ks at 283 K (referred to as “P”) based on the results of preliminary experiments. Some specimens, which were immediately reheated after quenching were also prepared (referred to as “without low temperature pre-aging”) to confirm their precipitation behavior during reheating. A high-frequency induction heating apparatus with an excellent temperature control was used for reheating. The surface of tablet-shaped specimen sprayed with a black coating, and temperature was measured successively with a radiation thermometer. The heating was controlled by adjusting the supply of power to the heating coil at 0.1 s intervals according to the temperature measured by the radiation thermometer. The temperature history measured by the radiation thermometer was checked every heating to confirm whether the heating was appropriate. The reheating was performed in the temperature range of 423–773 K. The specimens were heated to the target temperature, at a heating rate of 10 K/s and held for a standard holding time of 10 s. For comparison, two specimens to be reheated for 1 and 100 s were also prepared. In the figures subsequently presented, “R” represents specimens that were reheated, and the reheating temperature was followed by the holding time (e.g., R423 K_10 s represents a specimen that was held at 423 K for 10 s). After reheating, the specimens were subjected to final-aging for 28.8 ks at 453 K (referred to as “F”). To evaluate the mechanical properties, the Vickers hardness test was conducted under a test load of 100 gf (0.98 N) and a holding time of 10 s. The precipitation states were estimated using electrical conductivity measurements. The microstructures of the specimens were observed using scanning electron microscopy (SEM). For observations by SEM, the mechanically polished specimens were electropolished with a voltage of 10 V in an electrolyte consisting of HClO4 and methanol in a ratio of 1:4, maintained at approximately 258 K. Differential scanning calorimetry (DSC) analysis was performed to estimate the cluster dissolution and precipitation behavior with reheating. The heat flow was measured in the temperature range of 303 to 823 K, with a sample weight of 10 mg and heating rate of 10 K/min. A high-purity aluminum (99.99 mass%) sample was used as a reference.

Table 1 Chemical composition of the sample (mass%).
3. Experimental Results
3.1 Effect of reheating on hardness
Figure 2(a) shows the measured hardness values of the specimens reheated at each temperature and time, and after final-aging. The measurements immediately after quenching (Q) and after low temperature pre-aging (Q+P) are also shown in the figure. The hardness of Q was 51 HV, which increased to 74 HV after the low temperature pre-aging. The specimen reheated at 423 K for 10 s had its hardness increased to 85 HV. Furthermore, the hardness decreased with increasing reheating temperature; for example, the hardness after reheating at 773 K was 45 HV. For the specimens reheated at 423 K for 1 and 100 s, the hardness increased to the same level as that with a reheating time of 10 s, and it decreased to approximately 45 HV at 773 K. For all the reheating times, the hardness-decreasing behavior varied in three stages depending on the temperature range, as follows: (1) monotonous decrease, (2) stagnation, and (3) monotonous decrease. However, the switching over temperature from one stage to the next depended on the reheating time and decreased with increasing reheating time.

The hardness of Q increased from 51 to 119 HV by the final-aging (Q+F). On the other hand, the hardness of the specimen, which was subjected to final-aging after low temperature pre-aging (Q+P+F) was 106 HV, thus indicating the negative effect of the two-step aging. In the case of reheating at 423 K for 10 s, the hardness of the specimen increased to 113 HV after the final-aging. In the case of reheating at 523 K for 10 s, the hardness of the specimen after final-aging was almost the same as that of Q+F, thus suggesting that the negative effect was mitigated. At reheating temperatures between 523 and 673 K, the hardness after final aging was significantly decreased. On the other hand, in the case of reheating at 773 K, the hardness after final-aging increased remarkably and showed almost the same value as that of Q+F. The change in the hardness behavior after final-aging at a reheating time of 1 s was similar to that with 10 s. However, the hardness values at 573 and 673 K were 10 and 15 HV higher than those with 10 s of reheating time, respectively. On the other hand, in the case of reheating for 100 s, the hardness values after final-aging with reheating at 523, 673, and 773 K were significantly lower than those after 1 and 10 s.
Figure 2(b) shows the increase in the hardness during the final-aging of each specimen (referred to as “age-hardening”). The age-hardening of Q+F was 68 HV, while that of Q+P+F was 32 HV, which was approximately half that of the former. In the case of reheating at 423 K for 10 s, the age-hardening decreased by approximately 3 HV, compared with that of Q+P+F. The amount of age-hardening increased with increasing reheating temperature up to 523 K, then decreased with reheating temperature up to 673 K, and then again increased with reheating temperature up to 773 K. In the case of reheating for 1 and 100 s, the amount of age-hardening with reheating temperature changed as increase → decrease → increase as in the case of 10 s of reheating time. However, an increase in the reheating time caused a decrease in the temperature of the local maximum and local minimum, and hence, a decrease in the amount of age-hardening at these two points.
3.2 Effect of reheating on electrical conductivity
The effects of reheating temperature and time on the electrical conductivity of the specimens are shown in Fig. 3. This figure also shows the results of the final-aged specimens. The electrical conductivity of Q was 41.9%IACS, whereas that of Q+P was 39.1%IACS. In the case of reheating at 423 K for 10 s, the electrical conductivity was almost the same as that of Q+P. The electrical conductivity increased with increasing reheating temperature up to 673 K and then decreased with reheating temperature up to 773 K. The longer the holding time, the lower the reheating temperature which the electrical conductivity began to increase, and it shows a higher electrical conductivity at the maximum point. The electrical conductivity of Q+F was 43.8%IACS, whereas that of Q+P+F was 44.0%IACS. In the final-aged specimens with reheating at 423 K, the electrical conductivity of specimens reheated for 10 and 1 s was the same as that of Q+P+F, although the electrical conductivity with reheating for 100 s was slightly higher than that of Q+P+F. The electrical conductivity increased with increasing reheating temperature from 473 to 673 K, reached a maximum at approximately 673 K, and then decreased as the reheating temperature was increased up to 773 K. The electrical conductivity at the maximum point was 46.6%IACS regardless of the reheating time, although a longer reheating time caused a decrease in the reheating temperature which the conductivity began to increase.

Figure 4 shows SEM micrographs of specimen Q and specimens reheated at 523, 673, and 773 K for 10 s after low temperature pre-aging. Granular compounds with diameters of several hundred nm were observed in Q. In the specimens reheated at 523 K after low temperature pre-aging, in addition to the granular compounds as those present in Q, precipitated phases with a size of several tens of nm were observed on the grain boundaries. In the specimen reheated at 673 K after low temperature pre-aging, a precipitated phase with a size of several tens of nm was observed on the grain boundary. In addition, a rod-like precipitate phase, several tens of nm in diameter and several hundreds of nm in length were observed in the grain. In the specimen reheated at 773 K after low temperature pre-aging, only granular compounds, as were found in Q were observed.
3.4 DSC analysis
DSC curves of specimen Q, Q+P, and specimens reheated at 423, 523, 673, and 773 K for 10 s after low temperature pre-aging are shown in Fig. 5. In the case of Q, the exothermic peaks A, C, D, and E existed at temperatures of approximately 366, 515, 560, and 756 K, respectively. The endothermic peak B existed at a temperature of approximately 475 K. It is suggested that the exothermic peaks A, C, D, and E were related to the formation of clusters, and the precipitation of the β′′, β′, and β phases, respectively, while the endothermic peak B was related to the dissolution of clusters.32–34) The alloy used in this experiment contains Cu. It has been confirmed that the Q phase and its intermediate phases (Q′, L, S, C, QC) are precipitated in Al–Mg–Si alloys containing Cu.35) The Cu-containing precipitates form at temperatures close to those of the β phase and its intermediate phases.36,37) Although the DSC peaks of the Q phase and its intermediate phase and the β phase and its intermediate phase overlap and cannot be distinguished, we believe that Cu-containing precipitates also exist. Since the existence of Cu-containing precipitates could not be clearly confirmed in this experiment, we will assume that the main precipitation phases are the β phase and its intermediate phases in the following discussion.

In the case of Q+P, the exothermic peak A was more obscure than that of Q, while the endothermic peak B was more clearly visible and the peak position shifted to approximately 10 K higher. In addition, the exothermic peak C became larger and the peak position shifted to approximately 10 K higher than that of Q. In the specimen reheated at 423 K after low temperature pre-aging, no clear difference in the behavior from that of Q+P was observed. In the specimen reheated at 523 K after low temperature pre-aging, the exothermic peak A and endothermic peak B had disappeared. The exothermic peak C was smaller than that of the specimens reheated at 423 K after low temperature pre-aging as well as that of Q+P, and the peak position was shifted to approximately 10 K lower. In addition, the exothermic peak C′ existed at the base of the low-temperature side of the exothermic peak C. In the case of the specimen reheated at 673 K after low temperature pre-aging, one broad peak existed at approximately 538 K. This peak was considered to be an exothermic peak D related to the precipitation of the β′ phase, which will be discussed in detail shortly. The DSC curve of the specimen reheated at 773 K after low temperature pre-aging was very similar to that of Q.
4. Discussions
In the following paragraphs, the effects of reheating on the microstructure, for example, on cluster dissolution and precipitation of β(Mg2Si) intermediate phases, will be discussed based on the DSC analysis and SEM observations under a reheating time of 10 s.
4.1 Microstructural changes with low temperature pre-aging
In the case of Q+P, the hardness increased and the electrical conductivity decreased compared to that of Q. In the case of Q+P+F, the hardness was approximately 15 HV lower than that of Q+F, indicating the negative effect of the two-step aging. These changes in the hardness and electrical conductivity suggested the formation of clusters during low temperature pre-aging.38) In the case of Q+P, the endothermic peak B at approximately 475 K, which was related to the dissolution of the clusters, became clearer in the DSC curve (see Fig. 5), and the temperature of the exothermic peak C, which was related to the precipitation of the β′′ phase, shifted higher by approximately 10 K. This shift in the peak was considered to be owing to the formation of the β′′ phase after the dissolution and re-solution into the aluminum matrix of the clusters during the heating in the DSC measurement.39) These results suggest that a large number of clusters existed after low temperature pre-aging. In this study, we refer to the clusters that had a negative effect on the two-step aging as Si-rich clusters and those that had a positive effect as Mg–Si clusters, following the work by Aruga et al.23) Since this alloy contains Cu, it is considered that Cu atoms are also included in these clusters. It is suggested that Cu atoms suppress the formation of Si-rich clusters and enhances the formation of Mg–Si clusters by interacting with Si and Mg atoms,39) and we believe that the same situation occurs in this experiment.
4.2 Microstructural changes with reheating at 423 K
The hardness of the specimens reheated at 423 K after low temperature pre-aging increased by 10 HV compared with that of Q+P. However, after the final-aging, the hardness of the specimens was 8 HV lower than that of Q+F. It was expected that the increase in the hardness after reheating and the decrease in the amount of age-hardening were attributed to precipitation during the reheating. To confirm the precipitation behavior during the reheating, the hardness and electrical conductivity of the specimens reheated for 10 s immediately after quenching (without low temperature pre-aging, i.e., Q+R), and those subjected to final-aging (i.e., Q+R+F) were measured. The results are shown in Figs. 6 and 7, respectively. For an easier comparison of the specimens with and without low temperature pre-aging, the results of reheating for 10 s shown in Figs. 2 and 3 were also shown in Figs. 6 and 7, respectively. Figure 6 shows that the hardness of the specimen reheated at 423 K without low temperature pre-aging increased by approximately 5 HV compared to that of Q, suggesting the formation of strengthening phases even after heating at 423 K for 10 s. On the other hand, the hardness of the specimens reheated at 423 K after low temperature pre-aging increased by 10 HV compared with that of Q+P. This is inferred to be because of the transformation of clusters. Some of these clusters, such as Mg–Si clusters, were easily transformed into the β′′ phase or dissolution.24) Therefore, they may have formed a strengthening phase, such as the β′′ phase during the reheating in the pre-aged specimens. However, most of the clusters were expected to remain during reheating, as there was no clear difference in the DSC curve between the specimens reheated at 423 K for 10 s and specimen Q+P.

For the specimen reheated at 523 K after the low temperature pre-aging, the hardness decreased and the electrical conductivity increased when compared to Q+P. In addition, after the final-aging, the hardness increased to the same level as that of Q+F, indicating that the negative effect was mitigated (see Fig. 2(a)). The amount of age-hardening increased by 60% compared to that of Q+P+F (Fig. 2(b)). This suggests that reheating at 523 K caused the dissolution of clusters. On the other hand, the hardness of the reheated specimen was larger than that of Q, while the electrical conductivity was smaller than that of Q. In addition, the amount of age-hardening was approximately 25% lower than that of Q+F. These results indicate that cluster dissolution and precipitation of strengthening phases occurred simultaneously during the reheating, as mentioned in other studies.29,31) As shown in Fig. 6, the hardness of the specimens reheated at 523 K without low temperature pre-aging increased by 8 HV compared with that of Q, and the increase in the hardness was considered to be because of the precipitation of strengthening phases by reheating. On the other hand, the hardness of the specimen reheated at 523 K after low temperature pre-aging was approximately 10 HV greater than that of the specimens without low temperature pre-aging. The electrical conductivity of the specimen reheated at 523 K after low temperature pre-aging was approximately 1.7% IACS lower than that of Q (see Fig. 7), suggesting that some clusters remained even after the reheating. The DSC curve of the specimen reheated at 523 K after low temperature pre-aging showed an exothermic peak C related to the precipitation of the β′′ phase around 513 K and the exothermic peak C′ at the base of the low-temperature side. These two peaks existed because of the difference in the formation process of the β′′ phase.39,40) Because the exothermic peak C existed at the same temperature as that of Q, it was assumed that this peak was the reaction of precipitation of the β′′ phase from (via a precursor stage) the supersaturated solid solution (referred to as “SSSS”). Therefore, peak C′ was interpreted as a reaction, in which the β′′ phase was formed with less energy than that precipitated from (via a precursor stage) the SSSS. If the clusters remained after reheating and formed the β′′ phase via dissolution and re-solution during the DSC measurement, it is expected that the peak would have appeared at a higher temperature than that of C. In other words, the existence of peak C′ suggests that the clusters did not simply remain, but underwent some type of structural change due to reheating, which caused them to transform into the β′′ phase during the DSC measurement. For example, Kim et al.41) investigated the thermal stability of clusters formed during pre-aging at the room temperature or 373 K in Al–Mg–Si(–Cu) alloys. They proposed that some of the clusters formed during the pre-aging at the room temperature (Cluster (1)) transformed into precursors of the β′′ phase (Pre-β′′ phase) during the early stages of artificial aging at 523 K. Assuming that the Si-rich clusters were transformed into the Pre-β′′ phase owing to reheating at 523 K, it was inferred that the peak C′ could be explained as the reaction transformed into the β′′ phase from the Pre-β′′ phase. From the above, it is suggested that the reheating at 523 K caused complex microstructural changes, such as cluster dissolution, transformation of Si-rich clusters into the Pre-β′′ phase, and precipitation of the strengthening phases such as the β′′ phase from SSSS. The dissolution of the clusters increased the number of solute atoms in the matrix and hence, the age hardenability improved compared to that of Q+P. At the same time, its age hardenability was lower than that of Q+F because the solute atoms were consumed by the strengthening phase and the Pre-β′′ phase formed by the reheating.
4.4 Microstructural changes with reheating more than 573 K
In the case of reheating at 573 K, although the hardness after the reheating was the same as that of the specimens reheated at 523 K, the hardness after final-aging was 18 HV lower than that of the specimens reheated at 523 K. As can be seen from Fig. 6, for the specimens that were reheated without low temperature pre-aging, the highest hardness was obtained at 573 K. It is suggested that reheating at 573 K resulted in the formation in larger volumes of strengthening phases, such as the β′′ phase than at other reheating temperatures. In addition, the electrical conductivity of the specimen reheated at 573 K without low temperature pre-aging increased compared to that of Q (see Fig. 7), suggesting that precipitation had progressed. Furthermore, based on the DSC curve of Q, because the exothermic peak D related to the formation of the β′ phases existed around 553 K (see Fig. 5), it is expected that the β′ phases precipitated during the reheating at 573 K. It was assumed that the β′ phases and the corresponding intermediate phase consumed many solute atoms in the matrix, although their contribution to the strength was small.12) The hardness of the specimen reheated at 673 K after the low temperature pre-aging was showed same level as that of Q (see Fig. 2(a)), but the amount of age-hardening was significantly lower (see Fig. 2(b)). As shown in Fig. 4, the specimens reheated at 673 K had a high density of coarse precipitates, which could be observed in the SEM images, suggesting that the reheating at 673 K led to over-aging. Although a detailed analysis of these precipitates was not carried out, they were considered to be precipitates corresponding to the β′ phase from their shape and size.42) In the DSC curve of the specimen reheated at 673 K, a broad peak was observed at approximately 543 K. Because a large amount of β′ phase was already present after reheating, it was assumed that the peak related to the precipitation of the β′ phase existed at a lower temperature, and was broader than in the other specimens. In the case of the specimen reheated at 773 K, the hardness and electrical conductivity after reheating had almost the same values as those of Q, and after the final-aging, almost the same value as those of Q+F. Moreover, the DSC curve was very similar to that of Q. Therefore, it was inferred that the reheating at 773 K caused the microstructural changes corresponding to a solution treatment. The hardness and electrical conductivity of the specimens after the reheating and final-aging, when reheated above 573 K, were almost the same regardless of whether or not they were pre-aged (see Figs. 6 and 7). This suggests that reheating above 573 K cancelled the effect of low temperature pre-aging (i.e., formation of clusters).
4.5 Effect of reheating time on microstructure
In the above, microstructural changes with reheating were discussed based on the results of a reheating time of 10 s. Although it is expected that the microstructural changes that occurred at a particular temperature were almost the same for reheating times of 1 and 100 s, as in the case of 10 s, the degree of microstructural change would be different depending on the reheating time. Figure 8 summarizes the reheating temperatures, at which hardness-decreasing behavior of after reheating switches over and, at which the amount of age-hardening showed a local maximum and local minimum, for each reheating time. From Fig. 8, it can be seen that the reheating temperatures, at which the hardness-decreasing behavior was switched on, were almost same as the reheating temperatures, at which the amount of age-hardening showed the local maximum and local minimum. Considering the microstructural changes during the reheating for 10 s, at the temperature, at which the hardness-decreasing behavior was switched on from (1) monotonous decrease to (2) stagnation and the amount of age-hardening was a local maximum, the cluster dissolution had a significant effect on the hardness. On the other hand, at the temperature, at which the hardness-decreasing behavior was switched on from (2) stagnation to (3) monotonous decrease, and the amount of age-hardening was a local minimum, the strengthening phases from some clusters and the SSSS determine the hardness after reheating. From the above, it can be inferred that the temperature range, in which the hardness-decreasing stagnated after the reheating was the result of a balance between the hardness reduction owing to the cluster dissolution and hardening owing to the precipitation of the strengthening phase. The temperature range, in which the hardness-decreasing stagnated after the reheating shifted to a lower temperature as the reheating time was increased, suggesting that a longer reheating time would lead to an acceleration of microstructural changes, such as cluster dissolution and precipitation at lower temperatures. In addition, the hardness and electrical conductivity changed clearly even after a very short reheating as 1 s. Si-rich and Mg–Si clusters formed during low temperature pre-aging contain vacancies.43) Therefore, it is considered that dissolution and/or transformation into the β′′ phase or Pre-β′′ phase occur even after reheating for only 1 s.

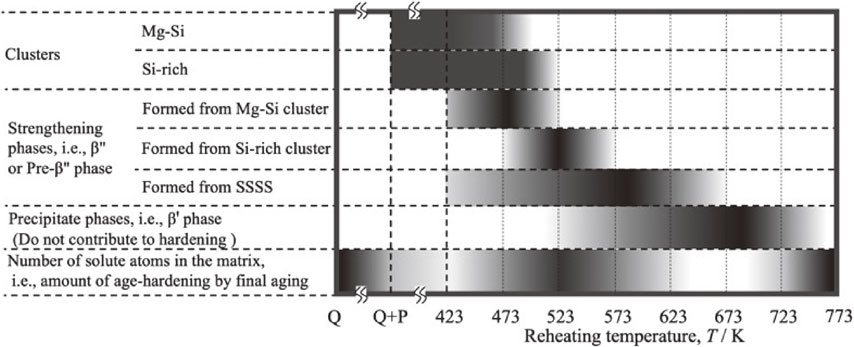
From the above discussion, the existence of phases and the number of solute atoms in the matrix after reheating for 10 s is summarized in Fig. 9. The color gradation in the figure indicates the amount of object. In the after the low temperature pre-aging, a large number of clusters (Mg–Si and Si-rich clusters) were presented. These clusters dissolves and/or transforms into the strengthening phases as the reheating temperature increases (423 to 523 K). In addition, the formation of the strengthening phases from the SSSS also occurs (around 573 K). As reheating temperature is increased further (573 K or more), the strengthening phases grows into precipitate phases that do not contribute to the hardening, and eventually dissolves. Since the reversion treatment is aimed at dissolving the clusters formed during the low temperature pre-aging, it is ideal for the matrix after the reversion treatment to have a high solute concentration corresponding to that after a solution treatment. On the other hand, present study showed that the reheating mitigating the negative effect of two-step aging (523 K in this experiment) resulted in not only the dissolution of clusters but also the precipitation of strengthening phase and the transformation of Si-rich clusters. This study experimentally revealed that the high solute concentration of the matrix corresponding to that after a solution treatment could not be obtained in conventional reversion treatment.
5. Conclusions
In this study, to understand the microstructural changes during reheating, which is equivalent to a reversion treatment, 6061 alloy specimens subjected to pre-aging at a low temperature after solution treatment was prepared, and subjected to reheating at several temperatures and holding times. The reheating temperature and time dependence of the hardness and electrical conductivity of the reheated and finally aged specimens were evaluated. The cluster dissolution and precipitation of β(Mg2Si) intermediate phases owing to reheating were experimentally investigated through microstructural observations using SEM and DSC measurements. The results of this study revealed the following:
-
(1)
The reheating treatment in this study resulted in a complex microstructural change with a mixture of dissolution of clusters and precipitation of strengthening phases, and revealed that an adequate amount of solute concentration corresponding to a solution treatment could not be realized.
-
(2)
In the case of reheating at 423 K, the hardness after reheating increased compared with that after the low temperature pre-aging. This was thought to be owing to the formation of the strengthening phases formed from the supersaturated solid solution and the transformation from some of the Mg–Si clusters, while cluster dissolution hardly occurred.
-
(3)
Reheating at 523 K, which is commonly used as the reversion treatment temperature, was considered to cause complex microstructural changes, such as cluster dissolution, formation of a strengthening phase from supersaturated solid solutions, and transformation of some of the clusters. Particularly, by assuming that some of the Si-rich clusters were transformed into the Pre-β′′ phase, the hardness and electrical conductivity as well as the DSC measurement results could be explained.
-
(4)
In the case of reheating at 673 K, a large amount of coarse precipitation (presumably β′ phase) that did not contribute to the hardness was formed even after a short heating time of 10 s. Reheating at 773 K was considered to cause microstructural changes equivalent to a solution treatment.
-
(5)
Microstructural changes, such as cluster dissolution, and formation of a strengthening phase from supersaturated solid solutions and from some of the clusters formed during low temperature pre-aging were accelerated at lower temperatures with longer reheating times.
Acknowledgments
The present study was financially supported in part by the Light Metal Educational Foundation, Inc.
REFERENCES
- 1) R. Kawachi: J. JILM 1955 (1955) 47–51. doi:10.2464/jilm.1955.47
- 2) Y. Mishima: J. JILM 1955 (1955) 52–58. doi:10.2464/jilm.1955.52
- 3) Y. Baba and A. Takashima: J. JILM 19 (1969) 90–98. doi:10.2464/jilm.19.90
- 4) H. Suzuki, M. Kanno and Y. Shiraishi: J. JILM 29 (1979) 197–203. doi:10.2464/jilm.29.197
- 5) C. Panseri and T. Federighi: J. Inst. Met. 94 (1966) 99–107.
- 6) D.W. Pashley, M.H. Jacobs and J.T. Vietz: Philos. Mag. 16 (1967) 51–76. doi:10.1080/14786436708229257
- 7) K. Asano, S. Fujikawa and K. Hirano: Bull. Japan Inst. Metals 7 (1968) 457–466. doi:10.2320/materia1962.7.457
- 8) H. Mochizuki, S. Fujikawa and K. Hirano: J. JILM 21 (1971) 512–519. doi:10.2464/jilm.21.512
- 9) S. Muromachi and T. Mae: J. Jpn. Inst. Metals 38 (1974) 130–138. doi:10.2320/jinstmet1952.38.2_130
- 10) H. Suzuki, M. Kanno and G. Itoh: J. JILM 30 (1980) 609–616. doi:10.2464/jilm.30.609
- 11) K. Matsuda, T. Yoshida, H. Gamada, K. Fujii, Y. Uetani, T. Sato, A. Kamio and S. Ikeno: J. Jpn. Inst. Metals 62 (1998) 133–139. doi:10.2320/jinstmet1952.62.2_133
- 12) G.A. Edwards, K. Stiller, G.L. Dunlop and M.J. Couper: Acta Mater. 46 (1998) 3893–3904. doi:10.1016/S1359-6454(98)00059-7
- 13) M. Murayama and K. Hono: Acta Mater. 47 (1999) 1537–1548. doi:10.1016/S1359-6454(99)00033-6
- 14) K. Yamada, T. Sato and A. Kamio: J. JILM 51 (2001) 215–221. doi:10.2464/jilm.51.215
- 15) A. Serizawa, S. Hirosawa and T. Sato: Mater. Sci. Forum 519–521 (2006) 245–250. doi:10.4028/www.scientific.net/MSF.519-521.245
- 16) A. Serizawa, S. Hirosawa and T. Sato: Metall. Mater. Trans. A 39 (2008) 243–251. doi:10.1007/s11661-007-9438-5
- 17) S. Pogatscher, H. Antrekowitsch, H. Leitner, T. Ebner and P.J. Uggowitzer: Acta Mater. 59 (2011) 3352–3363. doi:10.1016/j.actamat.2011.02.010
- 18) K. Takata, J. Takahashi, M. Saga, K. Ushioda, A. Hibino and M. Kikuchi: J. Jpn. Inst. Metals 76 (2012) 677–683. doi:10.2320/jinstmet.76.677
- 19) L. Cao, P.A. Rometsch and M.J. Couper: Mater. Sci. Eng. A 559 (2013) 257–261. doi:10.1016/j.msea.2012.08.093
- 20) Y. Aruga, M. Kozuka, Y. Takaki and T. Sato: Mater. Sci. Eng. A 631 (2015) 86–96. doi:10.1016/j.msea.2015.02.035
- 21) G.H. Tao, C.H. Liu, J.H. Chen, Y.X. Lai, P.P. Ma and L.M. Liu: Mater. Sci. Eng. A 642 (2015) 241–248. doi:10.1016/j.msea.2015.06.090
- 22) A. Poznak, R.K.W. Marceau and P.G. Sanders: Mater. Sci. Eng. A 721 (2018) 47–60. doi:10.1016/j.msea.2018.02.074
- 23) Y. Aruga, M. Kozuka and T. Sato: J. Alloy. Compd. 739 (2018) 1115–1123. doi:10.1016/j.jallcom.2017.10.220
- 24) Y. Aruga, S.N. Kim, M. Kozuka, E. Kobayashi and T. Sato: Mater. Sci. Eng. A 718 (2018) 371–376. doi:10.1016/j.msea.2018.01.086
- 25) O. Engler, C.D. Marioara, Y. Aruga, M. Kozuka and O.R. Myhr: Mater. Sci. Eng. A 759 (2019) 520–529. doi:10.1016/j.msea.2019.05.073
- 26) J.H. Kim, C.D. Marioara, R. Holmestad, E. Kobayashi and T. Sato: Mater. Sci. Eng. A 560 (2013) 154–162. doi:10.1016/j.msea.2012.09.051
- 27) H. Hatta, S. Matsuda, H. Tanaka and H. Yoshida: J. JILM 59 (2009) 248–253. doi:10.2464/jilm.59.248
- 28) H. Nakamura: J. JILM 23 (1973) 360–367. doi:10.2464/jilm.23.360
- 29) T. Nakamura, K. Morita, M. Nagai and S. Komatsu: J. JILM 59 (2009) 128–133. doi:10.2464/jilm.59.128
- 30) M. Madanat, M. Liu and J. Banhart: Acta Mater. 159 (2018) 163–172. doi:10.1016/j.actamat.2018.07.066
- 31) H. Uchida and H. Yoshida: J. JILM 46 (1996) 427–431. doi:10.2464/jilm.46.427
- 32) I. Dutta and S.M. Allen: J. Mater. Sci. Lett. 10 (1991) 323–326. doi:10.1007/BF00719697
- 33) W.F. Miao and D.E. Laughlin: Scr. Mater. 40 (1999) 873–878. doi:10.1016/S1359-6462(99)00046-9
- 34) L.C. Doan, Y. Ohmori and K. Nakai: Mater. Trans. 41 (2000) 300–305. doi:10.2320/matertrans1989.41.300
- 35) C.D. Marioara, S.J. Andersen, J. Røyset, O. Reiso, S. Gulbrandsen-Dahl, T.-E. Nicolaisen, I.-E. Opheim, J.F. Helgaker and R. Holmestand: Metall. Mater. Trans. A 45 (2014) 2938–2949. doi:10.1007/s11661-014-2250-0
- 36) P. Lang, E. Povoden-Karadeniz, A. Falahati and E. Kozeschnik: J. Alloy. Compd. 612 (2014) 443–449. doi:10.1016/j.jallcom.2014.05.191
- 37) J.K. Sunde, C.D. Marioara and R. Holmestand: Mater. Charact. 160 (2020) 110087. doi:10.1016/j.matchar.2019.110087
- 38) M. Kanno, H. Suzuki and Y. Shiraishi: J. JILM 28 (1978) 553–557. doi:10.2464/jilm.28.553
- 39) J.H. Kim, E. Kobayashi and T. Sato: Mater. Trans. 52 (2011) 906–913. doi:10.2320/matertrans.L-MZ201121
- 40) Y. Takaki, T. Masuda and T. Sato: J. JILM 63 (2013) 245–252. doi:10.2464/jilm.63.245
- 41) J.H. Kim, S.N. Kim, E. Kobayashi and T. Sato: Mater. Trans. 55 (2014) 768–773. doi:10.2320/matertrans.M2013411
- 42) K. Matsuda and S. Ikeno: J. JILM 50 (2000) 23–36. doi:10.2464/jilm.50.23
- 43) K. Yamada and T. Sato: J. Jpn. Inst. Metals 65 (2001) 897–902. doi:10.2320/jinstmet1952.65.10_897


